Bermaui Deviation Percent
- Göstergeler
- Muhammad Elbermawi
- Sürüm: 6.1
- Güncellendi: 28 Mart 2020
- Etkinleştirmeler: 20
Veya oynaklığı puan yerine yüzde olarak ölçen bir oynaklık endeksi olan ( BD% ). BD% fikri, yüzde 0 ile 100 arasında hareket eden Klasik Standart Sapma'ya (CSD) bağlı bir endeks yapmaktır.
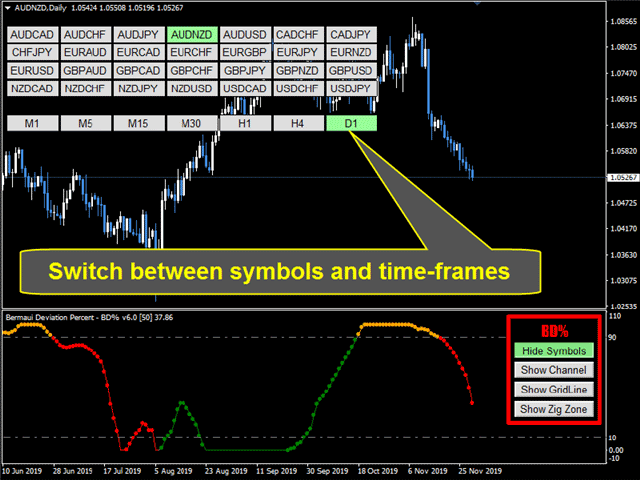
Farklı zaman dilimlerinde veya farklı zaman dilimlerinde aynı güvenlik için oynaklığı karşılaştırmak için BD%'yi kullanabilirsiniz. Ayrıca, farklı piyasalardaki farklı menkul kıymetler arasındaki oynaklığı puan yerine yüzde cinsinden karşılaştırmak için BD%'yi kullanabilirsiniz.
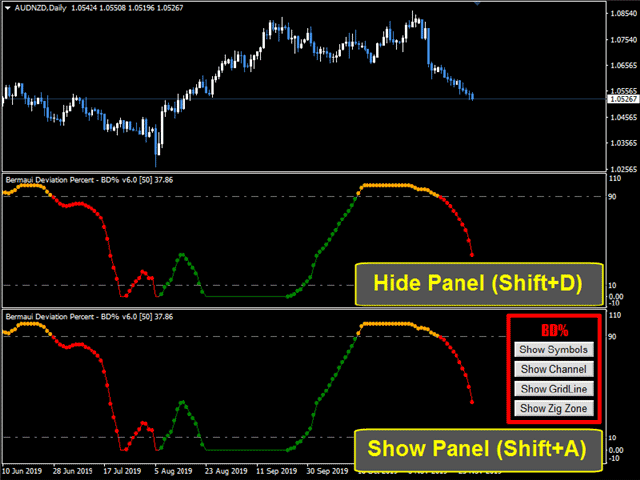
"BD%" NASIL KULLANILIR
Herhangi bir sorunuz varsa, lütfen bana özel mesaj yoluyla ulaşın veya yorum bölümüne yazın.
Muhammed Al Bermaui, CMT
Farklı zaman dilimlerinde veya farklı zaman dilimlerinde aynı güvenlik için oynaklığı karşılaştırmak için BD%'yi kullanabilirsiniz. Ayrıca, farklı piyasalardaki farklı menkul kıymetler arasındaki oynaklığı puan yerine yüzde cinsinden karşılaştırmak için BD%'yi kullanabilirsiniz.
"BD%" NASIL KULLANILIR
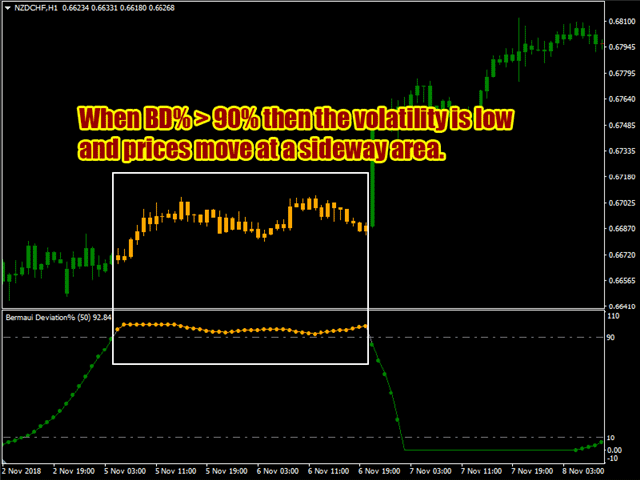
- BD%, %90'ın altındaysa ve bu seviyeyi yukarı doğru geçerse, bu, fiyatların değişen bir alanda hareket edebileceğinin bir işaretidir.
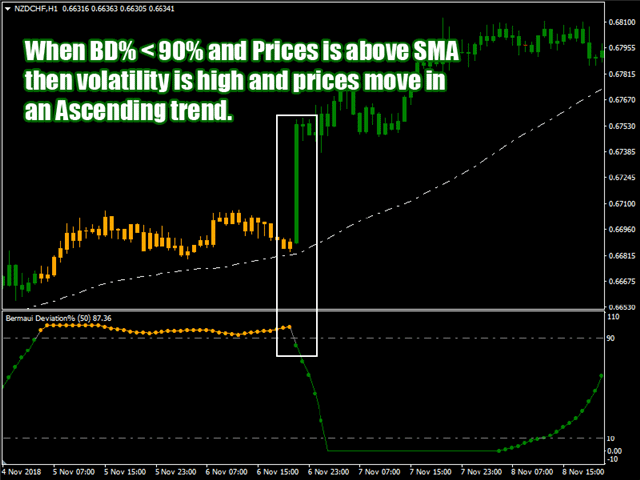
- BD%, %90'ın üzerindeyse ve ardından bu seviyeyi aşağı doğru geçerse ve fiyat zaten basit hareketli ortalamasının üzerindeyse, bu yeni bir yükselen trendin başlangıcının işaretidir. BD% aşağı yönde derinleştikçe, oynaklık ve trend gücü artıyor. BD%, %0 olduğunda, bu, oynaklığın en yüksek değerinde olduğu anlamına gelir.
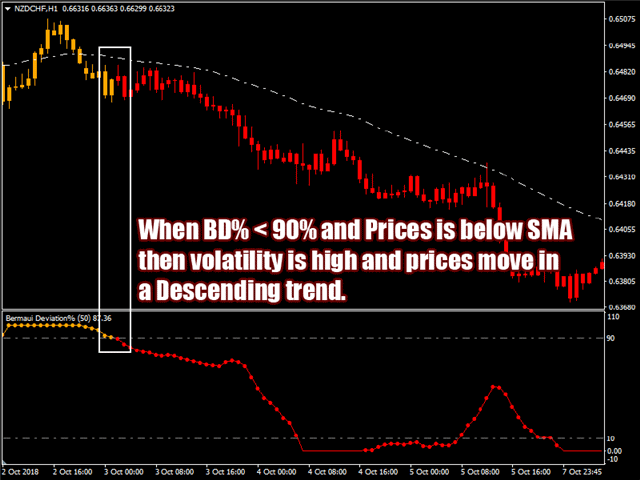
- BD%, %90'ın üzerindeyse ve ardından bu seviyeyi aşağı doğru geçerse ve fiyat zaten basit hareketli ortalamasının altındaysa, bu yeni bir düşüş eğiliminin başladığının işaretidir. BD% aşağı yönde derinleştikçe, oynaklık ve trend gücü artıyor. BD%, %0 olduğunda, bu, oynaklığın en yüksek değerinde olduğu anlamına gelir.
Herhangi bir sorunuz varsa, lütfen bana özel mesaj yoluyla ulaşın veya yorum bölümüne yazın.
Muhammed Al Bermaui, CMT


It works really great. Now I can find the trade which is really trending! The sellers produckt is really good quality. Try also his TDO you will not regret it!