• 概要
  • レビュー (2)
  • コメント (13)
  • 最新情報

EMA Separation

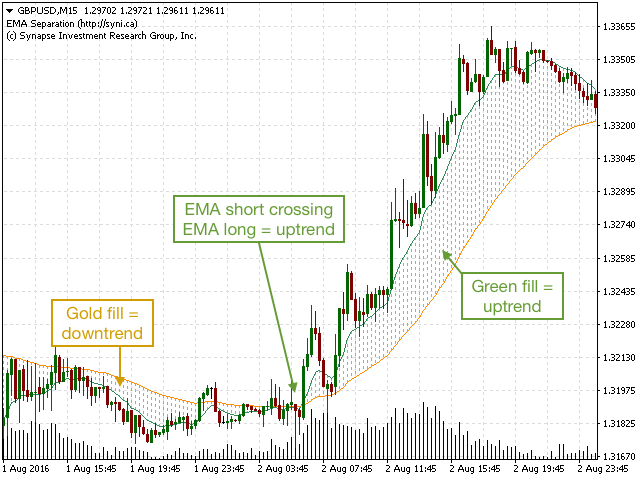
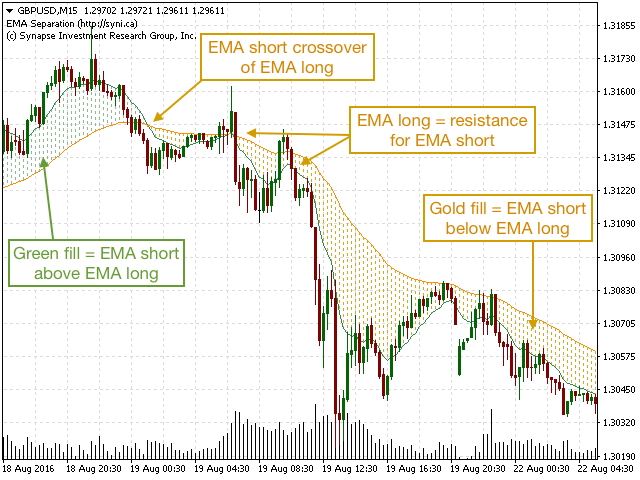
EMA Separation plots 2 exponential moving averages, and a fill between them. The fill is colored differently according to an uptrend (short period EMA above long period EMA), or a downtrend (short period EMA below long period EMA). This is a small tool to help visualize the difference between long and short period averages. We hope you enjoy!

EMA Separation can also be paired with our free EMA Separation Coefficient


Parameters

  • Short period (Default=10): # bars used to calculate short period EMA
  • Long period (Default=50): # bars used to calculate long period EMA
おすすめのプロダクト
This indicator helps you to comfirm SMAs' crossovers by draw a signal line that determines SMA movement direction. when Short SMA cross above Long SMA and Close price is above the signal several bars later, then uptrend is expected. when Short SMA cross below Long SMA and Close price is below the signal several bars later, then downtrend is expected. Input Description :  MA_Period_short: Short-term SMA's period. Used for short-term PriceX. Must be higher than 1.  MA_Period_long: Long-term SMA's
FREE
This indicator is producing accurate signal based on distances between crossection     point of 571 period moving average with 632 period bollinger band and 17 moving average and 171 moving average.     You can also use this signal with expert advisor with below code      double v1= 0 ;     v1= GlobalVariableGet ( Symbol ()+ string ( Period ())+ "HSKPASHAVO1" );      if (v1== 0 )   return ( 0 ); // No Signals      if (v1== 1 )        {        //Send BUY Order...        GlobalVariableSet ( Symbo
The Mono Waves indicator is designed to display the wave behavior of the market on a chart. Its appearance is presented on slide 1.   This indicator uses the PPPC (Point-Percent Price Channel) indicator, which can be downloaded for free from the Market .             When the market moves up, the upper border of the price channel is built on High candlestick prices (for more details, see the description of the PPPC indicator at the link given above). The higher the High prices rise, t
FREE
The indicator provides buy and sell signals on the charts every time ADX DI- and DI+ crosses each other. Blue arrow for uptrend (DI+>DI-). Red arrow for downtrend (DI->DI+). This technical analysis tool can be applied to various trading strategies.  The   ADX Crosses Signals Indicator   is based on the Average Directional Index Metatrader Indicator. The ADX is a lagging indicator, meaning that a trend must already be established before the index can generate its signal. Inputs PERIOD; AlertOn  
FREE
やっと! 1つのチャートに複数の時間枠を示すMT4の確率的インジケーター! 4つの別々の時間枠でメインラインとシグナルラインの実際の位置を即座に確認して、知識に基づいたトレーディングの意思決定を支援します。 インジケーターが複数の時間枠で何を示しているかを視覚的に確認する必要があるトレーダー向けの真のMTF確率的インジケーター。 他の確率論が配置されている場所を確認するために時間枠間をフリックする必要はもうありません!あなたの好きな時間枠に留まり、それらすべての概要を入手してください! 他の確率的インジケーターの上向き矢印または下向き矢印がメインまたは信号線なのか、それとも実際にどのような角度を指しているのか疑問に思わないでください! 伸びたり不正確だったりして貴重なチャートスペースを占有するため、正しく見えないMTF確率論はもうありません。 あなたの取引表からのすべての時間枠でクロスが発生したかどうかを確認してください! 特徴 M1から月次まで、ご希望の期間(合計4つまで)を選択してください 並んで表示されたそれぞれの確率の最新部分を表示します MT4に付属する在庫イン
FREE
[各指標の偏差MT4]は18個の指標の集合であり、そのうちの1つを任意に選択して計算に参加させることができます。それは各指標の偏差形を計算することができアラームを促すことができます。 パラメータ設定の説明 [指標]は、計算に参加する18の指標のうちの1つを選択することです (このパラメーターは非常に重要です) 。 [period]は各指標に共通の周期です。 [方法]はいくつかの指標のMAモードです。 [Apply_to]はいくつかの指標の適用価格です。 [Fast_EMA] [Slow_EMA] [MACD_SMA] [K_period] [D_period] [Slowing]これらはいくつかの指標に必要なパラメータですが、これらのパラメータを必要とする指標はほとんどありません。 [Forward_disparity]は、Kラインから現在のローまたはハイまでの最小距離です。 [Forward_count]は前方検索の最大数です。 [***表示形式***]下向きは矢印と線のサイズと色を設定することです。 [alert_NO_OFF]:これはアラームスイッチで、tr
FREE
TwoMA Crosses indicator displays arrows based on whether the short term moving average crosses above or below the long term moving average. A moving average doesn't predict price direction. Instead, it defines the current direction. Despite this, investors use moving averages to filter out the noise. Traders and investors tend to use the EMA indicator, especially in a highly volatile market because it’s more sensitive to price changes than the SMA. Download for FREE  TwoMA Crosses  EA from the
FREE
Indikator zur klaren Anzeige im Metatrader Dieser Indikator wurde von mir Entwickelt damit die Anzeige der relevanten Parameter klar und deutlich im Chart auf einen Blick zu sehen ist.  Er dient zur Information und ist ohne Gewähr.  Folgende Parameter werden angezeigt: -   Der  Aktuelle Kurs - Das Aktuelle Handelspaar - Die Restzeit zur nächsten Kerzenbildung / Zum Abschluss der Aktuellen Kerze - Die Kontonummer des Handelskontos - Die Frei Verfügbare Margin - Die Margin auf 1 Lot - Der Aktue
FREE
Do you use dynamic ranges (like Bollinger Bands or Envelopes) in your trading? A fixed period is usually used for such calculations. But is such approach relevant to the very nature of the market? In fact, the price chart consists of a series of successive processes - trends and flats. In this case, we can talk about the internal development logic inside a single process only. Therefore, the nature of the market is better described by dynamic ranges designed for the processes occurring "here and
FREE
BPR and SFP Indicator for ICT Trading on MT4 The BPR + SFP Indicator integrates two highly effective trading concepts: Breakout and Retest (BPR) and Swing Failure Pattern (SFP) . This combination enables traders to assess market strength and pinpoint optimal entry opportunities with greater accuracy. By analyzing price action and market reactions at significant levels, this indicator helps identify swing failures, breakouts, confirmations, and retracements. It offers clear visual alerts through
FREE
TurboTrend
Ashkan Hazegh Nikrou
無料でありながら進んだ製品の概要 Turbo Trendは、トレーダーが市場のトレンドを特定し、それに基づいて行動するのを支援する強力なインジケーターです。高度な移動平均とボリューム分析を組み合わせて、トレンドの方向に関する明確なシグナルを提供します。Turbo Trendは、明確な色分けされたラインとローソク足のハイライトを使用して、市場の状況を3つの異なる状態に分類することで、意思決定を簡素化します: 上昇トレンド 、 下降トレンド 、および中立トレンド。 mql5コミュニティで  Koala Trading Solution チャンネル  に参加して、すべてのKoala製品に関する最新情報を確認してください。参加リンクは以下です: https://www.mql5.com/en/channels/koalatradingsolution 他の優れた無料ツールを訪問する:FVGインジケーター:  https://www.mql5.com/en/market/product/108907 Turbo Trend に基づいたEAは現在市場で利用可能です こちらで Turbo Tren
FREE
This indicator allows to hide Ichimoku Kinko Hyo (on all MT4 timeframes) from a date define by the user, with a vertical line (Alone) or a panel (with "Hidden Candles"). Indicator Inputs: Tenkan-sen Kijun-sen  Senkou Span B Information on "Ichimoku Kinko Hyo" indicator is available here:   https://www.metatrader4.com/en/trading-platform/help/analytics/tech_indicators/ichimoku ************************************************************* Hey traders!!  Give me your feeds!  We are a community here
FREE
FxSProMT
Sergiy Podolyak
5 (1)
The FxSProMT indicator shows the current market trend and trend change. Indicator Parameters Ind_Period - the number of previous bars used to calculate actual values. Number_Bars - the number of bars to display the indicator.. Too many bars may significantly slow down the operation of the trading terminal. Signal_Sound - sound alert to notify of trend change. The sound can be played multiple times until the signal is confirmed (the bar closes). Default is disabled. Signal_Alert - an alert to no
FREE
Italo Trend Indicator
Italo Santana Gomes
4.75 (32)
BUY INDICATOR AND GET EA FOR FREE AS A BONUS + SOME OTHER GIFTS! ITALO TREND INDICATOR  is the best trend indicator on the market, the Indicator works on all time-frames and assets, indicator built after 7 years of experience on forex and many other markets. You know many trend indicators around the internet are not complete, does not help, and it's difficult to trade, but the Italo Trend Indicator is different , the Italo Trend Indicator shows the signal to buy or sell, to confirm the signal t
This is a regression tree indicator for MT4/MT5. This indicator classificate nodes on the time period so that the deviation becomes smaller, and displays regression line and channel for each node. It's free! Attached CartDemo.ex4 and CartDemo.ex5 is a Demo version and has the following limitations: Can't use HighSpeed method (default method is RandomForest) Maximum number of bars is 260 (increase from 200) There is no expiration date and can be started many times, but it stops after an hour.
FREE
CISD and Price Gap Openings Indicator MT4 The CISD CSD + Price Gap Openings Indicator is designed to highlight price gaps while marking the CISD level, providing insights into potential market reversals. This MetaTrader 4 tool, based on ICT principles, utilizes arrow markers to assist traders in recognizing fresh price gaps and possible retracement zones.   CISD – CSD + Price Gap Openings Indicator Specifications The following table outlines the features of the CISD – CSD + Price Gap Openings In
FREE
The range indicator means the average daily price movement. For convenience, it is visually displayed on the charts, but with the H4 timeframe and below. The indicator is redrawn daily and the gaps are included in the calculation. An additional dotted line means 80% of the daily movement passed. An important tool in the arsenal of a professional trader or someone who wants to become one. PrimeTools is a series of products designed for correct and professional trading. [ PrimeTools Levels | Prim
FREE
WindFlow HTF is a useful tool suited to use in conjunction together with my WindFlow indicator. This indicator will give you a background vision about the price action trend on a higher timeframe, so when it runs with the WindFlow indicator you have an almost complete trading solution. At this point, you only need some support/resistance analysis and a bit of focus to become a consistent trader. The metaphorical "wind's ballet" Professional traders know that every timeframe is governed by its o
FREE
The Magic EMA indicator is of great help in determining trend direction. It can be an excellent addition to your existing strategy or the basis of a new one. We humans can make better decisions when we see better visually. So we designed it to show a different color for rising and falling trends. Everyone can customize this in the way that suits them best. By setting the Trend Period, we can optimize it for longer or shorter trends for our strategy. It is great for all time frames. IF YOU NEED
FREE
Heikin Ashi Premium
Frederick Langemark
5 (10)
Heikin Ashi is Japanese for "average bar", and may make it easier for you to identify trends. Our version of this popular indicator adjusts the size of the candles based on the zoom level of your chart, making it appear more naturally just like the traditional candlesticks. The colors are selected based on the color scheme you use on your charts, but can be customized anyway you would like. You may also choose whether to display only the Heikin Ashi candles, or show the other selected chart as w
FREE
Dynamic MA Trend Zone – Dynamic Moving Average Trend Zone The Dynamic MA Trend Zone is a visually compelling indicator that dynamically tracks changes in market trends. By displaying moving averages on three different price levels (close, high, and low), it creates a color-coded trend zone that clearly indicates the trend’s direction and strength. Features and Functions: - Trend Direction Color Coding: The indicator automatically color-codes the trend zones based on whether the candle’s clos
FREE
Hello.  Another free indicator from Sepehr! ;) You can determine the trend with this tool. Using crosses of two Moving averages, you can say that the trend is going to be bullish or bearish; A fast-moving average and a slow one. When the fast-moving crosses up the slow-moving, it's going to be an uptrend and when it crosses down the slow-moving, it means that you are going to have a downtrend. That's easy ;) Hope to enjoy it Sepehr(Faran)
FREE
Day Bar Info
Nikolay Frolov
4.68 (31)
The indicator 'draws' a daily, weekly or monthly candlestick on the current chart. Shows in points the sizes of the upper and lower shadows, the body and the entire candlestick. Real time work. Works in the strategy tester. Indicator parameters: How_much_to_show - how many blocks to show. Block_period - block period (day / week / month) Shift - shift from the edge of the chart in bars. language - language selection.
FREE
This indicator prepared by using 1311,2840 days moving average and Calculates the Envelopes.    This system can be used for 15M time frame.     This system is for Long term and profitable.    Signals are shown as arrows. as an optional,    you can set a voice alarm or email notification    You can fins our other products from link : https://www.mql5.com/en/users/drbastem/seller    Also, you can ask all your questins from email : haskayafx@gmail.com or mobile : +90 530 867 5076 or @MehmetBastem
MA MTF Overlay Chart   is software that allows you to overlay the candlestick chart of a financial instrument with a second candlestick chart of the same one, or of another, financial instrument, by setting a different timeframe from that of the basic chart. The software is very simple to use and the input parameters are listed below. Input parameters: Overlay chart set-up Financial instrument :   financial instrument that you want to overlay on the base chart Time period :   secondary instrume
FREE
CYCLE WAVE OSCILLATOR indicator is an indicator based on cyclical price fluctuations. This indicator can help you determine overbought and oversold levels, and help you predict price trends within the cycle. MT5 Version here!  You can combine it with our indicators below to make your trading decisions more accurate: Supply Demand Ribbon MT4 Basic Feature: - Three Trend Types: + Zero + Basic + Advanced
FREE
Индикатор показывает максимальное отклонение от скользящей средней за заданный период. Границы канала могут послужить своего рода зонами перекупленности/перепроданности, от которых может произойти откат цены к центру канала. За этими уровнями и стоит искать дополнительные сигналы для входа в сделку.  В настройках индикатора всего 2 параметра -  период, за который будет расчитываться индикатор и метод усреднения скользящей средней.
FREE
(自動翻訳) ほとんどのトレーダーは、1700 年代に 本間宗久 によって作成された有名な日本の 平均足 指標を知っています。 Heiken-Ashi と 綴られることもありますが、意味は同じで、日本語の「平均的なバー」です。 これは非常によく知られた 平均足 インジケーターの実装ですが、いくつかの機能が追加されています。 1 つは、値が ボリューム (ティックカウント ボリューム 、 実際のボリューム 、または真の範囲に基づく 疑似ボリューム) によって重み付けされることです。主な利点は、特に取引高が少ない期間における誤った反転の数が減少することです。また、高値と安値の尾引きを遅くするのにも役立ちます。 オプションとして、バーの実際の範囲に基づいた 疑似ボリューム の使用が可能になります。これは、実際のボリューム データもティック カウント ボリューム データも利用できないシンボルに役立ちます。 追加機能として、このインジケーターには、ストップに使用できる最大変位のレベルも表示されます。 その計算の基礎を理解しているトレーダーはほとんどいませんが、 平均足 は実際には指数移動平均に基
FREE
RSI-Based Moving Average Indicator for MT4 One of the widely used methods for trading in alignment with market trends is leveraging Moving Average Crossovers. The RSI-Based Moving Average Indicator enhances this strategy by integrating the Relative Strength Index (RSI) as an additional confirmation tool. This indicator generates buy and sell signals by plotting two oscillating lines that move between 0 and 100, helping traders identify potential trade opportunities. «Indicator Installation & Us
FREE
Power Trend Free - the indicator shows the trend strength in the selected period. Input Parameters The indicator has three input parameters: Period - a positive number greater than one, it shows the number of candlesticks used for calculations. If you enter one or zero, there will be no error, but the indicator will not be drawn. Applied Price - the standard "Apply to:" set meaning data used for the indicator calculation: Close - Close prices; Open - Open prices; High - High prices; Low - Low p
FREE
このプロダクトを購入した人は以下も購入しています
Gann Made Easy は、ミスター・ギャンの理論を使用した取引の最良の原則に基づいた、プロフェッショナルで使いやすい外国為替取引システムです。 W・D・ガン。このインジケーターは、ストップロスとテイクプロフィットレベルを含む正確な買いと売りのシグナルを提供します。 PUSH通知を利用して外出先でも取引可能です。 購入後はご連絡ください!私の取引のヒントと素晴らしいボーナスインジケーターを無料で共有します! おそらく、ギャンの取引手法についてはすでに何度も聞いたことがあるでしょう。通常、ギャンの理論は初心者のトレーダーだけでなく、すでにある程度の取引経験がある人にとっても非常に複雑なものです。なぜなら、ギャンの取引手法は理論的にはそれほど簡単に適用できるものではないからです。私はその知識を磨き、最良の原則を私の外国為替インジケーターに組み込むために数年を費やしました。 このインジケーターは非常に簡単に適用できます。必要なのは、それをチャートに添付し、簡単な取引推奨事項に従うだけです。このインジケーターは常に市場分析の仕事を行い、取引の機会を探します。適切なエントリーポイントを検出
Gold Stuff
Vasiliy Strukov
4.86 (255)
Gold Stuff は、金専用に設計されたトレンド指標であり、あらゆる金融商品にも使用できます。 インジケーターは再描画せず、遅れません。 推奨時間枠 H1. それインディケータでフルオートExpert Advisor EA Gold Stuffが動作します。 あなたは私のプロフィールでそれを見つけることができます. 設定と個人的なボーナスを得るために、購入後すぐに私に連絡してください! トレンド スキャナーの強力なサポートを利用して、無料のインジケーターを入手し、プライバシーを守ります。あーみー!   設定 矢印を描く - オンオフ。 チャートに矢印を描く。 アラート - 可聴アラートのオンオフ。 メール通知 - オンオフ。 電子メール通知。 プチ通知 - オンオフ。 プッシュ通知。 次に、色域を調整します。 Gold Stuff は、金専用に設計されたトレンド指標であり、あらゆる金融商品にも使用できます。 インジケーターは再描画せず、遅れません。 推奨時間枠 H1. それインディケータでフルオートExpert Advisor EA Gold Stuffが動作します。
現在20%OFF! 初心者やエキスパートトレーダーのためのベストソリューション! このダッシュボードソフトウェアは、28の通貨ペアで動作しています。それは私達の主要な指標(高度な通貨の強さ28と高度な通貨インパルス)の2に基づいています。それは全体の外国為替市場の大きい概観を与えます。それは、すべての(9)時間枠で28の外国為替ペアのための高度な通貨の強さの値、通貨の動きの速度と信号を示しています。チャート上で1つのインディケータを使用して市場全体を観察し、トレンドやスキャルピングの機会をピンポイントで見つけることができたら、あなたのトレードがどのように改善されるか想像してみてください。 このインディケータには、強い通貨と弱い通貨の識別、潜在的な取引の識別と確認がより簡単になるような機能が搭載されています。このインディケータは、通貨の強さや弱さが増加しているか減少しているか、また、すべての時間枠でどのように機能しているかをグラフィカルに表示します。 新機能として、現在の市場環境の変化に適応するダイナミックなマーケットフィボナッチレベルが追加され、すでに当社のAdvanced
!SPECIAL SALE! An exclusive indicator that utilizes an innovative algorithm to swiftly and accurately determine the market trend. The indicator automatically calculates opening, closing, and profit levels, providing detailed trading statistics. With these features, you can choose the most appropriate trading instrument for the current market conditions. Additionally, you can easily integrate your own arrow indicators into Scalper Inside Pro to quickly evaluate their statistics and profitability
Golden Trend Indicator
Noha Mohamed Fathy Younes Badr
4.9 (10)
Golden Trend indicator  is The best indicator for predicting trend movement this indicator never lags and never repaints and never back paints    and give  arrow buy and sell    before the candle appear  and it will help you and  will make your trading decisions clearer its work on all currencies and  gold and crypto and all time frame This unique  indicator uses very secret algorithms to catch the  trends, so you can trade using this indicator and see the trend clear on charts  manual guide and
市場の2つの基本原則に基づく日中戦略。 このアルゴリズムは、追加のフィルターを使用したボリュームと価格の波の分析に基づいています。インディケータのインテリジェントアルゴリズムは、2つの市場要因が1つに結合した場合にのみシグナルを出します。インディケータは、より高い時間枠のデータを使用して、M1チャート上の特定の範囲の波を計算します。そして波を確認するために、インジケーターはボリュームによる分析を使用します。 このインディケータはレディトレーディングシステムです。トレーダーが必要とするのは、信号に従うことだけです。また、インジケーターはあなた自身の取引システムの基礎になることができます。取引はミニッツチャートでのみ行われます。 インジケーターがMTFの原則を使用しているという事実にもかかわらず、インジケーターのアルゴリズムは可能な限り安定しています。 購入後、必ず私に書いてください!私の取引設定と推奨事項をあなたと共有します!
After your purchase, feel free to contact me for more details on how to receive a bonus indicator called VFI, which pairs perfectly with Easy Breakout for enhanced confluence!   Easy Breakout is a powerful price action trading system built on one of the most popular and widely trusted strategies among traders: the Breakout strategy ! This indicator delivers crystal-clear Buy and Sell signals based on breakouts from key support and resistance zones. Unlike typical breakout indicators, it levera
Scalper Vault は、スキャルピングを成功させるために必要なすべてを提供するプロフェッショナルなスキャルピング システムです。このインジケーターは、外国為替およびバイナリー オプションのトレーダーが使用できる完全な取引システムです。推奨される時間枠は M5 です。 システムは、トレンドの方向に正確な矢印シグナルを提供します。また、トップとボトムのシグナルとギャン マーケット レベルも提供します。 インジケーターは、プッシュ通知を含むすべてのタイプのアラートを提供します。 インジケータの購入後にご連絡ください。私の個人的な取引の推奨事項と素晴らしいボーナス指標を無料で共有します! 幸せで有益な取引をお祈りします!
カスタムMT4インジケーターで外国為替取引を成功させるための秘密を発見してください! 外国為替市場で成功を達成し、リスクを最小限に抑えながら一貫して利益を得る方法を疑問に思ったことはありますか? これがあなたが探している答えです! 取引へのアプローチに革命をもたらす独自のMT4インジケーターを導入できるようにします。 ユニークな汎用性 私たちのインジケータは、RenkoとRangeBarのろうそくのフォーメーションを好むユーザー向けに特別に設計されています。 これらのチャートタイプは多くの経験豊富なトレーダーに好まれていることを理解しています。そのため、私たちのインジケーターはそれらとシームレスに統合され、比類のない市場分析を提供します。 クリアトレンドシグナル 複雑な分析を忘れてください! 私たちのインジケーターは、鮮やかな色と明確なドット構造を利用して、市場の動向を明確に示しています。 赤と青の点は、価格の動きの方向性について疑いの余地がなく、取引の迅速な意思決定を可能にします。 HH/HL HL/LL戦略とのアライメント HH/HLおよびHL/LL構造に基づいた戦略でシー
Enigmera
Ivan Stefanov
5 (7)
ENIGMERA: 市場の中心 重要:MQL5.comのデモはStrategy Testerで実行されており、Enigmeraの機能を完全には反映していない場合があります。詳細については、説明、スクリーンショット、ビデオをご確認ください。質問があれば、遠慮なくメッセージを送ってください! インジケーターのコードは完全に書き直されました。バージョン3.0は新機能を追加し、インジケーターの開始以来蓄積されたバグを修正しました。 紹介 このインジケーターとトレーディングシステムは、金融市場への注目すべきアプローチです。ENIGMERAはフラクタルサイクルを使用して、サポートとレジスタンスのレベルを正確に計算します。真の蓄積フェーズを示し、方向と目標を提供します。トレンドでも修正でも機能するシステムです。 動作方法 インジケーターのほとんどの機能は、チャートの左側にあるボタンで制御され、市場の状況に迅速に対応できるようになっています。 ボタン ON/OFF – インジケーター全体を表示または非表示にします。 Channel – サポートチャネルを有効にし、許容範囲の偏差を示します。 Dev
Linear Trend Predictor ー - エントリ ポイントと方向サポート ラインを組み合わせたトレンド インジケーター。高値/安値チャネルを突破するという原理に基づいて機能します。 インジケーターのアルゴリズムは市場のノイズをフィルタリングし、ボラティリティと市場の動向を考慮します。 インジケーターの機能  平滑化手法を使用して、市場のトレンドと、買い注文または売り注文を開くためのエントリー ポイントを表示します。  任意の時間枠のチャートを分析して、短期および長期の市場の動きを判断するのに適しています。  あらゆる市場や時間枠に適応可能な入力パラメータにより、トレーダーはインジケーターを独自にカスタマイズできます。  設定されたインジケーター信号は消えず、再描画もされません。ローソク足の終値で決定されます。以前にシグナルを受信して​​現在のローソク足で使用することも可能ですが、シグナルが変わる可能性があります。  いくつかの種類の通知が矢印と組み合わされています。  このインジケーターは、独立した取引システムとして使用することも、他の取引システムへの追加として使用
このインディケータは、当社の2つの製品 Advanced Currency IMPULSE with ALERT  +   Currency Strength Exotics . のスーパーコンビネーションです。 このインジケーターは全ての時間枠で作動し、8つの主要通貨と1つのシンボルの強弱のインパルスをグラフで表示します。 このインジケータは、金、エキゾチックペア、商品、インデックス、先物など、あらゆるシンボルの通貨強度の加速度を表示することに特化されています。金、銀、原油、DAX、US30、MXN、TRY、CNHなどの通貨強度の加速度(インパルスまたは速度)を表示するために、任意のシンボルを9行目に追加できる、この種の最初のものです。 新しいアルゴリズムに基づいて構築され、潜在的な取引の特定と確認がさらに容易になりました。これは、通貨の強さや弱さが加速しているかどうかをグラフィカルに表示し、その加速の速度を測定するためです。加速すると物事は明らかに速く進みますが、これはFX市場でも同じです。つまり、反対方向に加速している通貨をペアリングすれば、潜在的に利益を生む取引を特定
Dynamic Forex28 Navigator - 次世代の Forex 取引ツール。 現在 49% オフ。 Dynamic Forex28 Navigator は、長年人気のインジケーターを進化させたもので、3 つの機能を 1 つにまとめています。 Advanced Currency Strength28 インジケーター (レビュー 695 件)  + Advanced Currency IMPULSE with ALERT (レビュー 520 件) + CS28 コンボ シグナル (ボーナス)。 インジケーターの詳細 https://www.mql5.com/en/blogs/post/758844 次世代の Strength インジケーターが提供するもの  オリジナルで気に入っていたすべての機能が、新機能と精度の向上によって強化されました。 主な機能: 独自の通貨強度計算式。 すべての時間枠でスムーズかつ正確な強度ライン。 トレンドの特定と正確なエントリーに最適です。 ダイナミックマーケットフィボナッチレベル (マーケットフィボナッチ)。 このインジケーターに固有
PUMPING STATION – あなた専用の「オールインワン」戦略 PUMPING STATIONは、あなたのトレードをより楽しく、そして効果的に変えてくれる革新的なFXインジケーターです。ただの補助ツールではなく、強力なアルゴリズムを備えた本格的なトレーディングシステムで、より安定したトレードのスタートをサポートします。 この商品をご購入いただくと、以下の特典を無料でお付けします: 専用セットファイル:自動設定による最大パフォーマンスを実現。 ステップバイステップのビデオマニュアル:PUMPING STATION戦略の使い方を学べます。 Pumping Utility:PUMPING STATION専用の半自動トレードボットで、より快適かつシンプルな運用を可能にします。 ※ご購入後すぐにご連絡ください。追加リソースへのアクセスを提供いたします。 PUMPING STATIONの仕組み: トレンド管理:市場のトレンド方向を即座に判断。トレンドはあなたの最高の味方です。 エントリーサイン:チャート上の矢印で、取引のタイミングと方向を明確に示します。 明確な目標設定:インジケーターが自
Trend Screener
STE S.S.COMPANY
4.78 (93)
トレンドインジケーター、1つのツールに組み込まれたすべての重要なトレンド機能を備えたトレンドトレーディングとフィルタリングのための画期的なユニークなソリューション! これは、すべてのシンボル/商品(外国為替、商品、暗号通貨、インデックス、株式)で使用できる100%再描画されていないマルチタイムフレームおよびマルチ通貨インジケーターです。 期間限定オファー: サポートおよびレジスタンス スクリーナー インジケーターは、たった 50 ドルで永久的にご利用いただけます。(元の価格 250 ドル) (オファー延長) トレンドスクリーナーは、チャート内のドットで矢印トレンドシグナルを提供するインジケーターに続く効率的なインジケーターです。 トレンド分析インジケーターで使用できる機能: 1.トレンドスキャナー。 2.最大利益分析を備えたトレンドライン。 3.トレンド通貨強度メーター。 4.アラート付きのトレンド反転ドット。 5.アラート付きの強いトレンドドット。 6.トレンド矢印 毎日の分析例、毎日のシグナルパフォーマンス...など、トレンドスクリーナーインジケーターを使用して、ここで見つけること
- Real price is 80$ - 40% Discount (It is 49$ now) - Lifetime update free Contact me for instruction, add group and any questions! Related Products:  Bitcoin Expert , Gold Expert - Non-repaint - I just sell my products in Elif Kaya profile, any other websites are stolen old versions, So no any new updates or support. Introduction The breakout and retest strategy is traded support and resistance levels. it involves price breaking through a previous level.  The break and retest strategy is design
FX Power: 通貨の強弱を分析して、より賢い取引を実現 概要 FX Power は主要通貨と金の実際の強弱をあらゆる市場状況で理解するための必須ツールです。強い通貨を買い、弱い通貨を売ることで、 FX Power は取引の意思決定を簡素化し、高い確率の取引機会を見出します。トレンドを追従する場合でも、極端なデルタ値を使用して反転を予測する場合でも、このツールはあなたの取引スタイルに完全に適応します。ただ取引するだけではなく、 FX Power で賢く取引をしましょう。 1. なぜ FX Power がトレーダーにとって非常に有益なのか 通貨と金のリアルタイム強弱分析 • FX Power は主要通貨と金の相対的な強弱を計算し、マーケットダイナミクスに関する明確な洞察を提供します。 • どの資産がリードしているか、または後れを取っているかを監視して、取引するペアを賢く選びましょう。 マルチタイムフレームの包括的なビュー • 短期、中期、長期のタイムフレームで通貨と金の強弱を追跡し、マーケットトレンドに基づいて取引戦略を調整できます。 • スキャルピングからスイングトレード
Black dragon indicator
Ramil Minniakhmetov
4.86 (119)
トレンド検出インジケーターはあらゆる戦略を補完し、独立したツールとしても使用できます。 インジケーターの操作に関する推奨事項、コメント #8 でダウンロードできます 利点 使いやすく、不要な情報でチャートを過負荷にしません。 あらゆる戦略のフィルターとして使用できます。 利益を得るのとストップロスを設定するの両方に使用できる動的なサポートとレジスタンスのレベルが組み込まれています。 ローソク足が閉じた後、インジケーターの色は変わりません。  株式市場、指数、石油、金、およびすべての時間枠で機能します。 トースト通知、電子メール通知、プッシュ通知、サウンドアラートの機能があります。 私の他の開発はここで見つけることができます: https://www.mql5.com/ja/users/mechanic/seller 入力パラメータ Alert-オン/オフ。アラート; Push Notification-オン/オフ。プッシュ通知; Mail-オン/オフ電子メール通知; Fibo 1,2,3,4,5,6,7,11,21,31,41,51,61,71-動的サポートと抵抗レベルの設定。
FX Volume
Daniel Stein
4.6 (35)
FX Volume:ブローカー視点で捉える本物の市場センチメント クイック概要 トレード手法をさらに高めたいとお考えですか? FX Volume は、リテールトレーダーやブローカーのポジション状況をリアルタイムで提供します。これは、COTのような遅延レポートよりもはるかに早く知ることができます。安定した利益を目指す方も、さらなる優位性を求める方も、 FX Volume は大きな不均衡を見極め、ブレイクアウトを確認し、リスク管理を洗練させるのに役立ちます。今すぐ始めて、実際の出来高データがどのように意思決定を変革するかを体感してください! 1. FX Volume がトレーダーにとって非常に有益な理由 高精度の早期警戒シグナル • 各通貨ペアを売買しているトレーダー数を、他者よりも早く、ほぼリアルタイムで把握できます。 • FX Volume は、複数のリテールブローカーから得られる本物の出来高データを収集し、分かりやすい形式で提供する 唯一 のツールです。 強力なリスク管理 • ロングやショートの大きな偏り(インバランス)を特定し、潜在的なトレンド転換を見逃しません。ストップ
IX Power: 指数、商品、暗号資産、外国為替市場の洞察を発見 概要 IX Power は、指数、商品、暗号資産、外国為替市場の強弱を分析するための多用途ツールです。 FX Power が全ての利用可能な通貨ペアデータを活用して外為ペアで最高の精度を提供する一方、 IX Power は基礎資産の市場データにのみ焦点を当てています。この特性により、 IX Power は非外為市場に最適であり、単純な外為分析にも信頼性の高いツールです。どのチャートでもスムーズに機能し、取引判断を向上させるための明確で実行可能な洞察を提供します。 1. IX Power がトレーダーにとって価値がある理由 複数市場での強弱分析 • IX Power は指数、商品、暗号資産、外為シンボルの強弱を計算し、それぞれの市場に合わせた洞察を提供します。 • US30、WTI、ゴールド、ビットコイン、または通貨ペアなどの資産を監視して取引機会を発見できます。 幅広い市場に適応 • 外為取引では、 FX Power が関連する全ての通貨ペアを分析することで比類のない精度を提供します。 • IX Power
現在26%オフ 初心者やエキスパートトレーダーに最適なソリューション! このインジケーターは、独自の機能と新しい計算式を取り入れた、ユニークで高品質、かつ手頃な価格のトレーディングツールです。たった1枚のチャートで28の為替ペアの通貨強度を読み取ることができます。新しいトレンドやスキャルピングチャンスの引き金となるポイントを正確に特定することができるので、あなたのトレードがどのように改善されるか想像してみてください。 ユーザーマニュアルはこちら  https://www.mql5.com/en/blogs/post/697384 これが最初の1本、オリジナルだ! 価値のないクローンを買わないでください。 特別な サブウィンドウの矢印で強い通貨の勢いを表示 GAPがあなたのトレードを導く! 基準通貨や気配値が売られすぎ・買われすぎのゾーン(外相フィボナッチレベル)にあるとき、個別チャートのメインウィンドウに警告表示。 通貨がレンジの外側から反落した場合、プルバック/リバーサルのアラート。 クロスパターンの特別なアラート 複数の時間枠を選択可能で、トレンドを素早く確認できます
Chart Patterns All in One」をデモモードでお試しいただき、ボーナスを獲得してください。デモモードで試した後、メッセージを送っていただければボーナスをお渡しします。 購入後にコメントを残すと、高品質なインジケーター8つをボーナスとして受け取れます。 Chart Patterns All-in-One インジケーターは、トレーダーがテクニカル分析で一般的に使用されるさまざまなチャートパターンを視覚化するのに役立ちます。このインジケーターは市場の潜在的な動きを特定するのに役立ちますが、収益性を保証するものではありません。購入前にデモモードでテストすることをお勧めします。 現在のオファー : 「Chart Patterns All in One」インジケーターが50%割引。 含まれるパターン : 1-2-3 パターン : 3つの主要なポイント(高値または安値)を使用して市場の反転を検出します。 買い : 2つの連続する安値の後に、前の高値よりも低い高値が出現。 売り : 2つの連続する高値の後に、前の安値よりも高い安値が出現。 可視化 : 特定されたポイントを線と矢印
Apollo Secret Trend は、任意のペアと時間枠でトレンドを見つけるために使用できるプロのトレンド インジケーターです。インジケーターは、取引するペアや時間枠に関係なく、市場のトレンドを検出するために使用できる主要な取引インジケーターになることができます。インジケーターで特別なパラメーターを使用することにより、シグナルを個人の取引スタイルに適応させることができます。 このインジケーターは、PUSH 通知を含むすべてのタイプのアラートを提供します。インジケータの信号は再描画しないでください!提供されたスクリーンショットでは、アポロ シークレット トレンド インジケーターと買われ過ぎ/売られ過ぎのオシレーター インジケーターを組み合わせて見ることができます。これは完全に無料で提供されます。 購入後、2 番目の買われすぎおよび売られすぎのオシレーター インジケーターを無料で入手するために私に連絡してください!また、システムの使用方法についても説明します。お得な特典もご用意しております!
Cyclical indicator for trading and predicting the direction of the market. Shows the cyclical behavior of the price in the form of an oscillator. Gives signals for opening deals when rebounding from the upper and lower boundaries of the oscillator. In the form of a histogram, it shows the smoothed strength of the trend. Will complement any trading strategy, from scalping to intraday. The indicator does not redraw. Suitable for use on all symbols/instruments. Suitable time frames for short-term t
Advanced Supply Demand
Bernhard Schweigert
4.91 (294)
現在33%オフ 初心者にもエキスパートトレーダーにも最適なソリューション このインジケーターは独自の機能と新しい公式を多数内蔵しており、ユニークで高品質かつ手頃な取引ツールです。このアップデートでは、2つの時間枠ゾーンを表示できるようになります。より長いTFだけでなく、チャートTFとより長いTF(ネストゾーンを表示)の両方を表示できます。すべてのSupply Demandトレーダーの皆さんのお気に召すはずです。:) 重要情報の公開 Advanced Supply Demandの可能性を最大化するには、 https://www.mql5.com/ja/blogs/post/720245 にアクセスしてください。   エントリーまたはターゲットの正確なトリガーポイントを正確に特定できれば取引がどのように改善されるか想像してみてください。新しい基盤となるアルゴリズムに基づいて構築されているため、買い手と売り手の間の潜在的な不均衡をさらに簡単に特定できます。これは、最も強い需要と供給のゾーンと、過去のパフォーマンス(古いゾーンを表示)がグラフィカルに表現されるためです。これらの機能は、最適な
Special offer : ALL TOOLS , just $35 each! New tools   will be   $30   for the   first week   or the   first 3 purchases !  Trading Tools Channel on MQL5 : Join my MQL5 channel to update the latest news from me Volumatic VIDYA (Variable Index Dynamic Average) は、トレンドを追跡し、トレンドの各フェーズ内での買い圧力と売り圧力を分析するために設計された高度なインジケーターです。可変インデックス動的平均 (Variable Index Dynamic Average) をコアの動的平滑化技術として利用することで、このツールは、価格とボリュームのダイナミクスに関する重要な洞察を、市場構造の重要なレベルで提供します。 MT5バージョンを見る:  Volumatic VIDyA MT5 他の製品を見る:   全製品 To use iCus
Gold Buster M1 System - XAUUSDペアのM1チャートのプロの取引システムです。しかし、このシステムはもともと金の取引専用に開発されたという事実にもかかわらず、このシステムは他のいくつかの通貨ペアでも使用できます。購入後、XAUUSDに加えてシステムで使用できるトレーディングペアのリストを提供します。これにより、このシステムを使用する可能性が広がります。 システム内のすべてのインジケーターは繰り返されません! このシステムは、3つのインジケーターのセットです。市場の強さを視覚的に表示するトレンドインジケーター、矢印インジケーター、ボリュームインジケーターです。購入後、すぐにトレンドインジケーターをダウンロードできます。残りの2つのインジケーターはシステム全体の一部であるため、無料で提供します。また、チャートにインジケーターをロードするために使用できるテンプレートを提供します。さらに、私のシステムとの取引方法を教え、私の推奨事項を共有します。あなたを待っている素晴らしいボーナスもあります! 購入後すぐにご連絡ください!
[ MT5 Version ]  [ Kill Zones ]  [ SMT Divergences ] How to trade using Order Blocks:  Click here User Interface Performance:  During testing in the strategy tester, the UI may experience lag. Rest assured, this issue is specific to the testing environment and does not affect the indicator's performance in live trading. Elevate your trading strategy with the  Order Blocks ICT Multi TF  indicator, a cutting-edge tool designed to enhance your trading decisions through advanced order block analys
Gold Venamax   - これは最高の株式テクニカル指標です。 指標アルゴリズムは資産の価格変動を分析し、ボラティリティと潜在的なエントリーゾーンを反映します。 インジケーターの機能: これは、快適で収益性の高い取引のためのマジックとトレンド矢印の 2 つのブロックを備えたスーパー インジケーターです。 チャート上にブロックを切り替えるための赤いボタンが表示されます。 マジックはインジケーター設定で設定されているため、異なるブロックを表示する 2 つのチャートにインジケーターをインストールできます。 Gold Venamax は、異なる矢印バッファー (GV と SD) を備えた 2 つのチャートに配置できます。 これを行うには、設定で異なる Magic を選択する必要があります。たとえば、あるマジック = 999、別のマジック = 666 を選択します。次に、チャート上の赤いボタンで矢印バッファを選択できます。 インジケーター設定の各矢印バッファー (GV および SD) には、快適で収益性の高い取引のための個別の矢印フィルターがあります (UseFiltrGV = tru
ボリューム ブレイク オシレーターは、オシレーターの形で価格変動とボリューム トレンドを一致させるインジケーターです。 私はボリューム分析を戦略に統合したいと思っていましたが、OBV、マネー フロー インデックス、A/D、ボリューム加重 Macd など、ほとんどのボリューム インジケーターにいつもがっかりしていました。 そのため、このインジケーターを自分で作成し、その有用性に満足したので、市場に公開することにしました。 主な機能: ボリュームの増加 (ブレイク) によってサポートされる方向に価格が動くフェーズを強調します。 ボリュームの増加が止まり、市場が縮小するフェーズを強調します。 特に時間枠 (<=15 分) のデイトレードでは、価格もボリュームも動かないため、市場が将来の動きに備えられるフェーズを強調します。 ボリュームの増加によってサポートされていない場合、他のエキスパート アドバイザーからの誤ったシグナルをフィルターします。 トレンドとレンジ フェーズを非常に簡単に視覚化できます 入力パラメーター: 計算設定: 計算タイプ: FAST、NORMAL、SLOW。同じ
作者のその他のプロダクト
WaveTrend Momentum Oscillator is an upgrade to the popular and easy-to-use WaveTrend Oscillator. The WaveTrend Momentum Oscillator adds a momentum component to the original WaveTrend calculation, in order to provide faster and more accurate entry points during trendy market conditions. Do you prefer the original WaveTrend Oscillator? The WaveTrend Momentum Oscillator allows you to switch between momentum and original WT versions. Both provide valuable information depending on the market conditio
"Wouldn't we all love to reliably know when a stock is starting to trend, and when it is in flat territory? An indicator that would somehow tell you to ignore the head fakes and shakeouts, and focus only on the move that counts?" The Choppiness Index is a non-directional indicator designed to determine if the market is choppy (trading sideways) or not choppy (trading within a trend in either direction). It is an oscillating indicator between -50 (very trendy) and +50 (very choppy). There are man
Detect strength for uptrends and downtrends by tracking Buy Power and Sell Power. Stay on the right side of the market by being able to determine whether the market is in a bull or bear trend and how strong the trend is. Free download for a limited time! We hope you enjoy, with our very best wishes during this pandemic! Trend Trigger Factor  aims to ride out sideways movement, while positioning the trader in the correct side of the market to capture big trends when they occur. It was   origin
FREE
Two Period RSI compares long-term and short-term RSI lines, and plots a fill between them for improved visualization. Fill is colored differently according to an uptrend (short period RSI above long period RSI) or a downtrend (short period RSI below long period RSI). Short-term RSI crossing long-term RSI adds a more robust trend confirmation signal than using single period RSI alone. This is a small tool to help visualize and confirm RSI trends. We hope you enjoy! Looking for RSI alerts? You can
FREE
"Capture the sleeping and waking alligator." Detect trend entrance/exit conditions - this indicator can also be tuned according to your trading style. You can adjust a confidence parameter to reduce false positives (but capture less of the trend). This is based on a modification of the Alligator indicator by Bill Williams, an early pioneer of market psychology.  2 main strategies: either the " conservative"  approach to more frequently make profitable trades (at a lower profit), or the " high r
FREE
Whether trading stocks, futures, options, or FX, traders confront the single most important question: to trade trend or range? This tool helps you identify ranges to either trade within, or, wait for breakouts signaling trend onset. Free download for a limited time! We hope you enjoy, with our very best wishes during this pandemic! The issue with identifying ranges is some ranges and patterns are easy to miss, and subject to human error when calculated on the fly. The Automatic Range Identifi
FREE
"The VIX Fix is a powerful indicator that detects market bottoms for any asset " The VIX (volatility index) is a ticker symbol of implied volatility of the S&P 500, calculated by the Chicago Board Options Exchange. VIX is a popular measure of market risk, and is one of the best measures of market bottoms that currently exists. Unfortunately, it only exists for the S&P 500... The VIX Fix was published by Larry Williams in 2007, and it synthesizes a VIX volatility index for any asset (not just the
"The trend is your friend" is one of the best known sayings in investing, because capturing large trendy price movements can be extremely profitable. However, trading with the trend is often easier said than done, because many indicators are based on price reversals not trends. These aren't very effective at identifying trendy periods, or predicting whether trends will continue. We developed the Trendiness Index to help address this problem by indicating the strength and direction of price trend
EMA Separation Coefficient reflects the separation between short-term and long-term exponential moving average trend resistance, as well as the direction of the current movement. Pay attention to potential crossover points when the coefficient approaches zero, this may indicate an upcoming breakout or reversal. Wait for confirmation of the trend before entering the trade, and exit when the coefficient forms a max (for calls) or a min (for puts). This is a small tool to help visualize the differe
FREE
SuperTrend Alerts adds alerts to the widely popular SuperTrend indicator. As the name suggests, SuperTrend is a trending indicator which works best in trendy (not choppy) markets. SuperTrend is extremely popular for intraday and daily trading, and can be used on any timeframe. Place a call when the price closes above the SuperTrend line, and place a put when the price closes below the SuperTrend line. These crossovers are highlighted by non-repainting up/down arrows. Alerts Email, message and s
ATR Volatility plots the ATR-based volatility, and triggers alerts when it crosses user-defined upper and lower thresholds (purple and tan lines, please see screenshots). Circles are painted when ATR volatility crosses either above the upper threshold, or below the lower threshold. This is a small tool custom-built by our group, by specific request of one of our customers. We hope you enjoy! Do you have an indicator you would like to see designed? Feel free to send us a message! Click here for m
FREE
Two Period RSI + Alerts compares long-term and short-term RSI lines, and plots a fill between them for improved visualization. Fill is colored differently according to an uptrend (short period RSI above long period RSI) or a downtrend (short period RSI below long period RSI). Short-term RSI crossing long-term RSI adds a more robust trend confirmation signal than using single period RSI alone. This is a tool to help visualize and confirm RSI trends. We hope you enjoy! Alerts Email, message, and
Catch major price movements, early in the trend. Alerts you to enter at the likely beginning of a trend, and if it's incorrect, quickly alerts you to exit to limit any loss. Designed to capture large, profitable price movements, with early entrance to maximize your returns. As shown in screenshots, typical behavior is  several quick entrance/exists with small loss , and then  capture of a large trend with high profits .  The   Instantaneous Trend  indicator is a lag-reduced method to detect pri
Looking for strong trend entrance and exit points of trends? This incorporates volume into price calculations for a fast entry/exit, showing how supply and demand factors are influencing price, and  giving you more insights than the average trader uses. The   Volume Accumulation Trend   indicator is a cumulative indicator that uses both   volume  and   price  to investigate whether an asset is growing or falling. It identifies differences between the price and the volume flow, which lets us kno
"Wouldn't we all love to reliably know when a stock is starting to trend, and when it is in flat territory? An indicator that would somehow tell you to ignore the head fakes and shakeouts, and focus only on the move that counts?" The Choppiness Index is a non-directional indicator designed to determine if the market is choppy (trading sideways) or not choppy (trading within a trend in either direction). It is an oscillating indicator between -50 (very trendy) and +50 (very choppy). There are man
Automate your charting with the All-In-One SRES channel indicator. This is a complete package designed to address 3 questions: (1) when to enter a trade, (2) what is a good exit point, and (3) what is the probabilistic likelihood of success of the trade. Longevity and Flexibility : The All-In-One SRES calculates and charts S upport, R esistance, E xpected range, and a S queeze channel, and is enormously flexible for many trading strategies. Each option is customizable to fit your strategy, and c
"Battles between bulls and bears continue to influence price development long after the combat has ended, leaving behind a messy field that observant technicians can use to manage risk and find opportunities. Apply "trend mirror" analysis to examine these volatile areas, looking for past action to impact the current trend when price turns and crosses those boundaries." - Investopedia.com RSI Mirrors and Reflections is a robust technique using multiple RSI periods, mirrors and reflections based o
Fano Factor is a measure of the dispersion of the probability distribution of Fano noise, named after Ugo Fano, an Italian-American Physicist. Fans has applications in Particle Detection and Neuroscience for describing variability in complex multivariate data. In trading, we have discovered Fano can be used as a 'signal to noise' ratio, and can indicate the strength of price movements (i.e., price movement is greater than predicted by purely statistical measures). Like standard deviation, Fano F
"The Squeeze indicator attempts to identify periods of consolidation in a market. In general the market is either in a period of quiet consolidation or vertical price discovery. By identifying these calm periods, we have a better opportunity of getting into trades with the potential for larger moves. Once a market enters into a "squeeze," we watch the overall market momentum to help forecast the market direction and await a release of market energy." Modified TTM Squeeze Indicator is a modifica
"The Squeeze indicator attempts to identify periods of consolidation in a market. In general the market is either in a period of quiet consolidation or vertical price discovery. By identifying these calm periods, we have a better opportunity of getting into trades with the potential for larger moves. Once a market enters into a "squeeze," we watch the overall market momentum to help forecast the market direction and await a release of market energy." The StdATR Squeeze Channel combines standard
The Relative Momentum Index (RMI) was developed by Roger Altman, and introduced in his Feb 1993 article in Technical Analysis of Stocks & Commodities magazine. As its name suggests, Relative Momentum Index adds a momentum component to the traditional RSI, designed to increase reliability by decreasing spurious oscillations between defined overbought and oversold levels. This Relative Momentum Index indicator has 2 components. A change in RMI line color provides a warning signal for an upward or
True Choppiness Direction determines if the market is choppy (trading sideways) or if it is trending, as well as the trend direction and strength (green=up, red=down, grey=no trend) . The underlying algorithm is designed to detect trend movements even in the presence of noisy market data, please see screenshots. Trend strength is indicated by taller or shorter red/green fill. Choppiness index is range-bound between -50 (very trendy) and +50 (very choppy). This is a custom algorithm designed by u
The  Laguerre VIX Trend Extrema   (LVTE)  indicator detects market tops and bottoms. As its name suggests, LVTE is a percentage price oscillator that identifies extreme ranges in market price. How to use:   Buy   when the indicator was in the lower "blue" range for more than 2 candles, and then moves up into grey.   Sell   when the indicator was in the upper "red" range, and then moves down into orange. Please see screenshots for examples! To make it simple, the indicator can show this by paint
Laguerre SuperTrend Clouds adds an Adaptive Laguerre averaging algorithm and alerts to the widely popular SuperTrend indicator. As the name suggests, Laguerre SuperTrend Clouds (LSC) is a trending indicator which works best in trendy (not choppy) markets. The SuperTrend is an extremely popular indicator for intraday and daily trading, and can be used on any timeframe. Incorporating Laguerre's equation to this can facilitate more robust trend detection and smoother filters. The LSC uses the impro
Two Period RSI + Alerts compares long-term and short-term RSI lines, and plots a fill between them for improved visualization. Fill is colored differently according to an uptrend (short period RSI above long period RSI) or a downtrend (short period RSI below long period RSI). Short-term RSI crossing long-term RSI adds a more robust trend confirmation signal than using single period RSI alone. This is a tool to help visualize and confirm RSI trends. We hope you enjoy! Alerts Email, message, and
"Battles between bulls and bears continue to influence price development long after the combat has ended, leaving behind a messy field that observant technicians can use to manage risk and find opportunities. Apply "trend mirror" analysis to examine these volatile areas, looking for past action to impact the current trend when price turns and crosses those boundaries." RSI Mirrors and Reflections is a robust technique using multiple RSI periods, mirrors and reflections based on RSI values to ind
"The Squeeze indicator attempts to identify periods of consolidation in a market. In general the market is either in a period of quiet consolidation or vertical price discovery. By identifying these calm periods, we have a better opportunity of getting into trades with the potential for larger moves. Once a market enters into a "squeeze," we watch the overall market momentum to help forecast the market direction and await a release of market energy." The Modified TTM Squeeze Indicator is a modi
Catch major price movements, early in the trend. Alerts you to enter at the likely beginning of a trend, and if it's incorrect, quickly alerts you to exit to limit any loss. Designed to capture large, profitable price movements, with early entrance to maximize your returns. As shown in screenshots, typical behavior is several quick entrance/exists with small loss , and then capture of a large trend with high profits .  The Instantaneous Trend  indicator is a lag-reduced method to detect price t
Laguerre SuperTrend Clouds   adds an Adaptive Laguerre averaging algorithm and alerts to the widely popular SuperTrend indicator. As the name suggests,   Laguerre SuperTrend Clouds (LSC)   is a trending indicator which works best in trendy (not choppy) markets. The SuperTrend is an extremely popular indicator for intraday and daily trading, and can be used on any timeframe. Incorporating Laguerre's equation to this can facilitate more robust trend detection and smoother filters. The LSC uses the
"The VIX Fix is a powerful indicator that detects   market bottoms for any asset " The VIX (volatility index) is a ticker symbol of implied volatility of the S&P 500, calculated by the Chicago Board Options Exchange. VIX is a popular measure of market risk, and is one of the best measures of market bottoms that currently exists. Unfortunately, it only exists for the S&P 500... The VIX   Fix   was published by Larry Williams in 2007, and it synthesizes a VIX volatility index for any asset (not j
フィルタ:
Matthew Todorovski
13128
Matthew Todorovski 2018.06.30 14:32 
 

ユーザーは評価に対して何もコメントを残しませんでした

Tim Eubanks
5763
Tim Eubanks 2018.03.19 08:38 
 

ユーザーは評価に対して何もコメントを残しませんでした

レビューに返信
バージョン 1.2 2021.12.01
Upgraded for new MT4 version compatibility
バージョン 1.1 2017.01.11
V1.1 Improvements:
- Fixed bug in which colors revert to original when changing timeframes