• 概要
  • レビュー (1)
  • コメント

RGI indicator

5
Indicator Overview
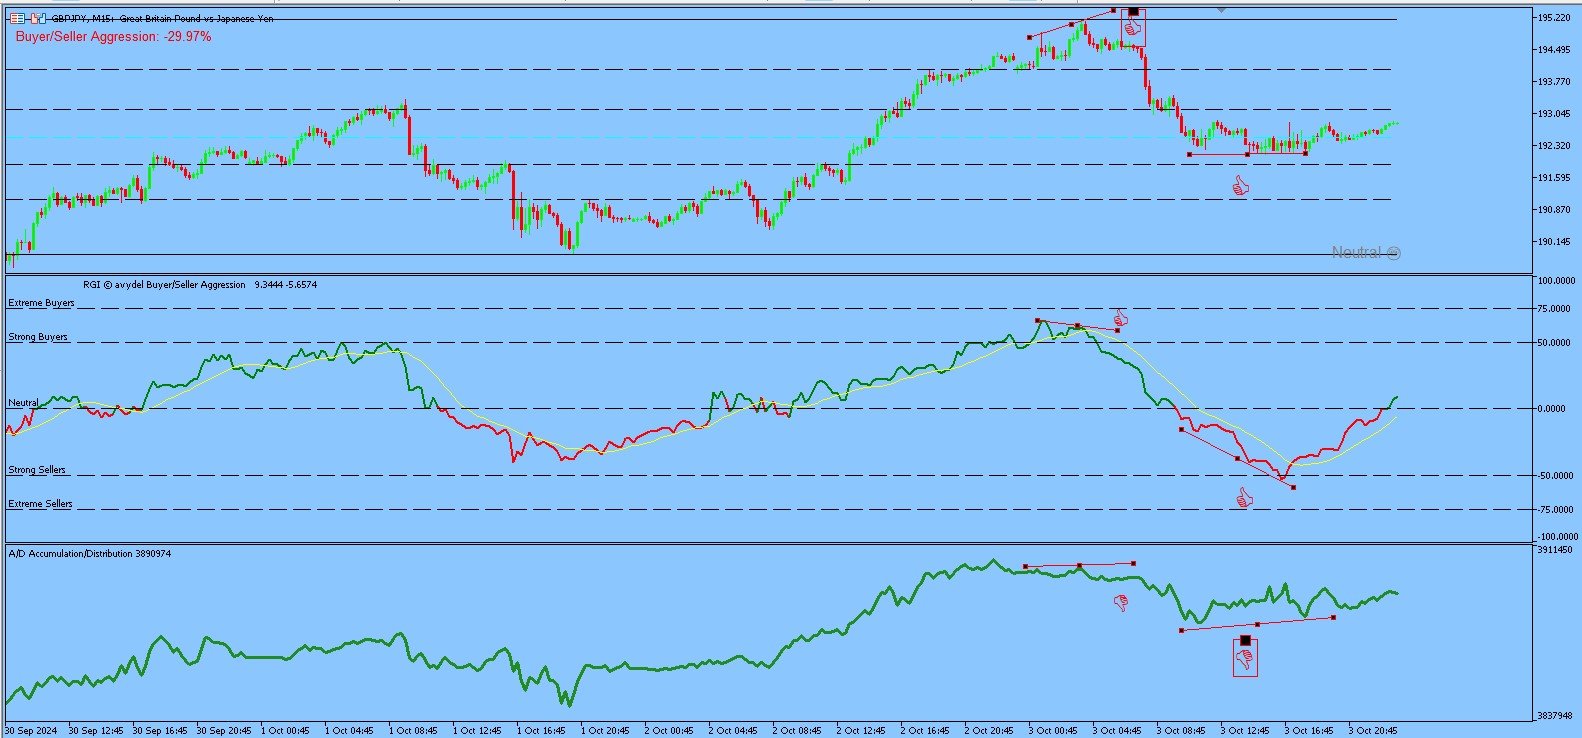
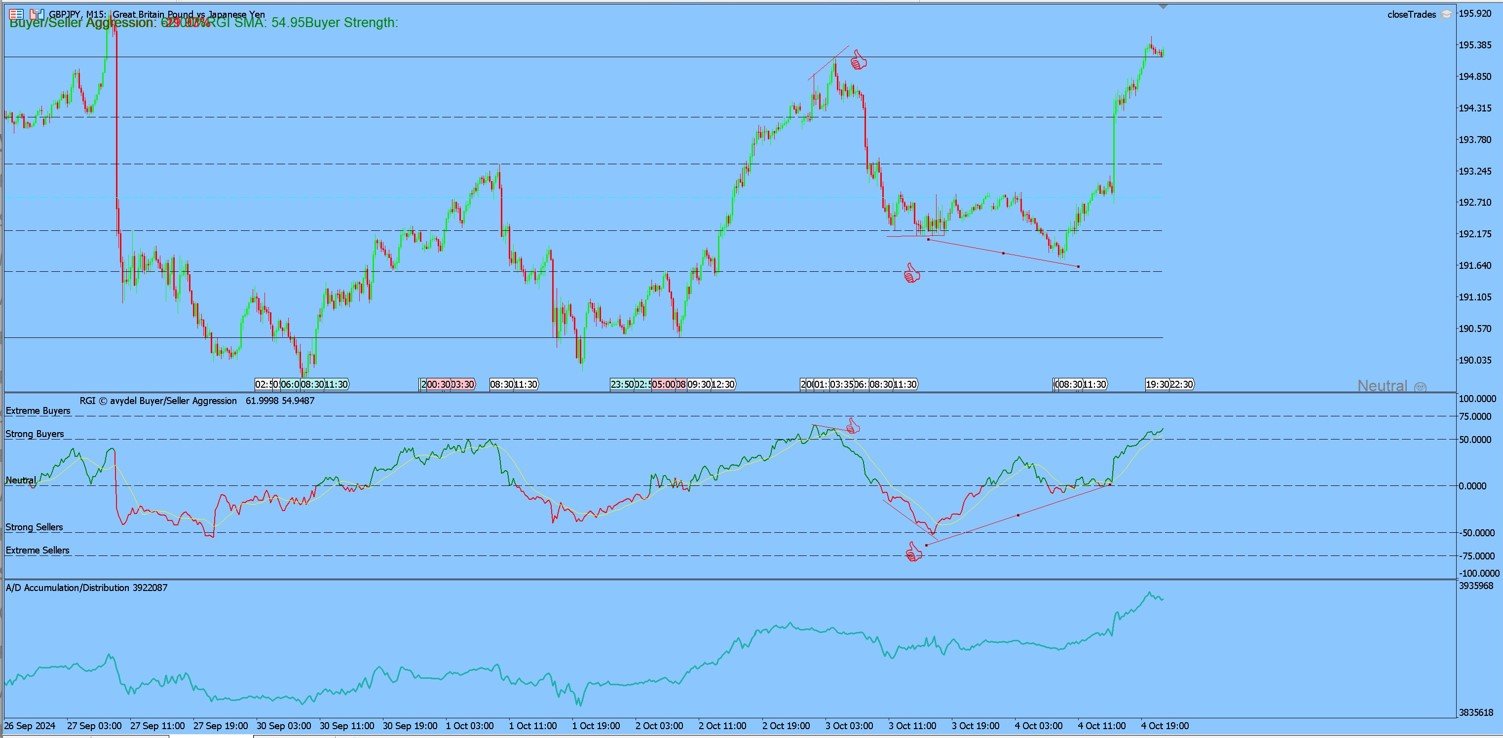
The RGI Buyer/Seller Aggression Indicator is an advanced technical analysis tool designed to measure and visualize the relative strength of buyers and sellers in the market. It plots a line that oscillates between -100 and 100, with positive values indicating buyer dominance and negative values showing seller dominance.Key Components
  1. Strength Calculation: The indicator analyzes candle structures over a specified lookback period (default 50 bars). It examines body size, upper wick, and lower wick to assess buyer and seller strength.
  2. ATR Integration: It incorporates the Average True Range (ATR) to adapt to market volatility, ensuring the indicator's responsiveness across different market conditions.
  3. Dynamic Scaling: The indicator uses a scaling method based on ATR and a user-defined MaxGapPercentage to ensure meaningful readings across different timeframes and instruments.
  4. Color-Coded Visualization: The main line changes color based on whether buyers (green) or sellers (red) are dominant, with a neutral state (gray) when forces are balanced.
  5. RGI SMA: A Simple Moving Average (SMA) of the main indicator line is plotted to smooth out short-term fluctuations and highlight the overall trend.
Distinct from RSI
Unlike the Relative Strength Index (RSI), this indicator:
  • Analyzes entire candle structures, not just closing prices
  • Separately calculates and compares buyer and seller strength
  • Incorporates ATR for dynamic scaling across different market conditions
  • Revealing the invisible tug-of-war between bulls and bears
  • Offers more comprehensive visual cues with color-coded lines and multiple plot types
  • Provides real-time, detailed market insights through a dynamic label
Calculation Method
The core calculation involves:
  1. Summing buyer and seller strength over the lookback period.
  2. Calculating the difference between buyer and seller strength.
  3. Scaling this difference based on ATR and MaxPercentage.
  4. Normalizing the result to fit within the -100 to 100 range.
Unique Features
  • Real-time Information Display: A label provides current indicator values, buyer/seller strengths, ATR, and max strength, updating with each new bar.
  • Customizable Levels: Predefined levels (75, 50, 0, -50, -75) help identify extreme buyer/seller conditions and neutral zones.
  • Flexible Parameters: Users can adjust lookback period, ATR period, max  percentage, and RGI SMA period.
Interpretation
  • Values above 50 suggest strong buyer presence
  • Values below -50 indicate strong seller presence
  • The crossover of the main line with its SMA can signal potential trend changes

Developed by Avydel Talbo, this RGI Buyer/Seller Aggression Indicator represents a significant advancement in technical analysis tools. It offers traders a more nuanced and comprehensive view of market dynamics compared to traditional oscillators, potentially providing earlier and more accurate signals for divergence-based trading strategies.

Important Notice: This powerful indicator is available for free for a limited time only. Traders are encouraged to take advantage of this unique opportunity while it lasts. Don't miss out on the chance to elevate your trading strategy with this cutting-edge tool.


レビュー 1
Agbakeleke Idowu
689
Agbakeleke Idowu 2024.10.04 19:41 
 

Good Indicator. Testing it out... When it crosses up from neutral or down from neutral it is dangerous. It has a good potential. I will advise the creator to invest more features into it.. Like Push notifications when it crosses from neutral to stronger zones. Keep it up. More Grace for making this Gold free

おすすめのプロダクト
The indicator highlights the points that a professional trader sees in ordinary indicators. VisualVol visually displays different volatility indicators on a single scale and a common align. Highlights the excess of volume indicators in color. At the same time, Tick and Real Volume, Actual range, ATR, candle size and return (open-close difference) can be displayed. Thanks to VisualVol, you will see the market periods and the right time for different trading operations. This version is intended f
FREE
Follow The Line MT5
Oliver Gideon Amofa Appiah
4.52 (29)
This indicator obeys the popular maxim that: "THE TREND IS YOUR FRIEND" It paints a GREEN line for BUY and also paints a RED line for SELL. (you can change the colors). It gives alarms and alerts of all kinds. IT DOES NOT REPAINT and can be used for all currency pairs and timeframes. Yes, as easy and simple as that. Even a newbie can use it to make great and reliable trades. NB: For best results, get my other premium indicators for more powerful and reliable signals. Get them here: https://www.m
FREE
High Low Open Close
Alexandre Borela
4.98 (43)
このプロジェクトが好きなら、5つ星レビューを残してください。 このインジケータは、指定されたためのオープン、ハイ、ロー、クローズ価格を描画します 特定のタイムゾーンの期間と調整が可能です。 これらは、多くの機関や専門家によって見られた重要なレベルです トレーダーは、彼らがより多くのかもしれない場所を知るために有用であり、 アクティブ。 利用可能な期間は次のとおりです。 前の日。 前週。 前の月。 前の四半期。 前年。 または: 現在の日。 現在の週。 現在の月。 現在の四半期。 現年。
FREE
Donchian Channel is an indicator created by Richard Donchian. It is formed by taking the highest high and the lowest low of the last specified period in candles. The area between high and low is the channel for the chosen period. Its configuration is simple. It is possible to have the average between the upper and lower lines, plus you have alerts when price hits one side. If you have any questions or find any bugs, please contact me. Enjoy!
FREE
Value Chart Candlesticks
Flavio Javier Jarabeck
4.73 (11)
The idea of a Value Chart indicator was presented in the very good book I read back in 2020 , " Dynamic Trading Indicators: Winning with Value Charts and Price Action Profile ", from the authors Mark Helweg and David Stendahl. The idea is simple and the result is pure genius: Present candlestick Price analysis in a detrended way! HOW TO READ THIS INDICATOR Look for Overbought and Oversold levels. Of course, you will need to test the settings a lot to find the "correct" one for your approach. It
FREE
無限からの通貨の強さを測定するためのこの革新的な指標は、長い間取引されているダフ屋やトレーダーにとって不可欠な助手です。 通貨の強さ/弱さを分析するためのシステムは、世界の主要なトレーダーによって市場で長い間知られており、使用されてきました。 任意の裁定取引は、この分析なしでは完全ではありません。 私たちの指標は、互いに関連して基本通貨の強さを簡単に決定します。 これは、インスタント分析を可能にし、最強のエントリポイントを検索し、すべてまたは現在の通貨ペアの折れ線グラフが表示されます。 インジケータは直感的で、すぐに見つけて任意のペアに切り替えることができ、地下室とメインチャートの両方に配置できるモバイルパネルがあります。 通貨の強さの変化の通知のタイマーモードは、トレーダーに電話で通知を受け取る機会を与えます。  通貨パワーメーターインフィニティ指標を使用するためのいくつかの戦略: 1. 通貨の強さの線形表示のチャートを使用して、交差点を新興トレンドの信号として検索します 2. トレンド反転信号が表示された後、強い通貨の方向に頭皮 3. 通貨の強さの発散分析を使用して、現在の
FREE
Free automatic Fibonacci is an indicator that automatically plots a Fibonacci retracement based on the number of bars you select on the BarsToScan setting in the indicator. The Fibonacci is automatically updated in real time as new highest and lowest values appears amongst the selected bars. You can select which level values to be displayed in the indicator settings. You can also select the color of the levels thus enabling the trader to be able to attach the indicator several times with differe
FREE
The one minute chart has a bug, but the one-day chart can still be used after deleting the bug and reloading the indicators, This indicator can be used to determine how far the indicator goes up to place an order to buy, how far it goes down to place an order to sell, and not placing an order until it reaches this distance, which is considered oscillation, open an account gift index
FREE
The indicator is based on Robert Miner's methodology described in his book "High probability trading strategies" and displays signals along with momentum of 2 timeframes. A Stochastic oscillator is used as a momentum indicator. The settings speak for themselves period_1 is the current timeframe, 'current' period_2 is indicated - the senior timeframe is 4 or 5 times larger than the current one. For example, if the current one is 5 minutes, then the older one will be 20 minutes The rest of the s
FREE
Are you tired of drawing trendlines every time you're analyzing charts? Or perhaps you would like more consistency in your technical analysis. Then this is for you. This indicator will draw trend lines automatically when dropped on a chart. How it works Works similar to standard deviation channel found on mt4 and mt5. It has 2 parameters: 1. Starting Bar 2. Number of bars for calculation The   starting bar   is the bar which drawing of the trend lines will begin, while the   number of bars for c
FREE
Spike Catch Pro 22:03 release updates Advanced engine for searching trade entries in all Boom and Crash pairs (300,500 and 1000) Programmed strategies improvements Mx_Spikes (to combine Mxd,Mxc and Mxe), Tx_Spikes,   RegularSpikes,   Litho_System,   Dx_System,   Md_System,   MaCross,   Omx_Entry(OP),  Atx1_Spikes(OP),   Oxc_Retracement (AT),M_PullBack(AT) we have added an arrow on strategy identification, this will help also in the visual manual backtesting of the included strategies and see ho
FREE
Dual RSI
Paul Conrad Carlson
3 (1)
Indicator alerts for Dual Relative strength index rsi. Large rsi preset at 14 is below 30 small rsi preset at 4 is below 10 for buy bullish signals . Large rsi preset are 14 is above 70 small rsi preset at 4 is above 90 for sell bearish signals . Includes mobile and terminal alerts. draws lines when alerts. This indicator can help identify extremes and then the tops or bottoms of those extremes .
FREE
Simple Vwap with the daily, weekly and monthly VWAP is the abbreviation for   volume-weighted average price , which is a technical analysis tool that shows the ratio of an asset's price to its total trade volume. It provides traders and investors with a measure of the average price at which a stock is traded over a given period of time. How it's used Identify entry and exit points:   Traders can use VWAP to determine when to buy or sell an asset.   Understand price trends :  Traders can use V
FREE
Tabajara V5
Flavio Javier Jarabeck
4.82 (34)
Metatrader 5 version of the famous Andre Machado's Tabajara indicator. If you don't know Andre Machado's Technical Analysis work you don't need this indicator... For those who need it and for those several friend traders who asked this porting from other platforms, here it is... FEATURES 8-period Moving Average 20-period Moving Average 50-period Moving Average 200-period Moving Average Colored candles according to the inflexion of the 20-period MA SETTINGS You can change the Period of all MA's
FREE
MACD Colored ZeroLag
Farzin Sadeghi Bonjar
4.5 (6)
It is the MQL5 version of zero lag MACD that was available for MT4 here: https://www.mql5.com/en/code/9993 Also there was a colored version of it here but it had some problems: https://www.mql5.com/en/code/8703 I fixed the MT4 version which has 95 lines of code. It took me 5 days to write the MT5 version.(reading the logs and testing multiple times and finding out the difference of MT5 and MT4!) My first MQL5 version of this indicator had 400 lines of code but I optimized my own code again and n
FREE
トレンドキャッチャー: アラートインジケーター付きのトレンドキャッチャーストラテジーは、市場トレンドやポテンシャルなエントリーポイントやエグジットポイントを特定するのに役立つ多目的な技術分析ツールです。動的なトレンドキャッチャーストラテジーを備えており、市場状況に適応してトレンドの方向を明確に視覚化します。トレーダーは、自身の好みやリスク許容度に合わせてパラメーターをカスタマイズできます。このインジケーターはトレンドの識別を支援し、ポテンシャルなリバーサルをシグナルし、トレイリングストップのメカニズムとして機能し、市場への迅速な対応のためのリアルタイムアラートを提供します。 特徴: - トレンドの識別:上昇トレンドと下降トレンドをシグナルします。 - トレンドのリバーサル:ローソク足の色が上昇から下降に変わった場合やその逆の場合に、ポテンシャルなリバーサルを警告します。 - リアルタイムアラート:新しいトレンドの識別に対するアラートを生成します。 推奨事項: - 通貨ペア:EURUSD、AUDUSD、XAUUSDなど... - タイムフレーム:H1。 - アカウントタイプ:
FREE
Combining the best of Price Action , Directional Movement , and Divergence/Convergence analysis, Candle Color Trend is a easy and reliable way to identify trend direction. The indicator automatically paints the candles according to the assumption that an uptrend is defined by prices that form a series of higher highs and higher lows. In contrast, a downtrend is defined by prices that form a series of lower highs and lower lows. Additionally, ADX Wilder indicator is used to measure trend weakness
FREE
この情報インジケーターは、アカウントの現在の状況を常に把握したい人にとって役立ちます。 -   より便利なインジケーター このインジケーターには、ポイント、パーセンテージ、通貨での利益、現在のペアのスプレッド、現在の時間枠でバーが閉じるまでの時間などのデータが表示されます。 チャート上に情報線を配置するには、いくつかのオプションがあります。 価格の右側 (価格の後ろにあります)。 コメントとして (グラフの左上隅に); 画面の選択した隅。 情報区切り記号を選択することもできます。 | / \ # このインジケーターは使いやすく、非常に有益です。設定で不要な情報項目を無効にすることも可能です。 設定 外観の種類     - 情報行の表示タイプ。次の 3 つのオプションがあります。 価格に従ってください     - 価格に従う。 コメントとして     - コメントとして; 画面の選択した隅に     - 画面の選択した隅にあります。 添付用グラフコーナー     - 表示タイプを選択した場合 画面の選択されたコーナーでは、この項目を使用して 4 つのスナップ コーナーの 1 つを選択
FREE
Mini One for All Trend Scanner is a trend following multi-symbol indicator that can be used with any input: forex, stocks, commodities,... The panel shows   three indicators and six symbols with the trend for every pair (symbol/indicator): up, down or no trend. The indicators are: Average Directional Movement Index (ADX) Moving Average Convergence Divergence (MACD) Relative Strength Index (RSI) You can change quickly the chart by clicking any one of the symbol button in the panel. This feature
FREE
The fact that round number levels have a significant influence on the market cannot be denied and should not be overlooked. These psychological levels are used by both retail Forex traders and major banks that deal in Forex.  Very simple and effective indicator and most importantly free. ////////////////////////////////////////////////////////////////////////////////////////////////////////////////////////////////////////////////////////////// The program does not work in the strategy tester.
FREE
Weis Waves
Flavio Javier Jarabeck
2.83 (18)
The original author is David Weis, an expert in the Wyckoff Method. The Weis Wave is a modern adaptation of the 1930's Wyckoff Method, another expert in Tape Reading techniques and Chart Analysis. Weis Waves takes market volume and stacks it into waves according to price conditions giving the trader valuable insights about the market conditions. If you want to learn more about this subject you can find tons of videos in YouTube. Just look for "The Wickoff Method", "Weis Wave" and "Volume Spread
FREE
This indicator is a zero-lag indicator and displays  strength of trend change . True Trend  Oscillator Pro works best in combination with True Trend Moving Average Pro that displays exact trend as is. Oscillator value is exact price change in given direction of the trend. True Trend Moving Average Pro: https://www.mql5.com/en/market/product/103586 If you set PERIOD input parameter to 1 this indicator becomes a sharpshooter for binary options. Developers can use True Trend Oscillator in Exper
FREE
Donchian Channel DC is the indicator of Donchian Channels, that plots maximum and minimum values of a specific period, besides mean value line. It´s possible to configure simple period for analysis and the indicator will plot all three values. You can trade with this indicator as trend or reversal, according to each strategy. Do not let to test others indicators as soon as others expert advisors.
Indicador Regressão Linear – Par de Ativos - INTRADAY Indicador é um oscilador que faz o plot do Resíduo resultado da regressão linear entre os dois ativos inseridos como input do indicador, representado pela fórmula: Y = aX + b + R Onde Y é o valor do ativo dependente, X é o valor do ativo independente, a é a inclinação da reta entre os dois ativos, b é a intersecção da reta e R é o resíduo. O resíduo representa a quantidade da variabilidade que Y que o modelo ajustado não consegue explicar. E
FREE
Supports And Resistances Lines
Francisco Gomes Da Silva
4.76 (37)
サポートゾーンとレジスタンスゾーンのインジケーターMT5 このインジケーターは、トップとボトムを自動的に識別する方法を知っています。 このサポートとレジスタンスインジケーターは、トップとボトムに基づいてサポートラインとレジスタンスラインを作成します。 サポートラインとレジスタンスラインの作り方。 これは、自動サポートラインとレジスタンスラインを作成するためのインジケーターです。 インジケーターを使用してサポートレベルを見つける方法。 このインジケーターはトップとボトムを自動的に検出します。 インジケーターは、「ZigZag」が自動的に底を作成するか、新しい底を前の底より低くするたびにサポートラインを自動的に作成するため、インジケーターは画面に自動サポートラインを自動的に描画します。 レジスタンスラインの作成方法。 インジケーターは、「ZigZag」が新しいトップまたは前のトップよりも高いトップを作成するたびに、サポートレベルを作成するのと同じ方法で抵抗線を自動的に作成します。したがって、インジケーターは新しい抵抗を自動的に作成します。トップレベルとボトムレベルがどこにあるかを心配する必
FREE
Bollinger Bands B
Flavio Javier Jarabeck
4.5 (2)
John Bollinger created this indicator in 2010 as a way to read the original indicator (Bollinger Bands) in a more "technical" way, shown as an oscillator. The typical range of the Bollinger Bands %B is 0 - 0.5 - 1.0, where "0" represents the lower band, the "0.5" the middle band, and "1" the upper band. The line on the indicator represents the Closing prices. As simple as that. SETTINGS Bollinger Bands period of analysis Standard Deviation multiplier Shift Price type to be analyzed If you like
FREE
インジケーター   "Haven Key Levels PDH PDL"   は、トレーダーがチャート上の重要なレベルを視覚化するのを支援します。次のレベルを自動的にマークします: DO (Daily Open)   — 日の開始レベル。 NYM (New York Midnight)   — ニューヨークの真夜中レベル。 PDH (Previous Day High)   — 前日の最高値。 PDL (Previous Day Low)   — 前日の最安値。 WO (Weekly Open)   — 週の開始レベル。 MO (Monthly Open)   — 月の開始レベル。 PWH (Previous Week High)   — 前週の最高値。 PWL (Previous Week Low)   — 前週の最安値。 その他の製品 ->  ここ ツールのカスタマイズオプション: 色とラインの太さの選択: レベルの色設定:   NYM, DO, WO, MO, PDH, PDL, PWH, PWL. ラインの太さの調整。 レベルの表示制御: レベルのライン表示のオン/オフ:
FREE
Super Trend Alert Indicator for MT5 is a powerful tool designed to help traders identify and follow market trends with precision. This indicator uses a proprietary algorithm to analyze price movements and provide clear trend signals, making it suitable for traders across all experience levels. You can find the MT4 version here Key features of the Super Trend Indicator include: Advanced trend analysis with real-time market scanning to detect potential trend directions. Real-time alerts that not
FREE
供給と需要のオーダーブロック: 「供給と需要のオーダーブロック」インジケーターは、外国為替のテクニカル分析において重要なスマートマネーの概念に基づいた洗練されたツールです。このツールは供給と需要ゾーンを特定し、機関投資家が重要な足跡を残す重要な領域に焦点を当てています。売り注文を示す供給ゾーンと買い注文を示す需要ゾーンは、トレーダーが価格の逆転や減速を予測するのに役立ちます。このインジケーターは、ブレイクアウト・オブ・ストラクチャー(BoS)およびフェアバリューギャップ(FVG)のコンポーネントを組み合わせた賢明なアルゴリズムを採用しています。BoSは市場の混乱を検出し、潜在的なオーダーブロックを特定し、FVGは精度を向上させるためにフェアバリューギャップを考慮しています。このツールはこれらの条件の視覚的表現を提供し、潜在的なオーダーブロックを強調し、市場のダイナミクスや転換点に関する洞察を提供することで、トレーダーの意思決定を支援します。使いやすいデザインは、さまざまな技術的な専門知識レベルのトレーダーにアクセスしやすく、高度な分析の包括的なソリューションを提供します。 特徴:
FREE
SUPERTREND; It is a trend following indicator based on the SuperTrend ATR created by Olivier Seban. It can be used to detect changes in trend direction and locate stops. When the price falls below the indicator curve, it turns red and indicates a downtrend. Conversely, when the price moves above the curve, the indicator turns green, indicating an uptrend. Like other indicators, it works well on SuperTrend when used in conjunction with other indicators such as MACD, parabolik SAR, Bollinger Band
FREE
このプロダクトを購入した人は以下も購入しています
トレンド スクリーナー インジケーターでトレンド取引の力を解き放ちます。ファジー ロジックと複数通貨システムを活用した究極のトレンド取引ソリューションです。 ファジー ロジックを活用した革新的なトレンド インジケーターである Trend Screener を使用して、トレンド取引を向上させます。 これは、13 を超えるプレミアム ツールと機能、および 3 つの取引戦略を組み合わせた強力なトレンド追跡インジケーターであり、Metatrader をトレンド アナライザーにする多用途の選択肢となります。 期間限定オファー : トレンド スクリーナー インジケーターは、わずか 100 ドルで生涯ご利用いただけます。 (元の価格 50$ ) (オファー延長) Trend Screener の 100% 非再描画精度の揺るぎない精度を体験して、取引の決定が過去の価格変動の影響を受けないようにしてください。 マルチタイムフレームおよびマルチ通貨機能の多用途性を解放し、比類のない自信を持って外国為替、商品、暗号通貨、インデックスの世界を取引できるようにします。 Trend Screener の包括的な
Описание индикатора MONEY Индикатор MONEY предназначен для анализа волатильности и выявления значительных рыночных движений (всплесков). Он использует ATR (Average True Range) для определения момента, когда цена выходит за пределы обычного диапазона, и сигнализирует об этом трейдеру с помощью стрелок на графике. Основные параметры: • Минимальное количество свечей – задает период для анализа всплесков. • Алерты (уведомления) – включение или отключение звуковых и текстовых сигналов. • Период AT
Golden Trend Indicator MT5
Noha Mohamed Fathy Younes Badr
4.88 (17)
Golden Trend indicator  is The best indicator for predicting trend movement this indicator never lags and never repaints and never back paints    and give  arrow buy and sell    before the candle appear  and it will help you and  will make your trading decisions clearer its work on all currencies and  gold and crypto and all time frame This unique  indicator uses very secret algorithms to catch the  trends, so you can trade using this indicator and see the trend clear on charts  manual guide and
PUMPING STATION – あなた専用の「オールインワン」戦略 PUMPING STATIONは、あなたのトレードをより楽しく、そして効果的に変えてくれる革新的なFXインジケーターです。ただの補助ツールではなく、強力なアルゴリズムを備えた本格的なトレーディングシステムで、より安定したトレードのスタートをサポートします。 この商品をご購入いただくと、以下の特典を無料でお付けします: 専用セットファイル:自動設定による最大パフォーマンスを実現。 ステップバイステップのビデオマニュアル:PUMPING STATION戦略の使い方を学べます。 Pumping Utility:PUMPING STATION専用の半自動トレードボットで、より快適かつシンプルな運用を可能にします。 ※ご購入後すぐにご連絡ください。追加リソースへのアクセスを提供いたします。 PUMPING STATIONの仕組み: トレンド管理:市場のトレンド方向を即座に判断。トレンドはあなたの最高の味方です。 エントリーサイン:チャート上の矢印で、取引のタイミングと方向を明確に示します。 明確な目標設定:インジケーターが自
FX Power: 通貨の強弱を分析して、より賢い取引を実現 概要 FX Power は主要通貨と金の実際の強弱をあらゆる市場状況で理解するための必須ツールです。強い通貨を買い、弱い通貨を売ることで、 FX Power は取引の意思決定を簡素化し、高い確率の取引機会を見出します。トレンドを追従する場合でも、極端なデルタ値を使用して反転を予測する場合でも、このツールはあなたの取引スタイルに完全に適応します。ただ取引するだけではなく、 FX Power で賢く取引をしましょう。 1. なぜ FX Power がトレーダーにとって非常に有益なのか 通貨と金のリアルタイム強弱分析 • FX Power は主要通貨と金の相対的な強弱を計算し、マーケットダイナミクスに関する明確な洞察を提供します。 • どの資産がリードしているか、または後れを取っているかを監視して、取引するペアを賢く選びましょう。 マルチタイムフレームの包括的なビュー • 短期、中期、長期のタイムフレームで通貨と金の強弱を追跡し、マーケットトレンドに基づいて取引戦略を調整できます。 • スキャルピングからスイングトレード
優れたテクニカルインジケーター「Grabber」をご紹介します。これは、すぐに使える「オールインワン」トレーディング戦略として機能します。 ひとつのコードに、市場のテクニカル分析ツール、取引シグナル(矢印)、アラート機能、プッシュ通知が強力に統合されています。 このインジケーターを購入された方には、以下の特典を無料で提供します: Grabberユーティリティ:オープンポジションを自動で管理するツール ステップバイステップのビデオマニュアル:インジケーターのインストール、設定、取引方法を解説 カスタムセットファイル:インジケーターをすばやく自動設定し、最大限の成果を出すための設定ファイル 他の戦略はもう忘れてください!Grabberだけが、あなたを新たなトレードの高みへと導いてくれるのです。 Grabber戦略の主な特徴: 推奨タイムフレーム:M5〜H4 対応通貨ペア・資産:どれでも使用可能ですが、私が実際に検証した以下を推奨します(GBPUSD、GBPCAD、GBPCHF、AUDCAD、AUDUSD、AUDSGD、AUDCHF、NZDUSD、NZDCAD、EURCAD、EURUSD、E
サポートとレジスタンススクリーナーは、1つのインジケーター内に複数のツールを提供するMetaTraderの1つのレベルインジケーターにあります。 利用可能なツールは次のとおりです。 1.市場構造スクリーナー。 2.強気のプルバックゾーン。 3.弱気プルバックゾーン。 4.デイリーピボットポイント 5.毎週のピボットポイント 6.毎月のピボットポイント 7.ハーモニックパターンとボリュームに基づく強力なサポートとレジスタンス。 8.銀行レベルのゾーン。 期間限定オファー:HVサポートおよびレジスタンスインジケーターは、50ドルと生涯でのみご利用いただけます。 (元の価格125 $) MQL5ブログにアクセスすると、分析例を含むすべてのプレミアム指標を見つけることができます。 ここをクリックしてください。 主な機能 ハーモニックおよびボリュームアルゴリズムに基づく強力なサポートおよびレジスタンスゾーン。 ハーモニックおよびボリュームアルゴリズムに基づく強気および弱気のプルバックゾーン。  市場構造スクリーナー 毎日、毎週、毎月のピボットポイント。 ドキュメント すべてのサポートおよび
FX Volume MT5
Daniel Stein
4.82 (17)
FX Volume:ブローカー視点で捉える本物の市場センチメント クイック概要 トレード手法をさらに高めたいとお考えですか? FX Volume は、リテールトレーダーやブローカーのポジション状況をリアルタイムで提供します。これは、COTのような遅延レポートよりもはるかに早く知ることができます。安定した利益を目指す方も、さらなる優位性を求める方も、 FX Volume は大きな不均衡を見極め、ブレイクアウトを確認し、リスク管理を洗練させるのに役立ちます。今すぐ始めて、実際の出来高データがどのように意思決定を変革するかを体感してください! 1. FX Volume がトレーダーにとって非常に有益な理由 高精度の早期警戒シグナル • 各通貨ペアを売買しているトレーダー数を、他者よりも早く、ほぼリアルタイムで把握できます。 • FX Volume は、複数のリテールブローカーから得られる本物の出来高データを収集し、分かりやすい形式で提供する 唯一 のツールです。 強力なリスク管理 • ロングやショートの大きな偏り(インバランス)を特定し、潜在的なトレンド転換を見逃しません。ストップ
FX Levels: あらゆる市場における非常に高精度なサポート&レジスタンス 概要 通貨ペア、株式指数、個別銘柄やコモディティなど、どのような市場でも信頼できるサポートとレジスタンスを特定したいですか? FX Levels は伝統的な “Lighthouse” メソッドと先進的な動的アプローチを融合し、ほぼ汎用的な精度を実現します。ブローカーの実務経験を活かし、自動化されたデイリー更新とリアルタイム更新を組み合わせることで、 FX Levels は反転ポイントを見つけ、利益目標を設定し、自信をもってトレードを管理するための手助けをします。今すぐ試してみて、サポート/レジスタンス分析の正確性がどれほどトレードを向上させるかを実感してください! 1. FX Levels がトレーダーにとって非常に有用な理由 非常に正確なサポート&レジスタンスゾーン • FX Levels は異なるブローカー環境でもほぼ同一のゾーンを生成するよう設計されており、データフィードの差異や時刻設定のずれによる不一致を解消します。 • つまり、どのブローカーを利用していても一貫したレベルが得られるため、戦
Gold Stuff mt5
Vasiliy Strukov
4.93 (178)
Gold Stuff mt5 は、金専用に設計されたトレンド指標であり、あらゆる金融商品にも使用できます。 インジケーターは再描画せず、遅れません。 推奨時間枠 H1. 設定と個人的なボーナスを得るために、購入後すぐに私に連絡してください!  トレンド スキャナーの強力なサポートを利用して、無料のインジケーターを入手し、プライバシーを守ります。あーみー!   設定 矢印を描く - オンオフ。 チャートに矢印を描く。 アラート - 可聴アラートのオンオフ。 メール通知 - オンオフ。 電子メール通知。 プチ通知 - オンオフ。 プッシュ通知。 次に、色域を調整します。 Gold Stuff mt5 は、金専用に設計されたトレンド指標であり、あらゆる金融商品にも使用できます。 インジケーターは再描画せず、遅れません。 推奨時間枠 H1. 設定と個人的なボーナスを得るために、購入後すぐに私に連絡してください!   設定 矢印を描く - オンオフ。 チャートに矢印を描く。 アラート - 可聴アラートのオンオフ。 メール通知 - オンオフ。 電子メール通知。 プチ通知 - オンオ
指示する     ロシア     -        utilizar con   el indicador の ESP 推奨事項 -   TPSpro トレンド プロフェッショナル版 -   MT5のバージョン 最も重要なことは、将来においても最も重要なことです。 機能のプリンシパル: ゾーンのほとんどは、ベンダーとコンプラドールによってアクティブ化されます。 状況を直感的に把握できるよう、初期の衝動を修正します。 LOGIC AI: MUESTRA zonas (círculos) parabuscar puntos de entrada cuando se activa una plantilla 視覚的に優れた視覚効果があり、最も重要な機能がすべて揃っていることに注意してください。 優れたニベレス/ゾーンの視覚化 (modo MTF) 世界で最も人気のある場所/ゾーンです。これを使用するのに最適な方法です (   TPSproTREND PRO   )。 アルゴリズム プロフェッショナル セパラド パソ ア パソ パラ オペラ それは、オペラハウスやコントラ・デ・エラの指導におい
このダッシュボードは、選択されたシンボルの最新の利用可能なハーモニックパターンを表示するので、時間を節約し、より効率的に /   MT4バージョン 。 無料インジケーター:   Basic Harmonic Pattern インジケーター列 Symbol : 選択したシンボルが表示されます。 Trend :   強気または弱気 Pattern : パターンの種類(ガートレー、バタフライ、バット、カニ、サメ、サイファー、ABCD) Entry : エントリー価格 SL: ストップロス価格 TP1: 1回目の利食い価格 TP2: 2回目の利食い価格 TP3:   3回目の利食い価格 Current price :   現在値 Age (in bars):    最後に描画されたパターンの年齢 主な入力項目 Symbols:   "28 Major Currency Pairs "または "Selected Symbols "から選択。 Selected Symbols:   カンマで区切られた監視したいシンボル("EURUSD,GBPUSD,XAUUSD")。ブローカーがペアに接
VERSION MT4        —        ИНСТРУКЦИЯ RUS           —        INSTRUCTIONS  ENG 主な機能: レンダリングなしで正確な入力信号! シグナルが表示されると、それは関連性を維持します。これは、シグナルを提供してからそれを変更し、その結果、入金された資金が失われる可能性があるリドローインジケーターとの重要な違いです。より高い確率と精度で市場に参入できるようになりました。矢印が表示された後、ターゲットに到達する (利益確定) か反転シグナルが表示されるまで、ローソク足に色を付ける機能もあります。 STOP-LOSS/TAKE-PROFITゾーンの表示 エントリーポイントを検索する際の視覚的な明瞭さを改善するために、最適な市場エントリーポイントが検索される購入/販売ゾーンを最初に表示するモジュールが作成されました。ストップロスレベルを操作するための追加のインテリジェントロジックは、時間の経過とともにそのサイズを縮小するのに役立ち、それによって取引に参加するときの初期リスクを軽減します(Move SL)。 より高いタイ
IX Power: 指数、商品、暗号資産、外国為替市場の洞察を発見 概要 IX Power は、指数、商品、暗号資産、外国為替市場の強弱を分析するための多用途ツールです。 FX Power が全ての利用可能な通貨ペアデータを活用して外為ペアで最高の精度を提供する一方、 IX Power は基礎資産の市場データにのみ焦点を当てています。この特性により、 IX Power は非外為市場に最適であり、単純な外為分析にも信頼性の高いツールです。どのチャートでもスムーズに機能し、取引判断を向上させるための明確で実行可能な洞察を提供します。 1. IX Power がトレーダーにとって価値がある理由 複数市場での強弱分析 • IX Power は指数、商品、暗号資産、外為シンボルの強弱を計算し、それぞれの市場に合わせた洞察を提供します。 • US30、WTI、ゴールド、ビットコイン、または通貨ペアなどの資産を監視して取引機会を発見できます。 幅広い市場に適応 • 外為取引では、 FX Power が関連する全ての通貨ペアを分析することで比類のない精度を提供します。 • IX Power
Matrix Arrow Indicator MT5
Juvenille Emperor Limited
5 (13)
マトリックスアローインジケーターMT5は、すべてのシンボル/商品(外国為替、商品、暗号通貨、インデックス、株式)で使用できる100%再描画されていないマルチタイムフレームインジケーターに続くユニークな10in1トレンドです。マトリックスアローインジケーターMT5は、初期段階で現在のトレンドを判断し、最大10の標準インジケーターから情報とデータを収集します。 平均方向移動指数(ADX) 商品チャネルインデックス(CCI) クラシック平研アシキャンドル 移動平均 移動平均収束発散(MACD) 相対活力指数(RVI) 相対力指数(RSI) 放物線SAR ストキャスティクス ウィリアムズのパーセント範囲 すべてのインジケーターが有効な買いまたは売りシグナルを与えると、対応する矢印がチャートに印刷され、次のろうそく/バーの開始時に強い上昇トレンド/下降トレンドを示します。ユーザーは、使用するインジケーターを選択し、各インジケーターのパラメーターを個別に調整できます。マトリックスアローインジケーターMT5は選択されたインディケーターからのみ情報を収集し、それらのデータのみに基づいてアローを印刷
トレンドラインマップインジケーターは、トレンドスクリーナーインジケーターのアドオンです。トレンドスクリーナー(トレンドラインシグナル)によって生成されたすべてのシグナルのスキャナーとして機能します。 これは、トレンドスクリーナーインジケーターに基づくトレンドラインスキャナーです。 Trend Screener Pro インジケーターがない場合、Trend Line Map Proは機能しません。 It's a Trend Line Scanner based on Trend Screener Indicator. If you don't have Trend Screener Pro Indicator,     the Trend Line Map Pro will not work . ブログにアクセスすると、トレンドラインマップインジケーターの無料バージョンをダウンロードできます。 Metatrader Testerの制限なしで、購入する前に試してみてください。 :  ここをクリック 1.簡単になる利点 通貨と時間枠に基づいて売買シグナルを表示します。 チャー
Quantum TrendPulse を ご紹介します。これは、   SuperTrend   、   RSI   、および Stochastic のパワーを 1 つの包括的なインジケーターに組み合わせて、取引の可能性を最大限に引き出す究極の取引ツールです。精度と効率を求めるトレーダー向けに設計されたこのインジケーターは、市場のトレンド、勢いの変化、最適なエントリー ポイントとエグジット ポイントを自信を持って特定するのに役立ちます。 主な特徴: SuperTrend 統合: 現在の市場動向に簡単に追従し、収益性の波に乗ることができます。 RSI精度: 買われすぎと売られすぎのレベルを検出し、市場の反転のタイミングに最適で、SuperTrendのフィルターとして使用されます。 確率的精度: 確率的振動を活用して、変動の激しい市場で隠れたチャンスを見つけます。SuperTrend のフィルターとして使用されます。 マルチタイムフレーム分析:   M5 から H1 または H4 まで、さまざまなタイムフレームで市場を常に把握します。 カスタマイズ可能なアラート: カスタム取引条件が満たされ
FourAverageは、トレンド検出の新しい単語です。 情報技術の発展と多数の参加者に伴い、金融市場は時代遅れの指標による分析にあまり適していなくなっています。 移動平均や確率などの従来のテクニカル分析ツールは、純粋な形でトレンドの方向やその反転を決定することはできません。 1つの指標は、14年の歴史に基づいて、そのパラメータを変更することなく、将来の価格の正しい方向を示すことができますか? 同時に、横向きの市場の動きで妥当性を失うことはありませんか? 答え:はい、それはできます。 私たちのチームは、変化する市場の状況に適応するためのかなり強力で効果的なメカニズムを持つ指標を開発しました。 2025年には、主要なトレンド指標"Four平均"は開発の新しい段階に入っています。 現代の暗号通貨と株式市場は、この指標のために作成されたようです。 独自の平滑化式を使用すると、通貨ペアまたは他の楽器の任意の機能のための指標を調整(パターンを識別)することができます。 さて、利益を上げるためには、1つの指標で十分であり、これはほんの始まりに過ぎません。 他のツールと組み合わせて、または信号フィル
FX Dynamic: カスタマイズ可能なATR分析でボラティリティとトレンドを把握 概要 FX Dynamic は平均的な真のレンジ(ATR)の計算を活用して、日次および日中ボラティリティに関する卓越した情報をトレーダーに提供する強力なツールです。80%、100%、130%などのボラティリティ閾値を設定することで、通常の範囲を超えた際にすぐに警告を受け取ったり、有望な利益機会を素早く捉えられます。 FX Dynamic はブローカーのタイムゾーンに合わせて調整でき、安定したボラティリティ測定を維持しながら、リアルタイム分析のためにMetaTraderとシームレスに連携します。 1. なぜFX Dynamicがトレーダーにとって非常に有益か リアルタイムのATRインサイト • 日次・日中のボラティリティをひと目で把握。価格がATRの80%、100%、130%などに達したときに警告を受け取り、重要な水準にあるかどうかを確認できます。 • ボラティリティが完全に爆発する前に潜在的な反転やブレイクアウトを先取り可能。 幅広いマーケットへの適用 • 外国為替、コモディティ、株価指数な
CBT Quantum Maverick 高効率バイナリーオプション取引システム CBT Quantum Maverickは、高いパフォーマンスとシンプルさを追求するトレーダー向けに設計されたバイナリーオプション取引システムです。カスタマイズの必要がなく、最適化された状態で使用を開始できます。シグナルに従うだけで、少しの練習でマスターできます。 主な特徴: シグナルの精度: 現在のローソク足を基に次のローソク足の取引シグナルを生成し、頻繁な再描画がありません。 多様な市場対応: バイナリーオプション取引に特化し、さまざまなブローカーや資産クラスに対応しています。 対応可能: Deriv Synthetic Charts :すべてのタイムフレームで使用可能。 OTCチャート :Quotex、PocketOption、Binomo、Stockity、IQOption、Exnova、OlympTrade、Deriv、Binolla、Homebrokerなどのブローカーに対応。MT5へのインポートは最初の1週間無料、その後は有料サービス。 FX、仮想通貨、商品市場 :幅広い資産利用が可能
- Lifetime update free Contact me for instruction, any questions! Related Product:  Gold Trade Expert MT5 - Non-repaint - I just sell my products in Elif Kaya Profile, any other websites are stolen old versions, So no any new updates or support. Introduction The breakout and retest strategy is traded support and resistance levels. it involves price breaking through a previous level.  The break and retest strategy is designed to help traders do two main things, the first is to avoid false breako
まず第一に、この取引ツールはノンリペイント、ノンリドロー、ノンラグの指標であり、プロの取引に理想的ですことを強調する価値があります。 オンラインコース、ユーザーマニュアル、デモ。 スマートプライスアクションコンセプトインジケーターは、新米から経験豊富なトレーダーまで、非常 に強力なツールです。Inner Circle Trader AnalysisやSmart Money Concepts Trading Strategiesなど、20以上の有用な指標を1つに組み合わせています。このインジケーターはスマートマネーコンセプトに焦点を当て、大手機関の取引方法を提供し、彼らの動きを予測するのに役立ちます。 特に、流動性分析に優れており、機関がどのように取引しているかを理解しやすくしています。市場のトレンドを予測し、価格の動きを慎重に分析するのに優れています。機関の戦略とトレードを合わせることで、市場の動向についてより正確な予測ができます。このインジケーターは多目的であり、市場構造を分析し、重要な注文ブロックを特定し、さまざまなパターンを認識するのに優れています。 このインジケーター
Trend Hunter は、外国為替、仮想通貨、CFD 市場におけるトレンド指標です。 このインジケーターの特別な特徴は、価格がトレンドラインをわずかに突き抜けたときにシグナルを変更することなく、自信を持ってトレンドに従うことです。 インジケーターは再描画されず、バーが閉じた後に市場に参入するシグナルが表示されます。 トレンドに沿って移動すると、インジケーターにはトレンドの方向に追加のエントリーポイントが表示されます。 これらのシグナルに基づいて、小さなストップロスで取引できます。 トレンドハンターは正直な指標です。 インジケーター信号の上にマウスを置くと、信号の潜在的な利益と可能なストップが表示されます。 新しい信号が表示されると、次の通知を受け取ることができます。 アラート プッシュ通知 メールによる通知 電報での通知 チャートのスクリーンショットも Telegram に送信されるため、取引を決定するために端末を開く必要はありません。 インジケーターシグナルは、電報チャネル https://www.mql5.com/ja/market/product/11085#!ta
まず第一に、このトレーディングシステムがノンリペイント、ノンリドロー、ノンラグのインジケーターであることを強調する価値がある。これにより、手動取引とロボット取引の両方に理想的なものになっています。 オンラインコース、マニュアル、プリセットのダウンロード。 「スマートトレンドトレーディングシステム MT5」は、新規および経験豊富なトレーダー向けにカスタマイズされた包括的なトレーディングソリューションです。10以上のプレミアムインジケーターを組み合わせ、7つ以上の堅実なトレーディング戦略を備えており、多様な市場状況に対応する多目的な選択肢となっています。 トレンドフォロー戦略:トレンドを効果的に乗り越えるための正確なエントリーとストップロス管理を提供します。 リバーサル戦略:潜在的なトレンドの反転を特定し、トレーダーがレンジ相場を活用できるようにします。 スキャルピング戦略:高速で正確なデイトレードおよび短期取引のために設計されています。 安定性:すべてのインジケーターはノンリペイント、ノンリドロー、ノンラグであり、信頼性の高いシグナルを保証します。 カスタマイズ:個々の取引の嗜好に合わせ
Royal Scalping Indicator is an advanced price adaptive indicator designed to generate high-quality trading signals. Built-in multi-timeframe and multi-currency capabilities make it even more powerful to have configurations based on different symbols and timeframes. This indicator is perfect for scalp trades as well as swing trades. Royal Scalping is not just an indicator, but a trading strategy itself. Features Price Adaptive Trend Detector Algorithm Multi-Timeframe and Multi-Currency Trend Low
Gold Trend 5
Sergei Linskii
3.5 (2)
Gold Trend - これは優れた株価テクニカル指標です。指標のアルゴリズムは、資産の値動きを分析し、ボラティリティと潜在的なエントリーゾーンを反映しています。 最高の指標シグナル: - 売りの場合 = 赤のヒストグラム + 赤のショートポインター + 同じ方向に黄色のシグナル矢印。 - 買いの場合 = 青のヒストグラム + 青のロングポインター + 同じ方向の水色のシグナル矢印。 インジケータの利点 1. このインディケータは、高い精度でシグナルを発信します。 2. 確定した矢印シグナルは、トレンドが変化したときにのみ再描画されます。 3. どのブローカーのMetaTrader 5取引プラットフォームでも取引できます。 4. あらゆる資産(通貨、金属、暗号通貨、株式、指数など)を取引できます。 5. H1タイムフレーム(中期取引)で取引するのがよい。 6. 各トレーダーがインディケータを自分用に簡単にカスタマイズできるよう、インディケータ設定で個々のパラメータ(TF、色など)を変更できます。 7. このインディケータは、トレーディングシステムの優れたメイン機能として
Auto Order Block with break of structure based on ICT and Smart Money Concepts (SMC) Futures Break of Structure ( BoS )             Order block ( OB )            Higher time frame Order block / Point of Interest ( POI )    shown on current chart           Fair value Gap ( FVG ) / Imbalance   -  MTF      ( Multi Time Frame )    HH/LL/HL/LH  -  MTF      ( Multi Time Frame )  Choch  MTF      ( Multi Time Frame )  Volume Imbalance     ,  MTF          vIMB Gap’s Power of 3 Equal High / Low’s  
Special offer : ALL TOOLS , just $35 each! New tools   will be   $30   for the   first week   or the   first 3 purchases !  Trading Tools Channel on MQL5 : Join my MQL5 channel to update the latest news from me Volumatic VIDYA (Variable Index Dynamic Average) は、トレンドを追跡し、トレンドの各フェーズ内での買い圧力と売り圧力を分析するために設計された高度なインジケーターです。可変インデックス動的平均 (Variable Index Dynamic Average) をコアの動的平滑化技術として利用することで、このツールは、価格とボリュームのダイナミクスに関する重要な洞察を、市場構造の重要なレベルで提供します。 MT4バージョンを見る:  Volumatic VIDyA MT4 他の製品を見る:   全製品 To use iCus
まず第一に、この取引インジケーターは再描画されず、再描画されず、遅延しないことを強調する価値があります。これにより、手動取引とロボット取引の両方に理想的なものになります。 ユーザーマニュアル:設定、入力、戦略。 アトミックアナリストは、価格の強さとモメンタムを利用して市場でより良いエッジを見つけるためのPA価格アクションインジケーターです。ノイズや誤ったシグナルを除去し、取引ポテンシャルを高めるための高度なフィルターを備えています。複雑なインジケーターの複数のレイヤーを使用して、アトミックアナリストはチャートをスキャンし、複雑な数学的計算をシンプルなシグナルと色に変換します。これにより、どのような初心者トレーダーでも理解して使用し、一貫した取引の決定を行うことができます。 「アトミックアナリスト」は、新規および経験豊富なトレーダー向けにカスタマイズされた包括的な取引ソリューションです。プレミアムインジケーターとトップノッチの機能を1つの取引戦略に組み合わせ、すべてのタイプのトレーダーにとって汎用性のある選択肢にします。 デイリートレーディングとスキャルピング戦略:高速で正確なデイ
ATrend
Zaha Feiz
4.77 (13)
ATrend: その仕組みと使い方 仕組み MT5プラットフォーム向けの「ATREND」インジケーターは、テクニカル分析手法の組み合わせを利用して、トレーダーに堅牢な買いと売りのシグナルを提供するように設計されています。このインジケーターは主に、ボラティリティ測定のために平均真の範囲(ATR)を活用し、潜在的な市場動向を特定するためのトレンド検出アルゴリズムを併用しています。 購入後にメッセージを残すと、特別なボーナスギフトが贈呈されます。 主な特徴: - ダイナミックなトレンド検出: インジケーターは市場トレンドを評価し、シグナルを適宜調整することで、トレーダーが優位な市場環境に合わせて戦略を立てるのを支援します。     - ボラティリティ測定: ATRを使用することで、インジケーターは最適なストップロス(SL)とテイクプロフィット(TP)レベルを決定するために不可欠な市場ボラティリティを測定します。 - シグナルの視覚化: インジケーターは、チャート上に買いと売りのシグナルを視覚的に表示することで、トレーダーの意思決定を強化します。 操作手順 入力とセッティング - TimeF
フィルタ:
Agbakeleke Idowu
689
Agbakeleke Idowu 2024.10.04 19:41 
 

Good Indicator. Testing it out... When it crosses up from neutral or down from neutral it is dangerous. It has a good potential. I will advise the creator to invest more features into it.. Like Push notifications when it crosses from neutral to stronger zones. Keep it up. More Grace for making this Gold free

Avydel Talbo Doctolero
899
開発者からの返信 Avydel Talbo Doctolero 2024.10.04 20:08
Thank you for your thoughtful feedback on my indicator! I'm pleased to hear that you find it promising and are testing it out. Your observations about the crossovers from neutral zones are particularly insightful and valuable.
I appreciate your suggestion about adding push notifications for crossovers into stronger zones. That's an excellent idea that could enhance the indicator's usability and effectiveness. I'll definitely look into implementing this feature in a future update.
Your encouragement means a lot, and I'm grateful for the support. I'm committed to continually improving the indicator, and feedback like yours is instrumental in guiding those improvements. Thank you for taking the time to share your thoughts and for using the indicator.
If you have any other suggestions or encounter any issues while using it, please don't hesitate to reach out. Your input is crucial in making this tool as useful as possible for traders like yourself.
Thank you again for your support and for helping to make this indicator better for everyone!
レビューに返信