Gartley Guard Harmonics mt5
- インディケータ
- Ely Alsedy
- バージョン: 1.0
- アクティベーション: 5
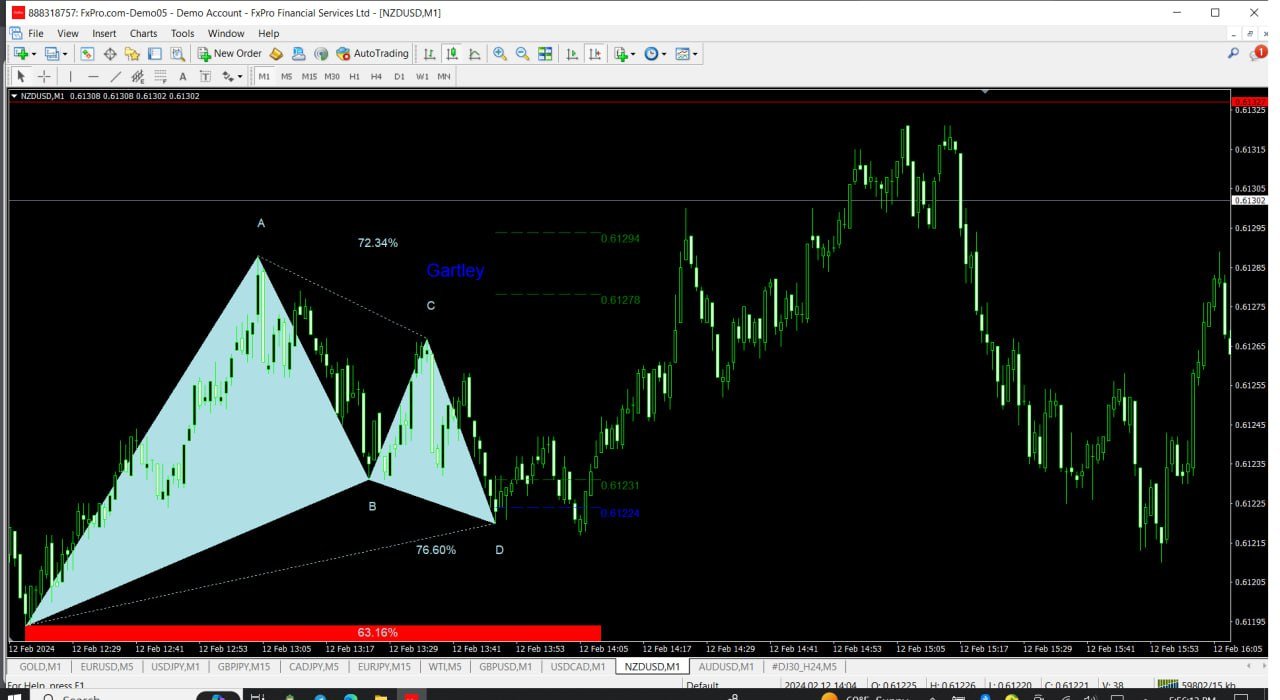
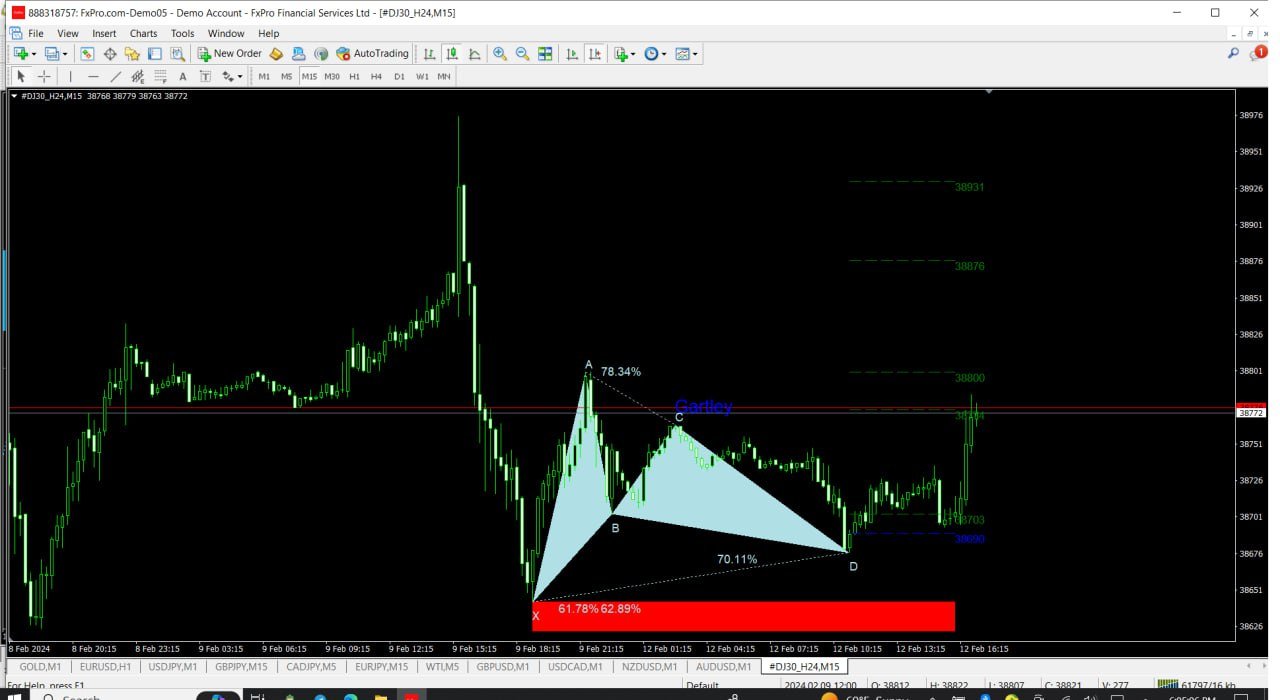
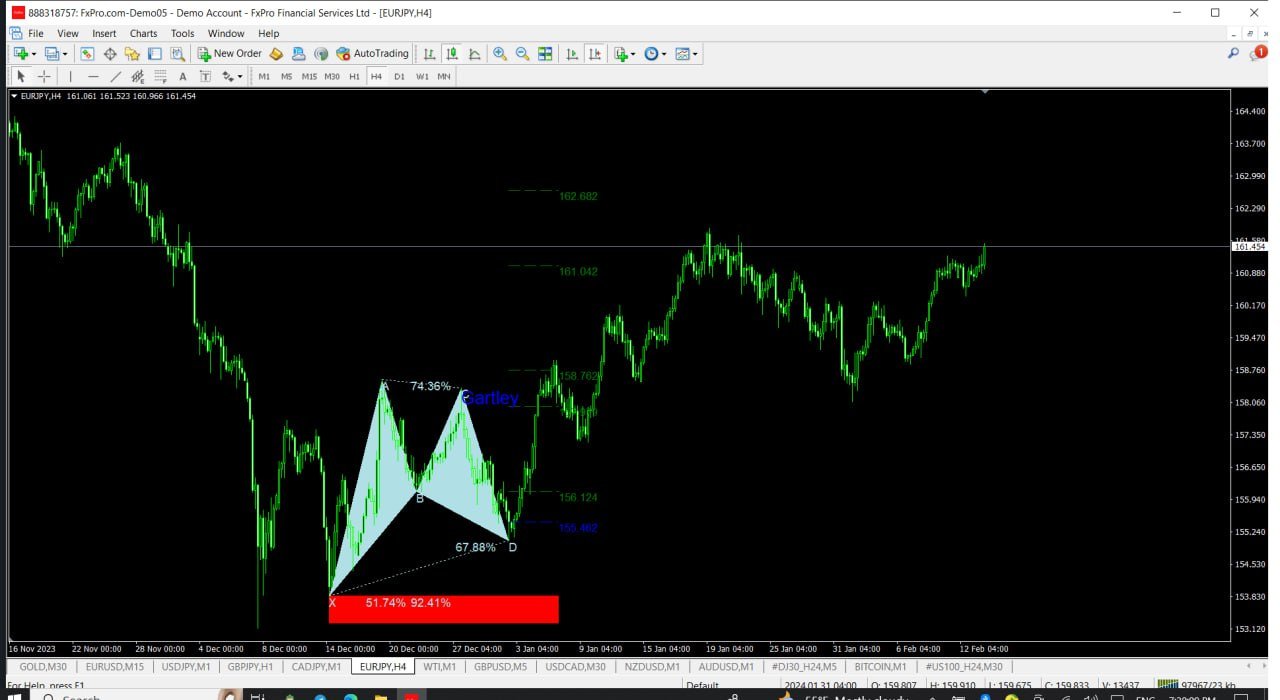
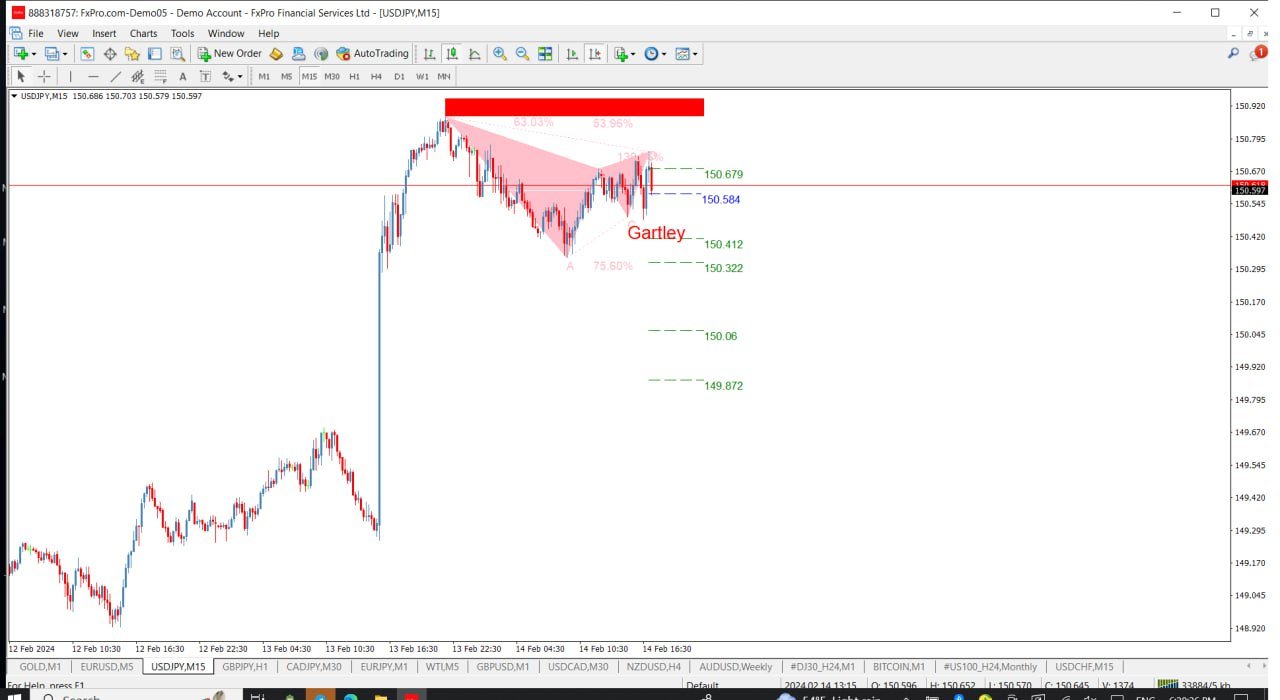
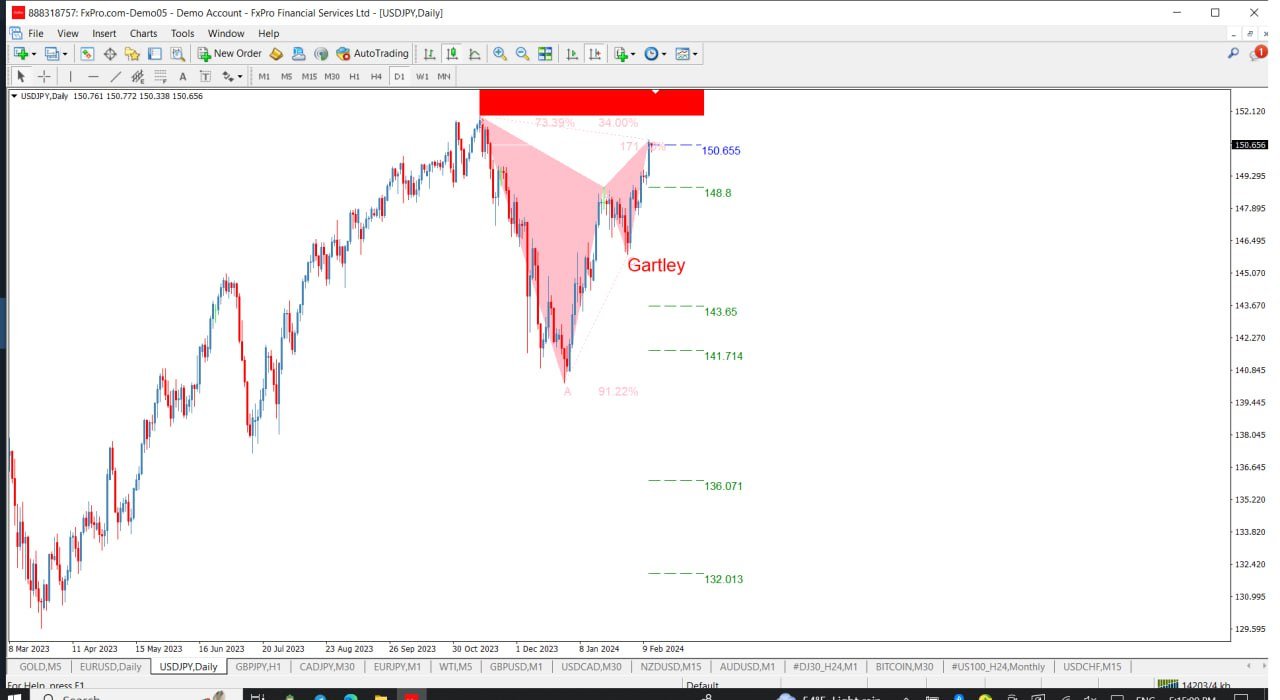
ハーモニックパターンは市場の転換点を予測するのに最適です。これらのパターンは高い勝率と1日の中での多くの取引機会を提供します。当社のインジケーターは、ハーモニックトレーディングの原則に基づいて、市場反転ポイントを予測する最も一般的なハーモニックパターンを特定します。
重要な注意事項:
- インジケーターは再描画されず、遅れることはありません(パターンはDポイントで検出されます);再描画されることはありません(パターンは有効またはキャンセルされます)。
使用方法:
- インジケーターをMT5チャートにドラッグアンドドロップします。
- パターン検出をTRUE(ABCD;Gartley)に設定します。
- 任意のデバイスを設定します(高いデバイス=より多くのパターン;低いデバイス=より少ないパターン)。
- 好みに合わせて色を調整します。
- バルブ/エントリーポイント、TP、SLの警告を有効または無効にします。
パターンが検出された場合:
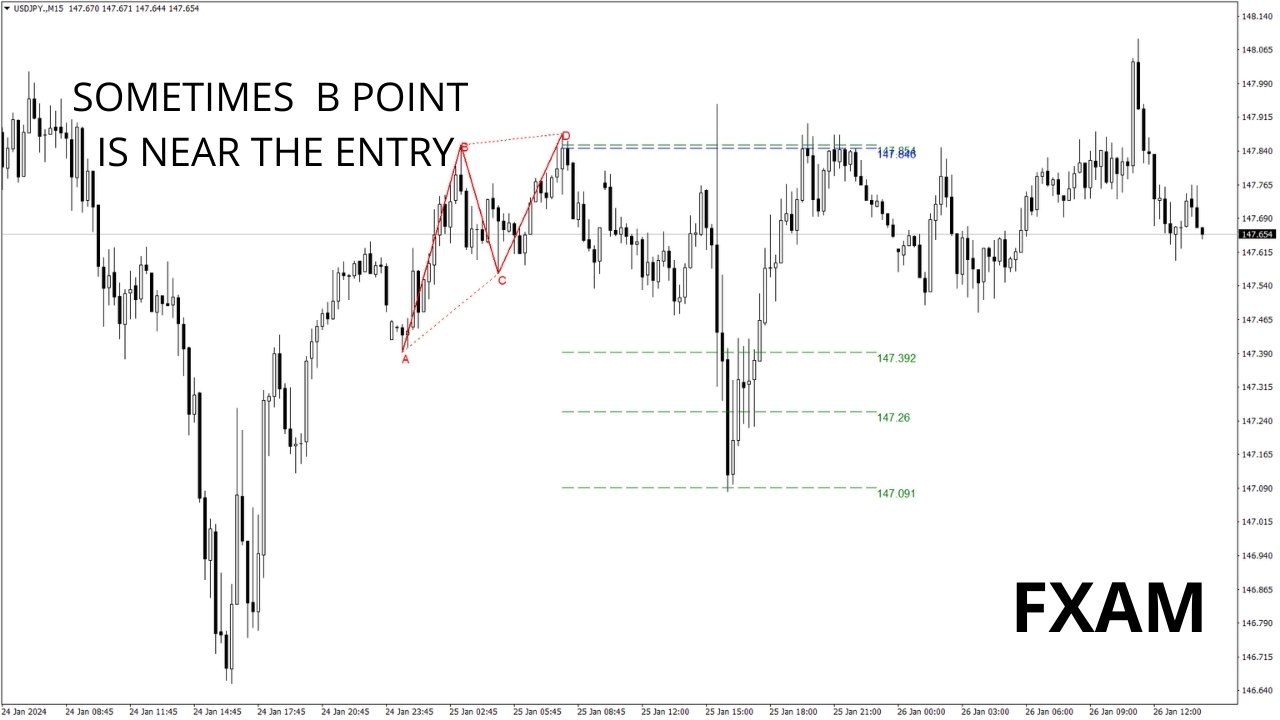
- アルゴリズムはDポイントでパターンを検出します。
- 警告が有効になっている場合、パターン検出を通知します。
- パターンが無効になった場合、「パターンがキャンセルされました」というメッセージの警告が発生します。
- 成功したパターンは、キャンドルが閉じたときに「エントリー警告」をトリガーします。
- 価格がTP1、TP2、TP3、TP4、またはSLに達した場合、端末にメッセージが表示されます。
価格は現在40ドルで、残りわずかなコピーがあります。最終価格は70ドルになります。
開発計画:
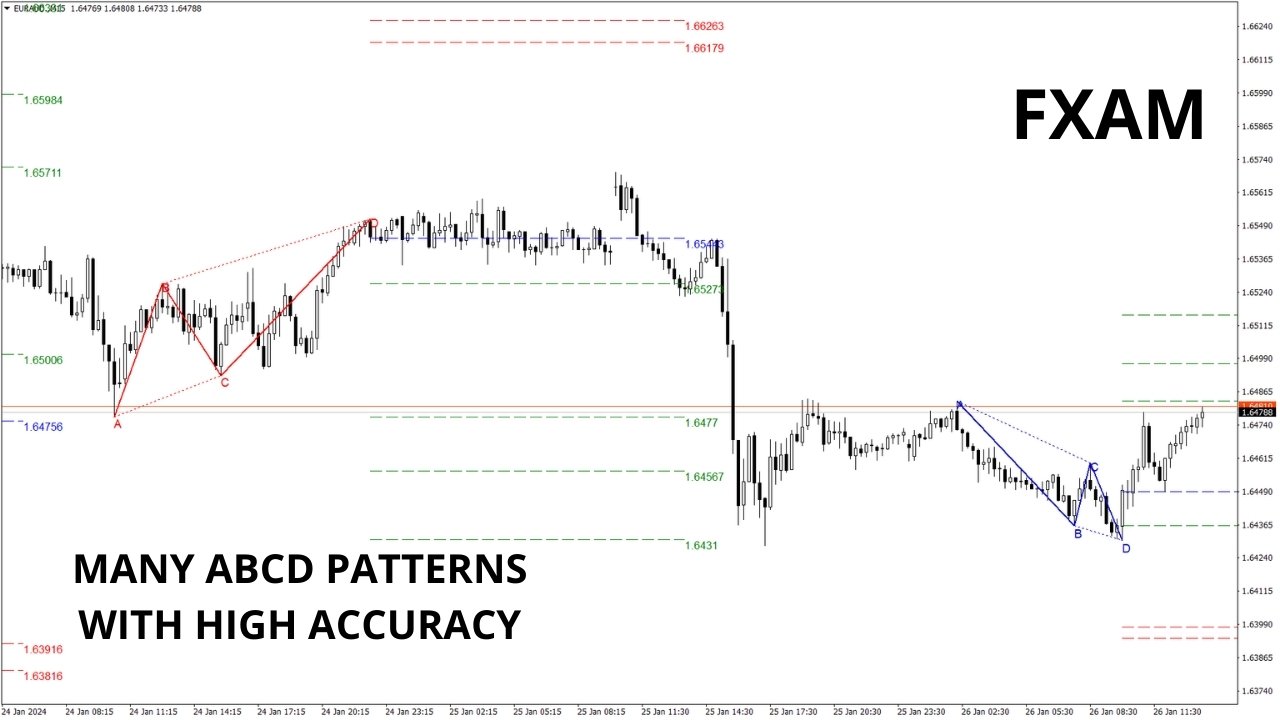
- このインジケーターの現在のバージョン(1.1)はガートリーとABCDパターンを検出します。
- バージョン1.1にはButterfly、Bat、Crabパターンが含まれます。
- 未来のバージョンでは、追加のパターン、潜在的なPRZの検出、および各パターンイベント(出現、完了、エントリー、SL / TP)の警告が提供されます。
- バージョン1.4には、すべての通貨ペアおよび時間枠でパターンを検出するスキャナーが導入され、定期的に更新されます。
- バージョン1.5には、パターンモニタリング用のダッシュボードが含まれます。
このインジケーターを購入することで、その持続的な開発に貢献します。
主な特徴:
- 使用が簡単でユーザーフレンドリーです。
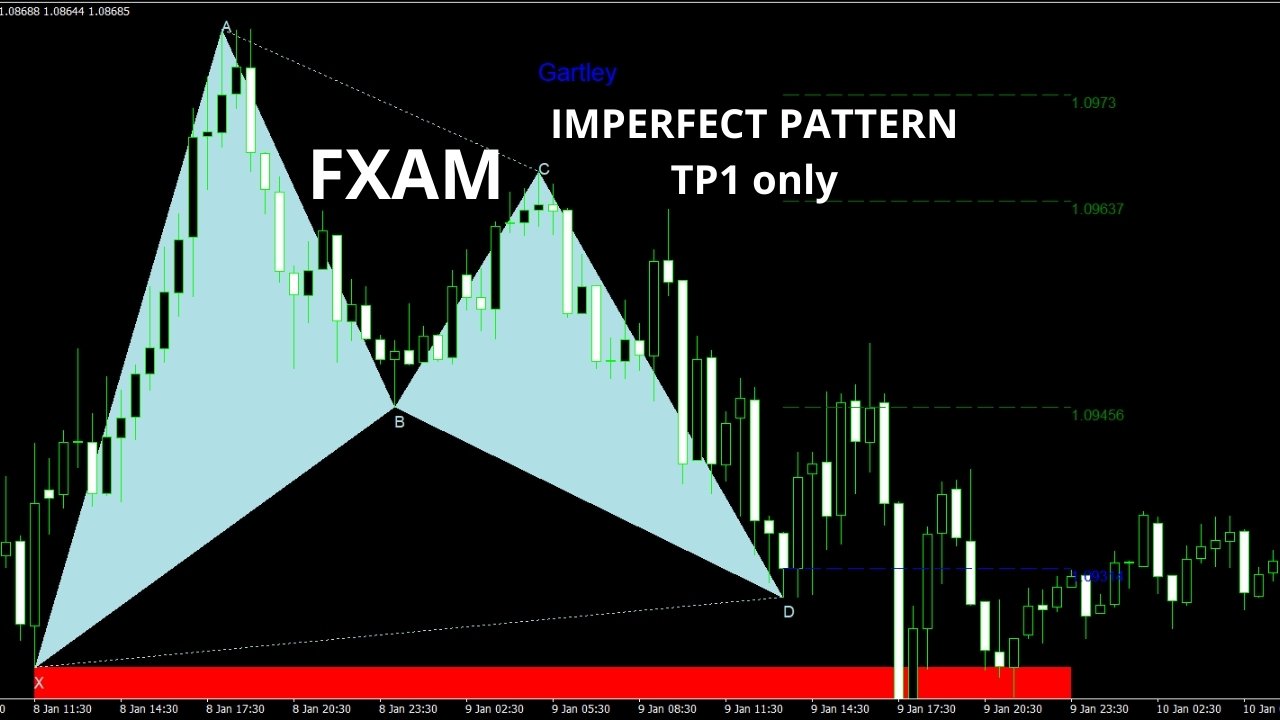
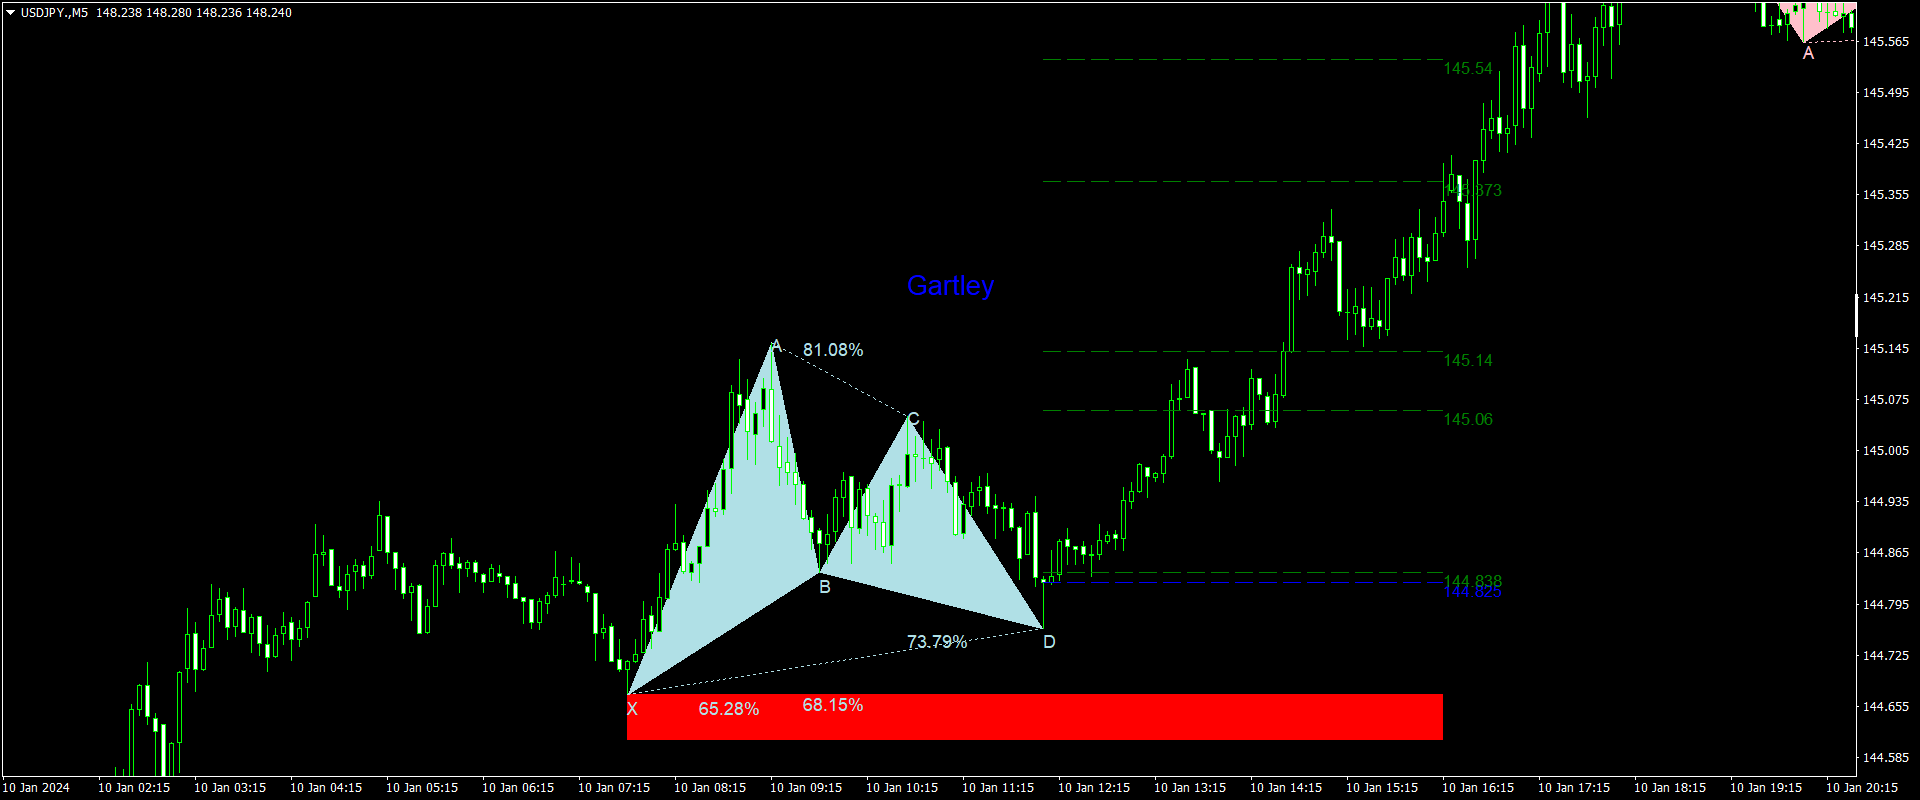
- フィボナッチレベルを使用してパターンを検出します。
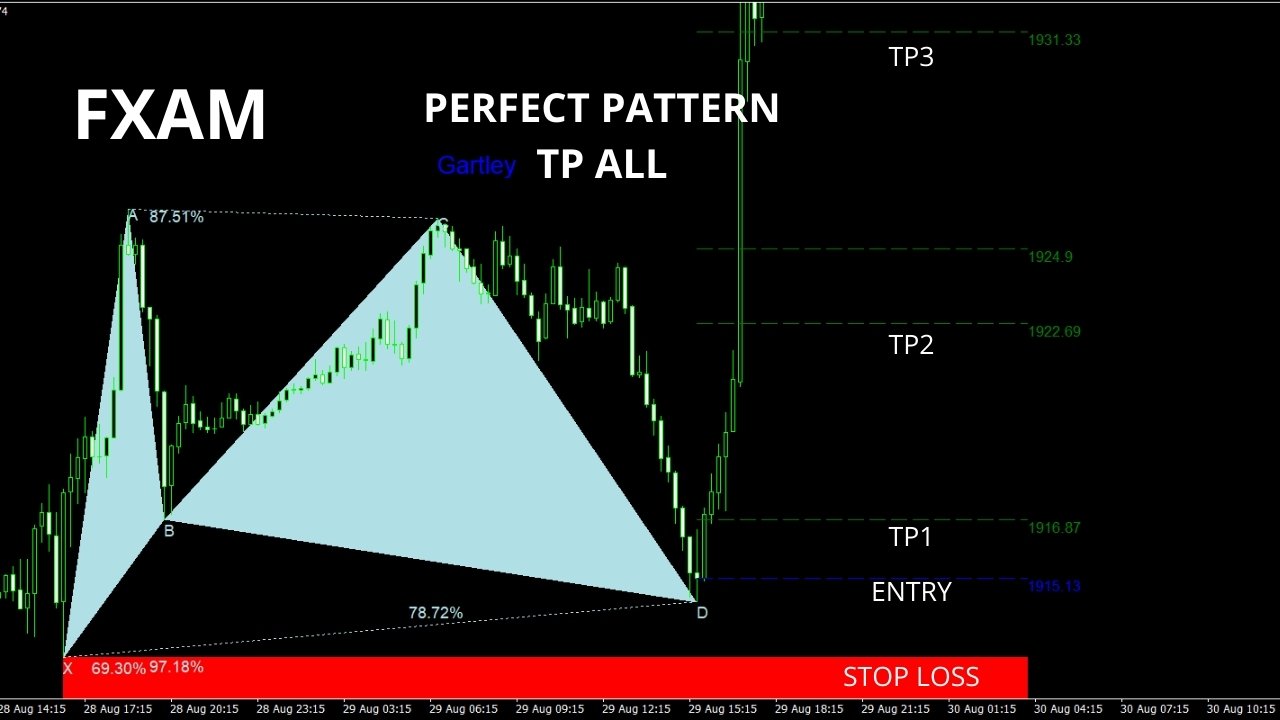
- 最後のTPに到達する完璧なパターンと、少なくともTP1に到達する不完全なパターンを検出します。
入力パラメータ:
- 一般設定には深さ、検出モード、履歴の使用、比率の表示、ポイントのラベルの表示、およびパターンからの距離が含まれます。
- ガートリーの設定では、牛市と熊市の色、偏差のパーセンテージ、表示オプションをカスタマイズできます。
- ABCDの設定には、偏差のパーセンテージとカラーカスタマイズが含まれます。
ユーザーは評価に対して何もコメントを残しませんでした