Gartley Guard Harmonics mt5
- Indicadores
- Ely Alsedy
- Versión: 1.0
- Activaciones: 5
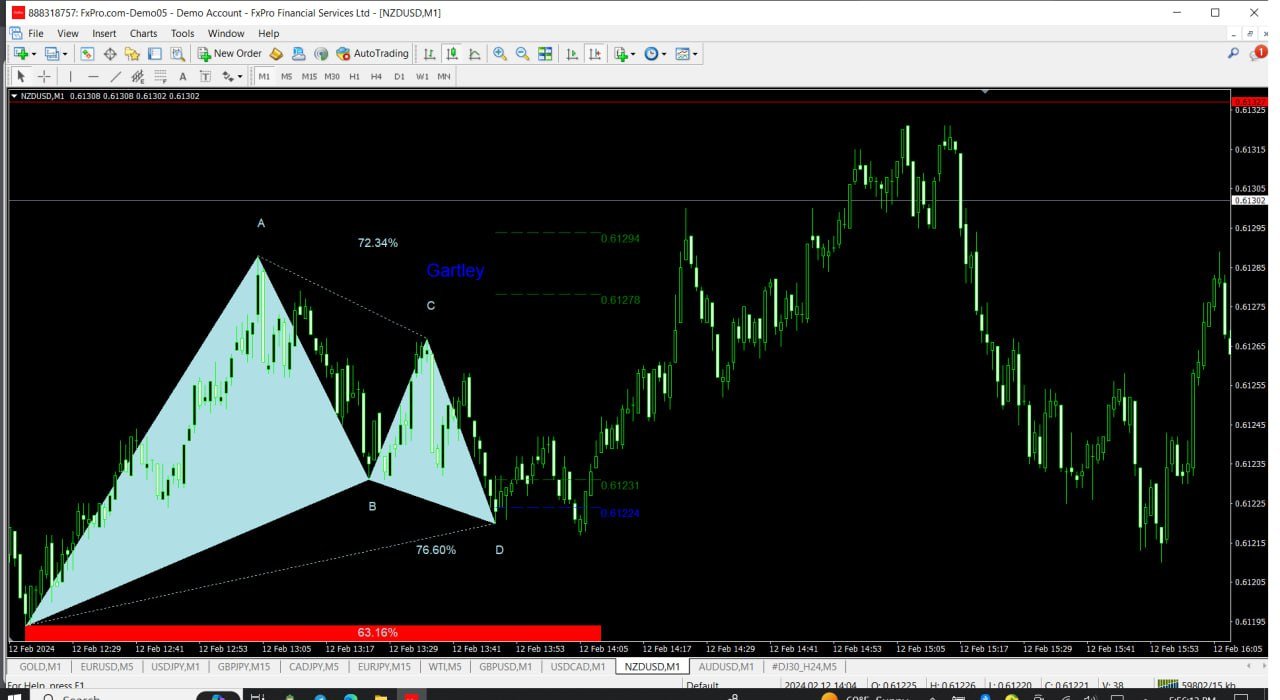
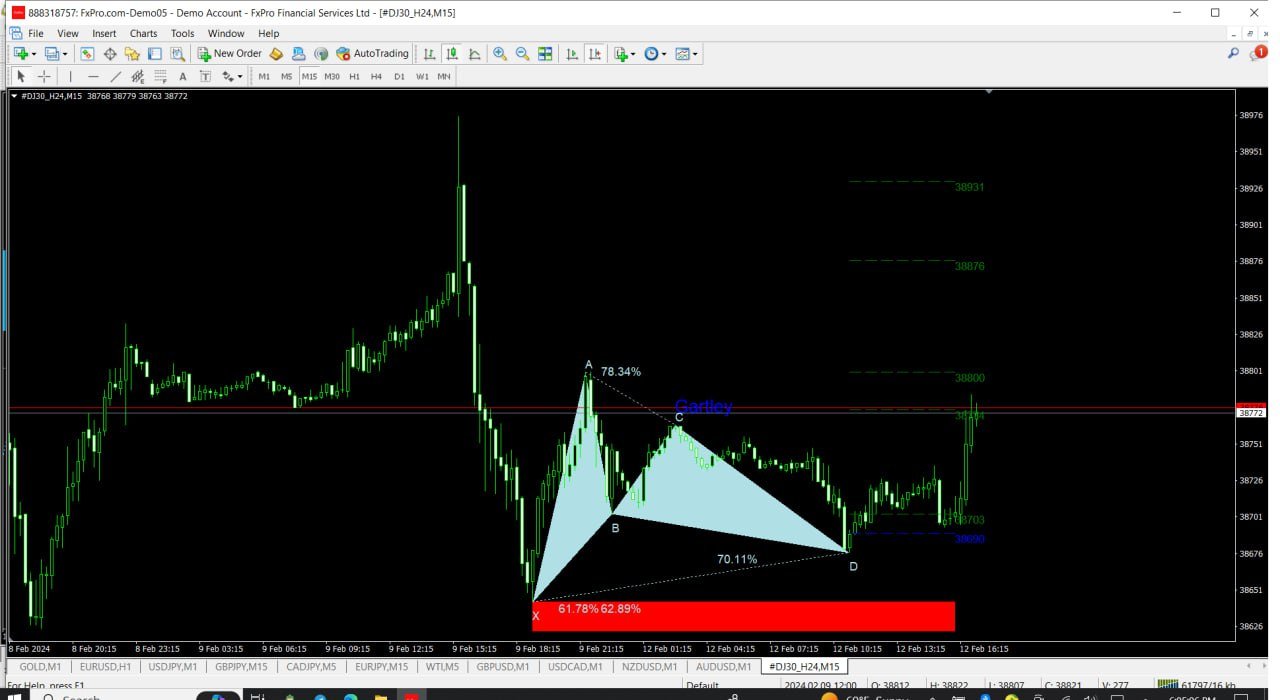
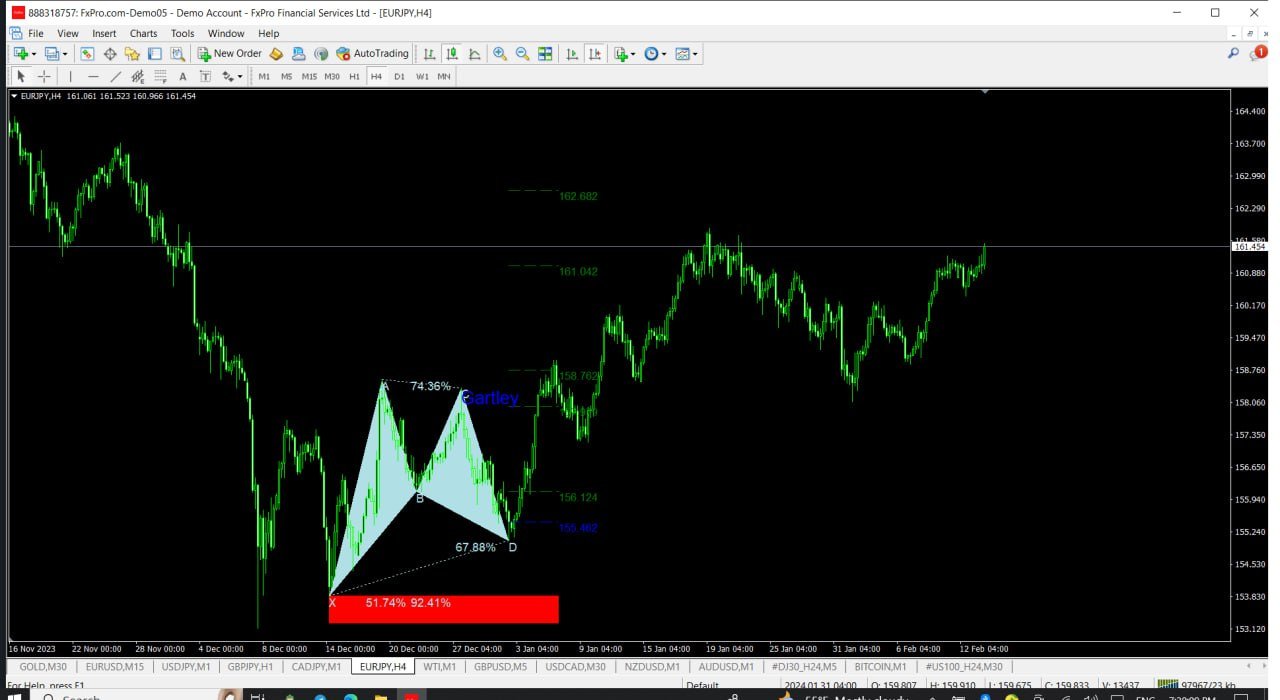
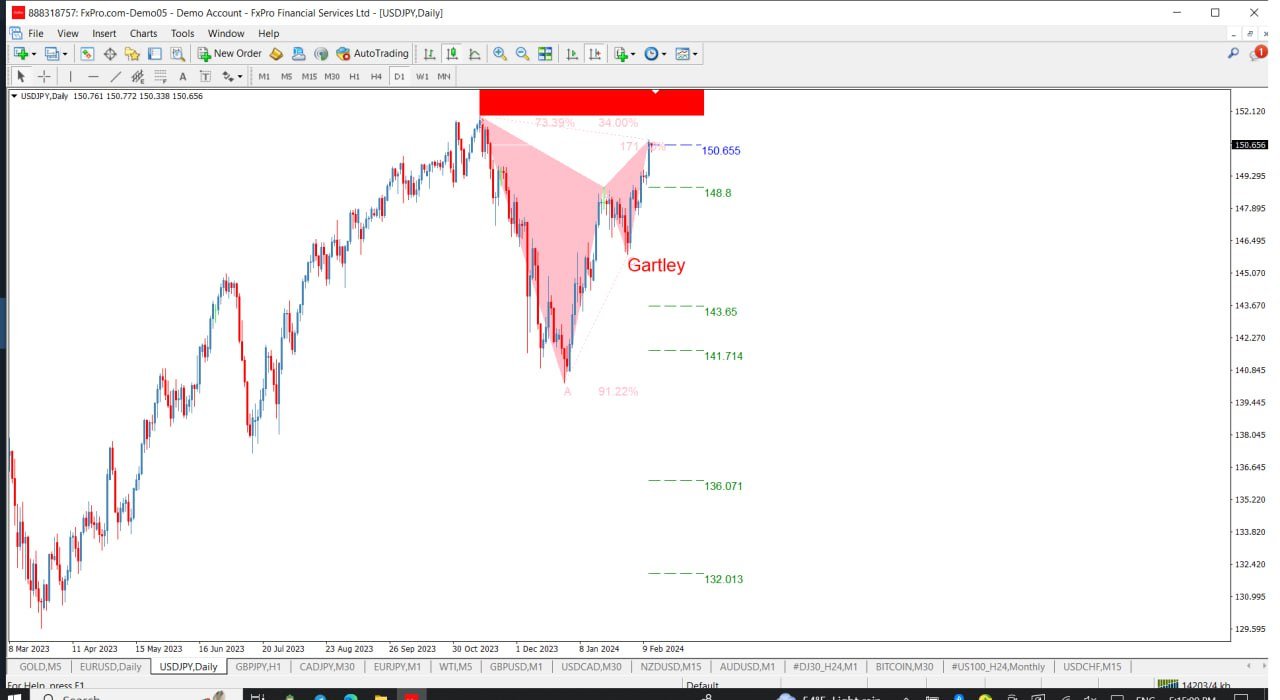
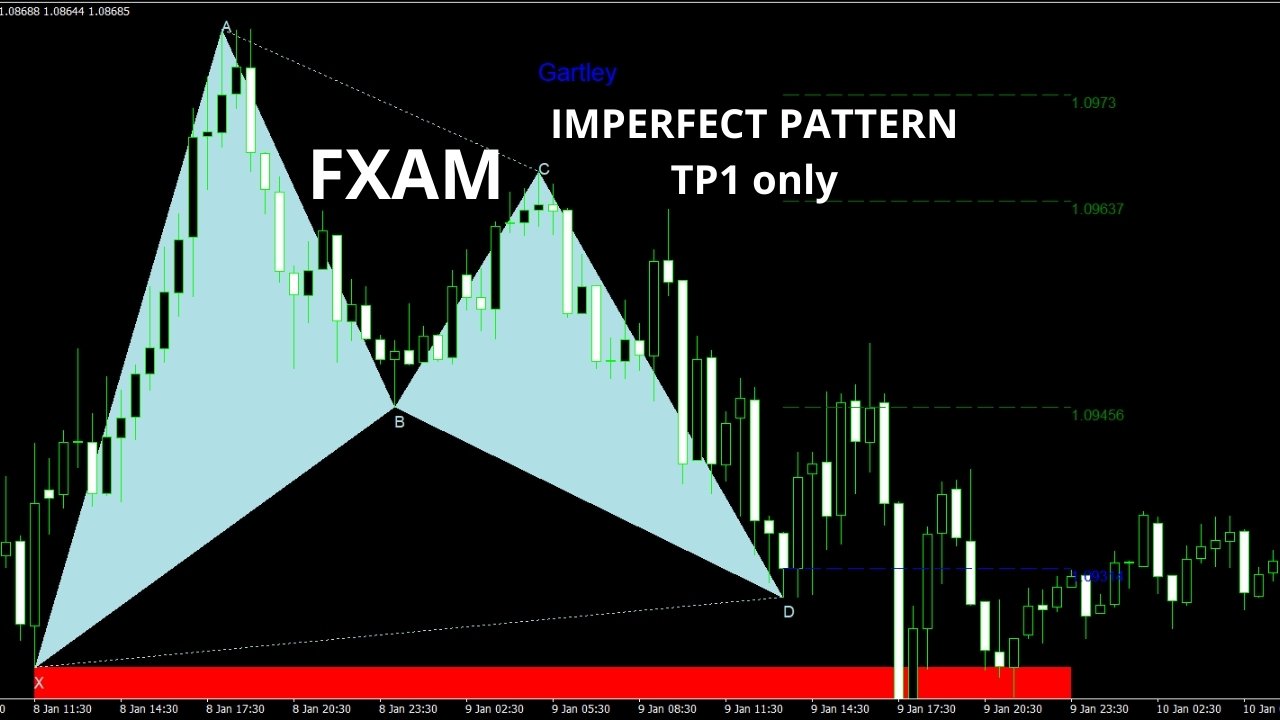
Los Patrones Armónicos son ideales para predecir puntos de giro en el mercado. Estos patrones ofrecen una alta tasa de éxito y numerosas oportunidades de operación en un solo día de trading. Nuestro indicador identifica los Patrones Armónicos más populares basados en los principios descritos en la literatura de Trading Armónico.
NOTAS IMPORTANTES:
- El indicador no repinta, no se retrasa (detecta un patrón en el punto D) y no se redibuja (el patrón es válido o cancelado).
CÓMO USARLO:
- Arrastre y suelte el indicador en su gráfico de MT5.
- Establezca la detección de patrones en TRUE para ABCD y Gartley.
- Ajuste la desviación según su preferencia (mayor desviación para más patrones, menor desviación para menos).
- Personalice los colores según sus preferencias.
- Active o desactive las alertas para PUNTO DE ENTRADA, TP y SL según lo desee.
CUANDO SE DETECTA UN PATRÓN:
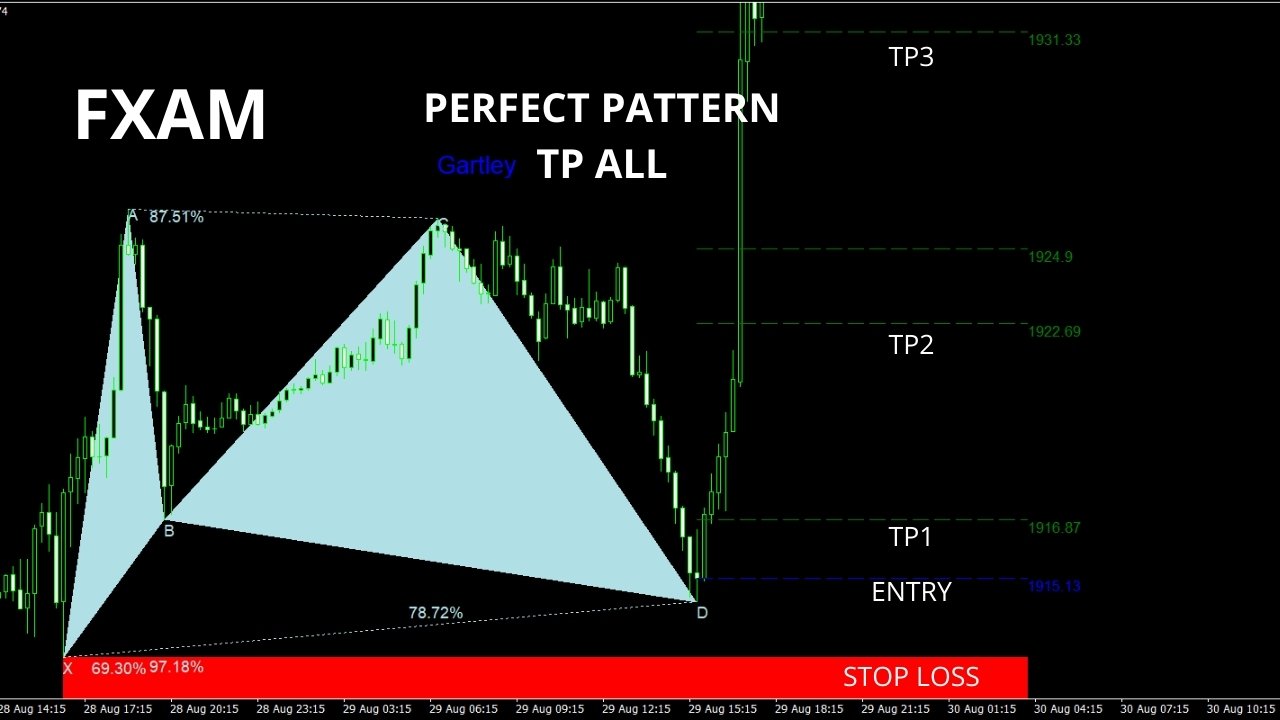
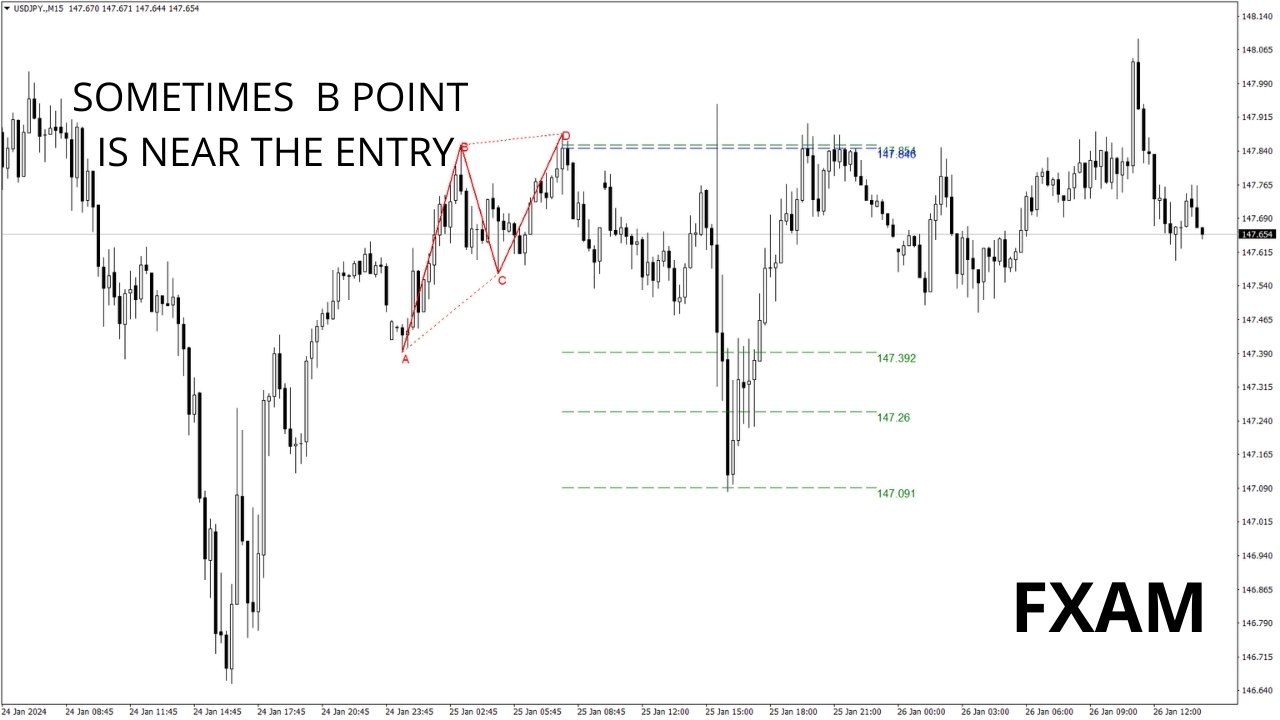
- El algoritmo detecta un patrón en el punto D.
- Si las alertas están habilitadas, le notificará la detección del patrón.
- Si se invalida un patrón, desencadena una alerta con el mensaje "PATRÓN CANCELADO".
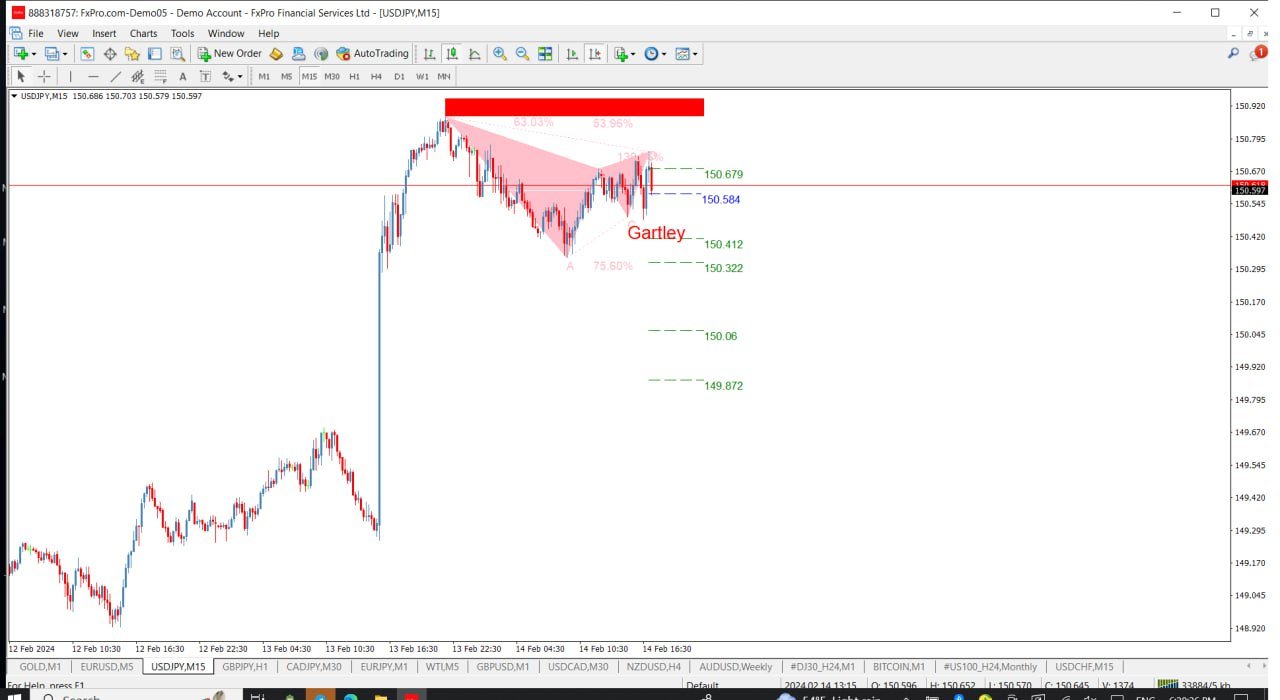
- Los patrones exitosos activan una ALERTA DE ENTRADA al cierre de la vela.
- Las alertas se envían al alcanzar TP1, TP2, TP3, TP4 o SL.
El precio actual es de $40 con solo unas pocas copias restantes. El precio final será de $70.
PLAN DE DESARROLLO:
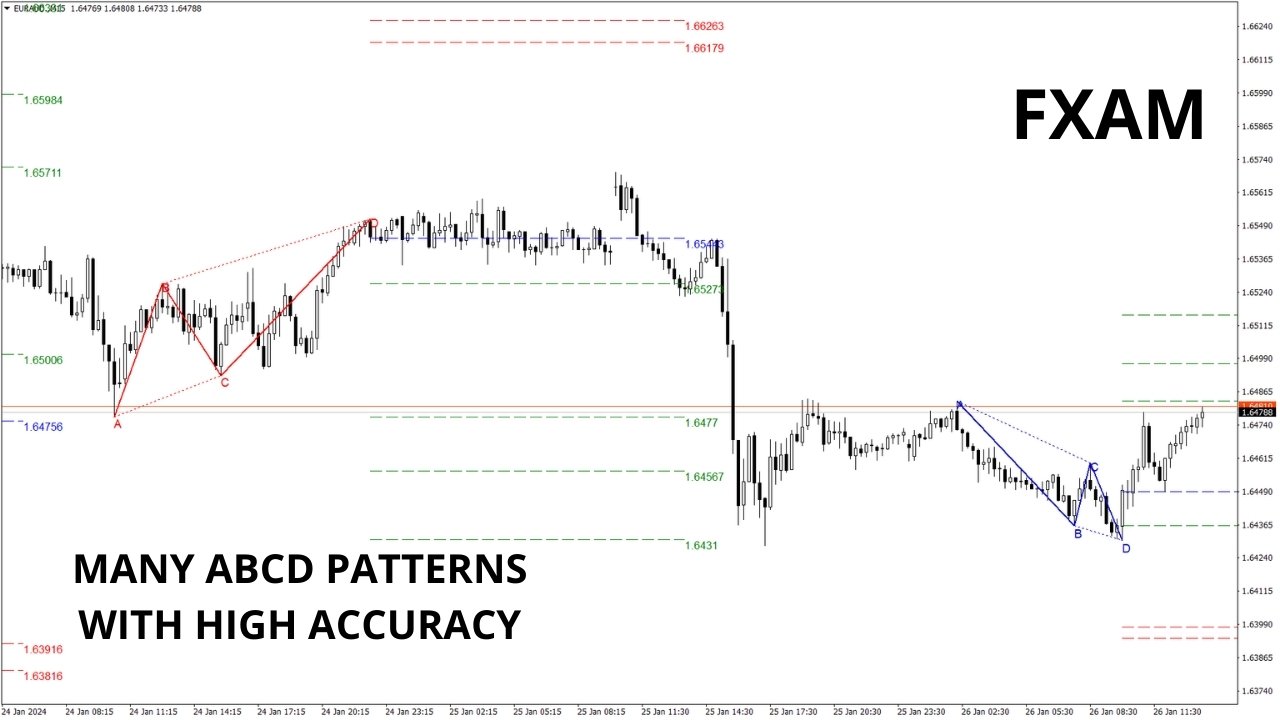
- La versión 1.1 de este indicador detectará los patrones Gartley y ABCD.
- En la versión 1.1, agregaré Butterfly, Bat y Crab.
- En versiones futuras, agregaré patrones adicionales, detección potencial de PRZ y alertas para cada evento del patrón (aparición, completado, entrada, SL \ TP).
- En la versión 1.4, agregaré un escáner para buscar patrones en todos los pares y marcos temporales y actualizarlo periódicamente.
- En la versión 1.5, agregaré un TABLERO DE CONTROL debajo de la ventana del gráfico para monitorear los patrones y ver (nombre del patrón, par, dirección, marco temporal, patrón futuro o completo, PRZ potencial, etc.).
Al comprar este indicador, ayudará a desarrollarlo a su máximo potencial.
Características Principales:
- Fácil de usar y amigable para el usuario.
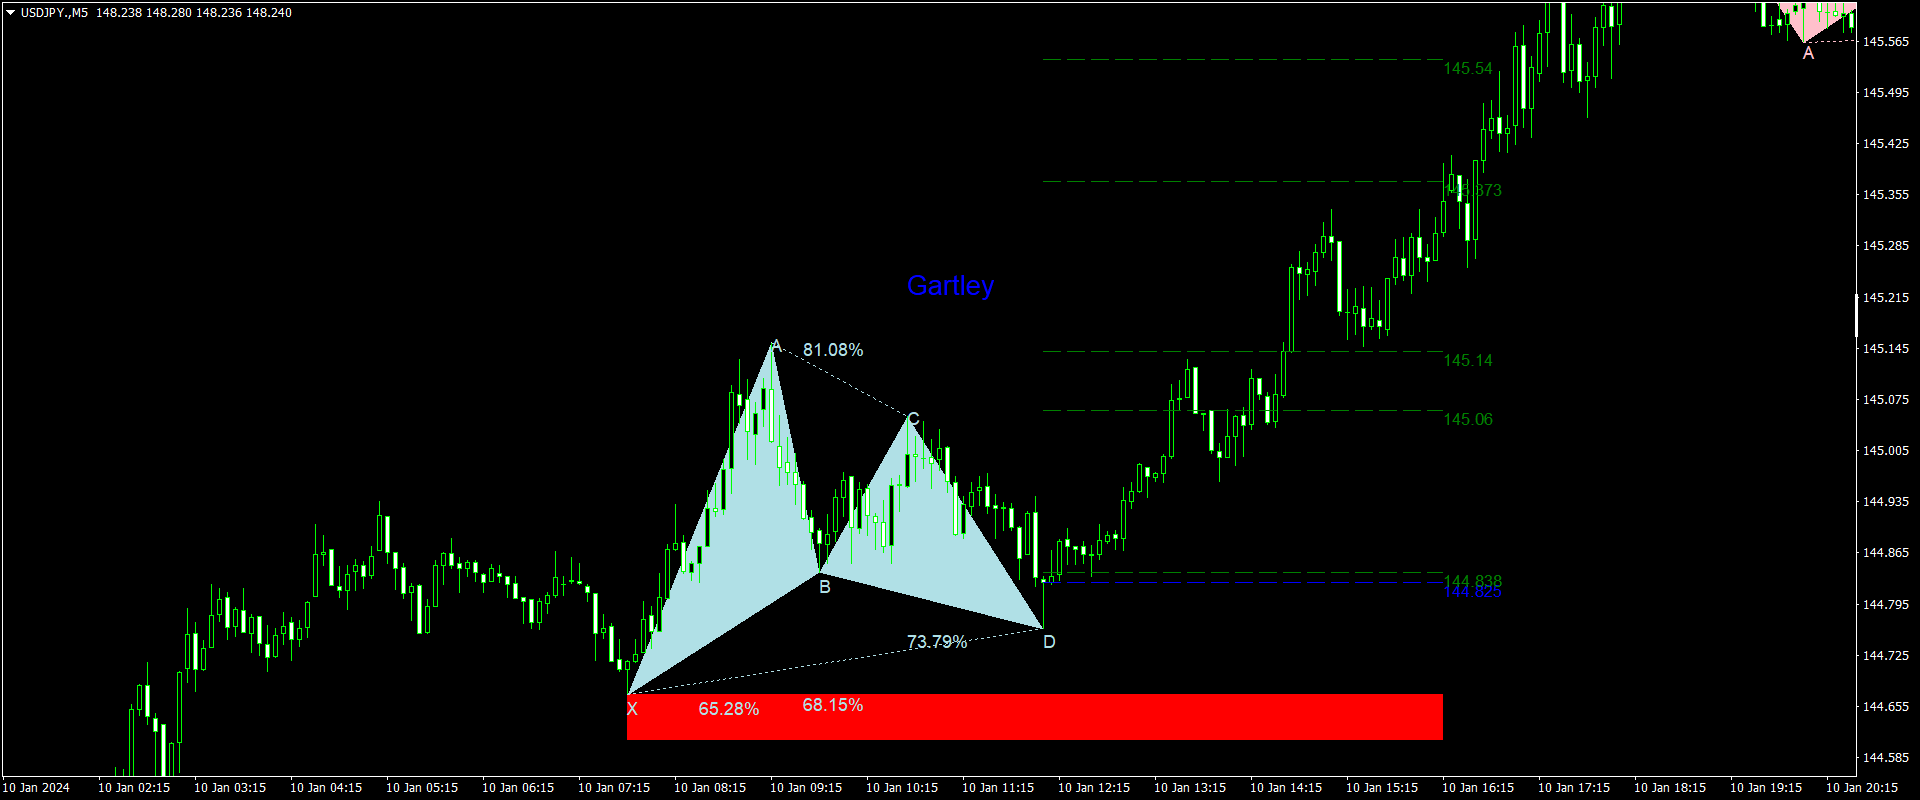
- Utiliza niveles de Fibonacci para la detección de patrones.
- Detecta patrones perfectos que pueden llegar hasta el último TP y patrones imperfectos que alcanzan al menos TP1.
PARÁMETROS DE ENTRADA:
- Los ajustes generales incluyen Profundidad, Modo de detección, Usar historial, Mostrar ratios, Mostrar etiquetas de puntos y Distancia de puntos desde el patrón.
- Los ajustes de Gartley permiten la personalización de colores alcistas y bajistas, porcentaje de desviación y opciones de visualización.
- Los ajustes de ABCD incluyen porcentaje de desviación y personalización de colores.
El usuario no ha dejado ningún comentario para su valoración