Orions Bands Suocera MT5
- インディケータ
- Umberto Boria
- バージョン: 1.9
- アクティベーション: 5
This is my trusted friend of trading.
So... I musted re-write this in MQL5 to use in brokers where there is only MT5.
The indicator is like a mother-in-law, who talks often, talks a lot and often inappropriately.
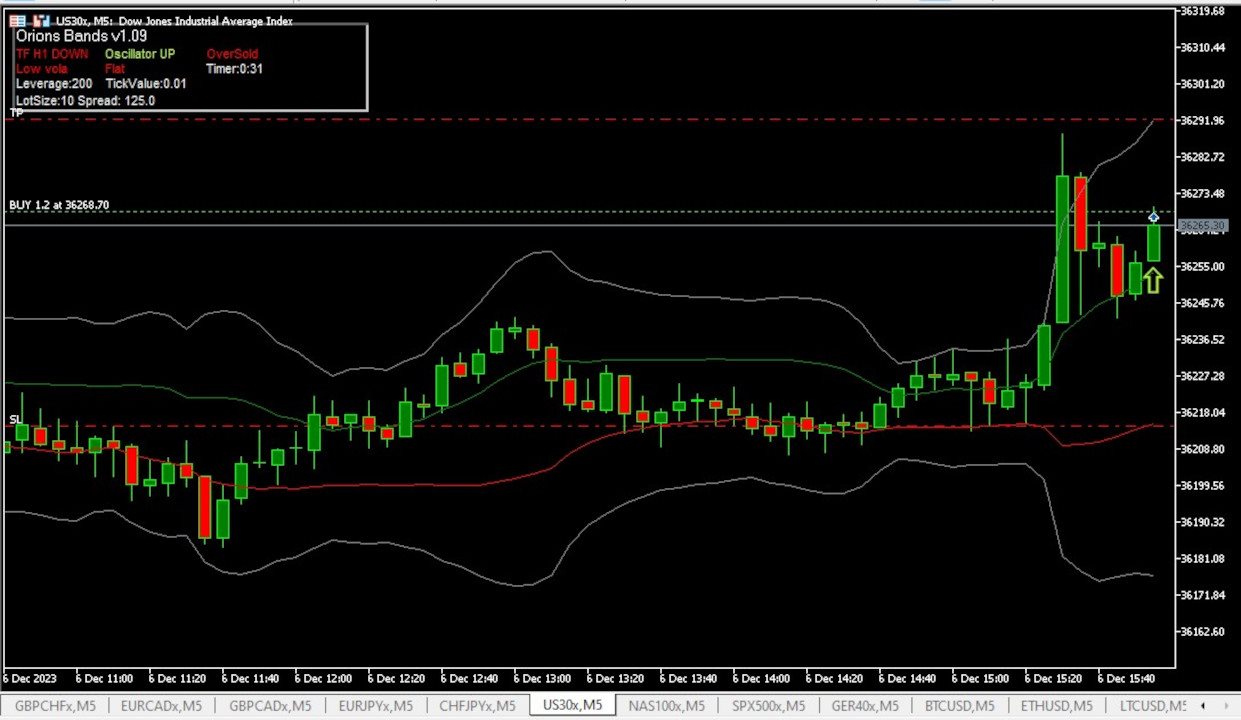
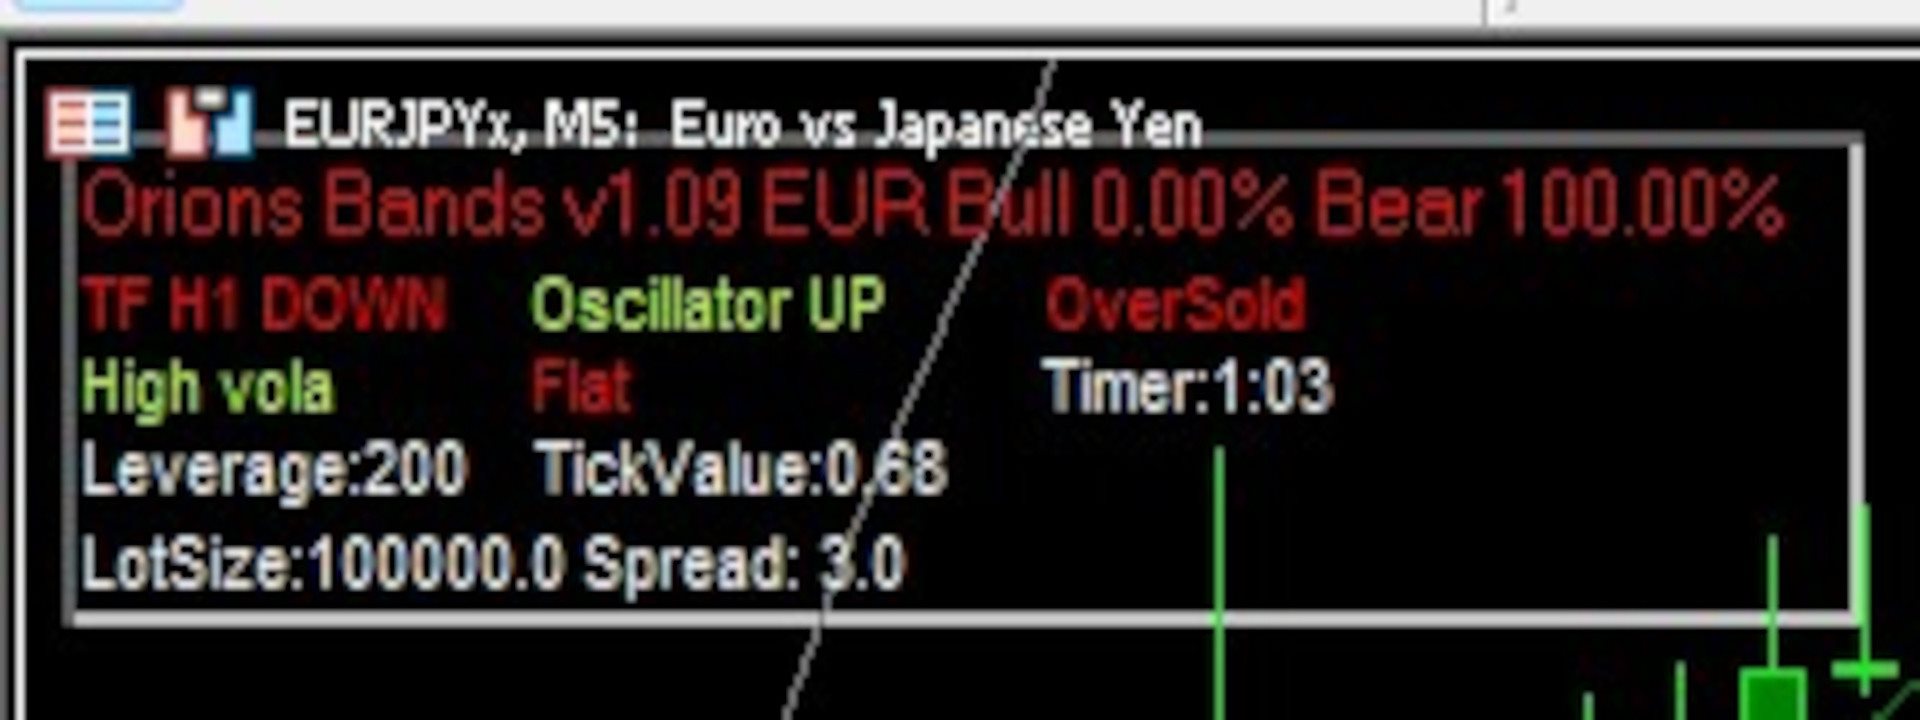
The indicator, in addition to giving us an entry signal on parameters which I will then list, monitors the trend of the hourly timeframe, OSMA to understand the entry direction, RSI to sense any overbought or oversold conditions from which to abstain, ATR for the volatility and ADX for the trend.
Indicator not recommended for newbies.
Only the human judgment of these parameters, combined with the entry signal, make the indicator truly effective.
It is recommended to use it at suitable times (9.30-11 15.30-17 20-22 GMT+2) on indices and the major Forex exchanges, on a 5-minute timeframe.
Its use is not recommended for neophytes lacking a mature and severe judgment on the signals generated.
The indicator relies on standard deviations on simple moving averages which historically constitute possible key levels to close the order in SL or TP.
The opening rests exclusively on:
- (Only for forex) Check the strength of the base currency against other exchange rates
- The price is in our favor with respect to the close of the previous candle
- the OSMA
- Max Risk in cash : maximum risk in base currency per trade
- Compare with... : For Forex only. Compare the changes in the WhatchList or on the whole platform
- Wait to close the candle : Generate the signal only at the close of the previous candle
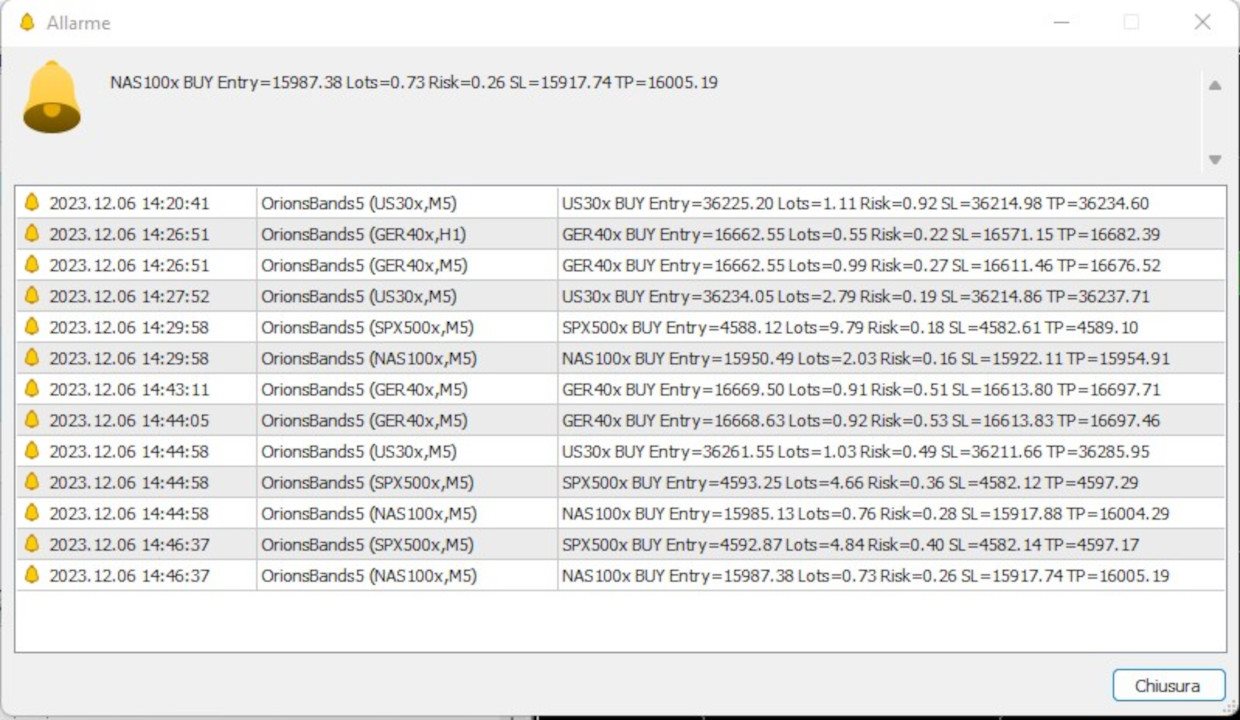
- PushNotify : Send signal also in your mobile configured device. Before Configure the device on MT5 in Options->Notifications
For the rest, it is up to the trader, thanks to the other indications at the top left, to evaluate the goodness of the signal.
Based on the risk profile per trade (in base currency), TP, SL and trade volume are suggested.