• Panoramica
  • Recensioni
  • Commenti

Orions Bands Suocera MT5

This is my trusted friend of trading.
So... I musted re-write this in MQL5 to use in brokers where there is only MT5.


The indicator is like a mother-in-law, who talks often, talks a lot and often inappropriately.
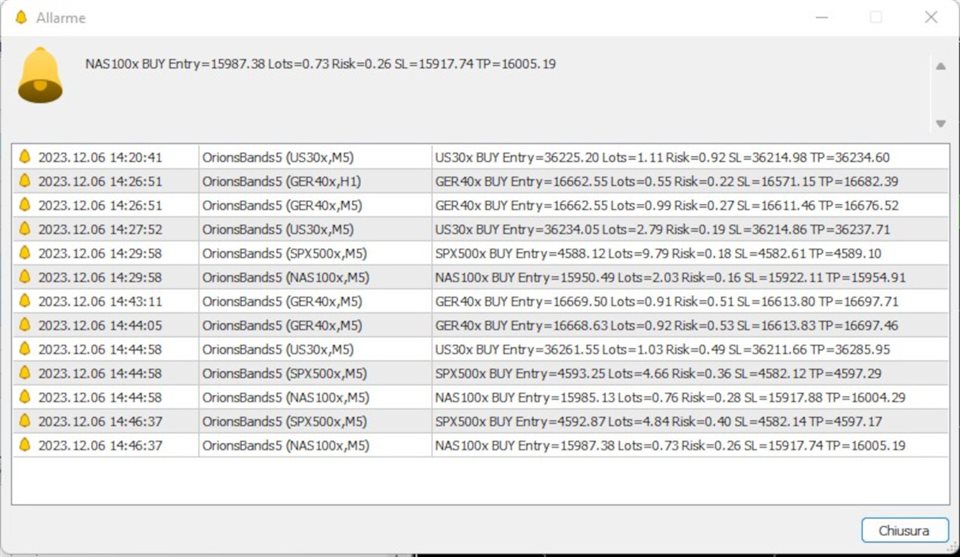
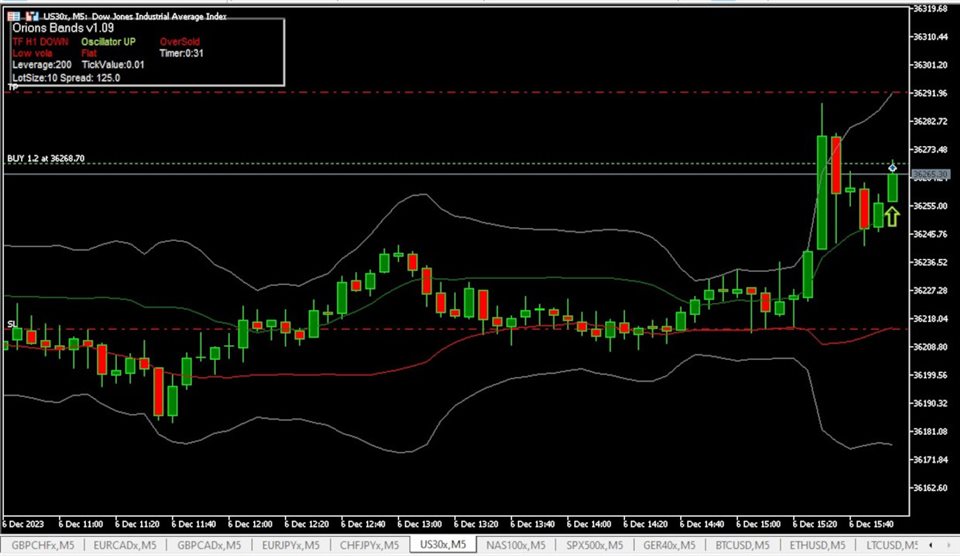
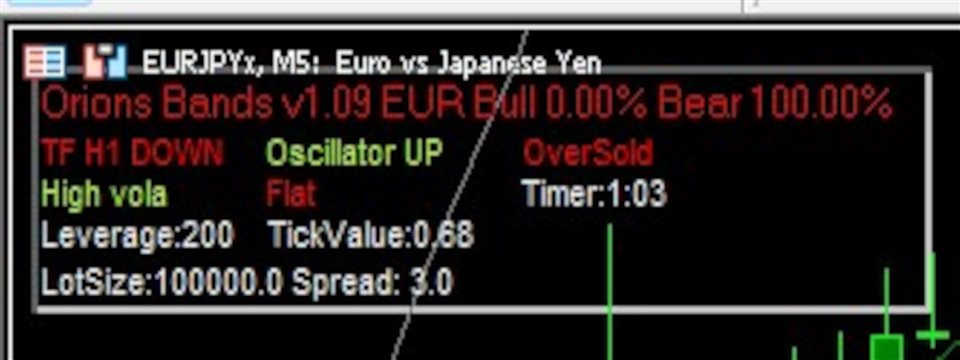
The indicator, in addition to giving us an entry signal on parameters which I will then list, monitors the trend of the hourly timeframe, OSMA to understand the entry direction, RSI to sense any overbought or oversold conditions from which to abstain, ATR for the volatility and ADX for the trend.
Indicator not recommended for newbies.
Only the human judgment of these parameters, combined with the entry signal, make the indicator truly effective.
It is recommended to use it at suitable times (9.30-11 15.30-17 20-22 GMT+2) on indices and the major Forex exchanges, on a 5-minute timeframe.
Its use is not recommended for neophytes lacking a mature and severe judgment on the signals generated.
The indicator relies on standard deviations on simple moving averages which historically constitute possible key levels to close the order in SL or TP.
The opening rests exclusively on:

  •      (Only for forex) Check the strength of the base currency against other exchange rates
  •      The price is in our favor with respect to the close of the previous candle
  •      the OSMA
The parameters are:

  •      Max Risk in cash : maximum risk in base currency per trade
  •      Compare with... : For Forex only. Compare the changes in the WhatchList or on the whole platform
  •      Wait to close the candle : Generate the signal only at the close of the previous candle
  •      PushNotify : Send signal also in your mobile configured device. Before Configure the device on MT5 in Options->Notifications

    For the rest, it is up to the trader, thanks to the other indications at the top left, to evaluate the goodness of the signal.
    Based on the risk profile per trade (in base currency), TP, SL and trade volume are suggested.



    Prodotti consigliati
    Introduction to X3 Chart Pattern Scanner X3 Cherart Pattern Scanner is the non-repainting and non-lagging indicator detecting X3 chart patterns including Harmonic pattern, Elliott Wave pattern, X3 patterns, and Japanese Candlestick patterns. Historical patterns match with signal patterns. Hence, you can readily develop the solid trading strategy in your chart. More importantly, this superb pattern scanner can detect the optimal pattern of its kind. In addition, you can switch on and off individu
    Elliott Wave Trend was designed for the scientific wave counting. This tool focuses to get rid of the vagueness of the classic Elliott Wave Counting using the guideline from the template and pattern approach. In doing so, firstly Elliott Wave Trend offers the template for your wave counting. Secondly, it offers Wave Structural Score to assist to identify accurate wave formation. It offers both impulse wave Structural Score and corrective wave Structure Score. Structural Score is the rating to sh
    Pendora 100
    Ayanda Mhlauli
    Synthetic indices are defined artificial financial instruments that were created to mimic real-world market movements in different markets based on a random number generator that is secured through cryptography. This mechanism is used to prevent market manipulation and improve financial transparency. Background About EA The Pandora is the is the first EA of The Alpha Phoenix Academy. This is version 2 of the Pandora 100x The Pandora 100x only trades the Volatility 100 index. In my understandin
    TrendMaestro5
    Stefano Frisetti
    nota: questo indicatore e' per METATRADER5, se vuoi la versione per  METATRADER4 questo e' il link:   https://www.mql5.com/it/market/product/108106 TRENDMAESTRO ver 2.4 TRENDMAESTRO   riconosce un nuovo TREND sul nascere, non sbaglia mai. La sicurezza di identificare un nuovo TREND non ha prezzo. DESCRIZIONE TRENDMAESTRO identifica un nuovo TREND sul nascere, questo indicatore prende in esame la volatilita' i volumi ed il momentum per identificare il momento in cui c'e' un'esplosione di uno
    Looking for reliable levels on a price chart? Already tired of searching for similar indicators? Are the levels not working out as they should? Then this is the indicator for you. Volume Prices Universal is a reliable indicator of horizontal volumes. What does it show? First of all, the main idea of ​​the indicator is to display at which price mark the price has been for the longest time. Thus, the display of price volumes on the price chart is formed. With the help of which you can very simp
    The indicator detects divergence signals - the divergences between the price peaks and the MACD oscillator values. The signals are displayed as arrows in the additional window and are maintained by the messages in a pop-up window, e-mails and push-notifications. The conditions which formed the signal are displayed by lines on the chart and in the indicator window. The indicator parameters MacdFast - fast MACD line period MacdSlow - slow MACD line period MacdSignal - MACD signal line period Mac
    The MACD Expert Advisor  uses the Moving Average  Convergence/Divergence indicator to determine the market trend. It uses the MACD signal to place its entries automatically. The EA also uses the moving average indicator for additional confirmation. Various settings enable the EA to be optimized for different market conditions and trend following strategies. This program can also trade on specific trading sessions to capitalize on the increase of trading volume on certain times of the day. It ca
    Unlock hidden profits: accurate divergence trading for all markets Special Offer: Purchase now to receive free bonuses worth $90! (Read more for details) Tricky to find and scarce in frequency, divergences are one of the most reliable trading scenarios. This indicator finds and scans for regular and hidden divergences automatically using your favourite oscillator. [ Installation Guide | Update Guide | Troubleshooting | FAQ | All Products ] Easy to trade Finds regular and hidden divergences S
    MT5 Drawdown Tracker – Track Your EA’s Performance with Precision! Take your trading analysis to the next level with our MT5 indicator designed to monitor, record, and report the drawdown of any Expert Advisor. Whether you’re fine-tuning your strategies or optimizing risk management, this tool gives you the insights you need. Key Features: Effortless Tracking: Automatically monitors the drawdown levels of your EAs with precision. Comprehensive Data Storage: Accurately logs each drawdown event,
    Trend Direction ADX indicator Trend Direction ADX is part of a serie of indicators used to characterize market conditions. Almost any strategy only work under certain market conditions. Therefore it is important to be able to characterize market conditions at any time: trend direction, trend strength, volatility, etc.. Trend Direction ADX is an indicator to be used to characterize trend direction: trending up trending down ranging Trend Direction ADX is based on ADX standard indicator.
    Smooth price for Monarch
    Konstantin Gruzdev
    5 (1)
    The Smooth Price technical indicator is used for plotting a smoothed line as close to the price of the financial instrument as possible, and serves to eliminate its noise components. The indicator is part of the Monarch trading system, but here it is presented as an independent technical analysis tool. The indicator is based on the cluster digital filter , which, unlike the ClusterSMA , is applied directly to the price time series. Smooth Price does not redraw (except the very last, zero bar) an
    Outside Day Reversal EA
    Munkh Od Jargalsaikhan
    Outside day trading strategy looks for a specific pattern in the price chart of a security. The pattern is characterized by a larger range than the previous day, with the high of the day higher than the previous day's high and the low of the day lower than the previous day's low. Works with many symbols, such as BTCUSD, GBPUSD,USDCAD, oil, gas, and others. PLEASE RATE! Thank you very much! FEATURES: - Real Strategy - Daily Bar Strategy - Exit the trade if the day was profitable - ATR multip
    FREE
    ATrend
    Zaha Feiz
    4.88 (8)
    "ATREND: Come funziona e come utilizzarlo" ### Come funziona L'indicatore "ATREND" per la piattaforma MT5 è progettato per fornire ai trader robusti segnali di acquisto e vendita utilizzando una combinazione di metodologie di analisi tecnica. Questo indicatore sfrutta principalmente l'Average True Range (ATR) per la misurazione della volatilità, insieme ad algoritmi di individuazione dei trend per identificare potenziali movimenti di mercato. Lascia un messaggio dopo l'acquisto e ricevi un rega
    Beauty Trend
    Nikolay Kositsin
    Простой индикатор тренда в NRTR виде с отрисовкой линий стоплосса и тейпрофита, цвет и направление движения которых определяются действующим трендом. Индикатор имеет возможность подавать алерты, отправлять почтовые сообщения и push-сигналы при смене направления тренда. Следует учесть что значение входного параметра индикатора Deviation of the take profit line in points для каждого финансового актива на каждом таймфрейме   необходимо подбирать индивидуально!
    FX Infinity
    Shazdeh Taghi Mahmoudi
    1 (1)
    FX Infinity Il prezzo attuale è offerto con uno sconto speciale del 30% per i fortunati acquirenti di prima volta, disponibile solo per un periodo limitato. Benvenuti in un nuovo mondo di profitti eccellenti con uno sforzo minimo nel mercato Forex. Link per MT4 :  https://www.mql5.com/en/market/product/125594 I nostri vantaggi sono: Molto adatto per superare le sfide delle prop ( Prop Firm Challenges ). Ultima versione dell'EA. Copre le coppie GBP . Adatto a qualsiasi capitale, anche
    Matreshka
    Dimitr Trifonov
    5 (2)
    Matreshka self-testing and self-optimizing indicator: 1. Is an interpretation of the Elliott Wave Analysis Theory. 2. Based on the principle of the indicator type ZigZag, and the waves are based on the principle of interpretation of the theory of DeMark. 3. Filters waves in length and height. 4. Draws up to six levels of ZigZag at the same time, tracking waves of different orders. 5. Marks Pulsed and Recoil Waves. 6. Draws arrows to open positions 7. Draws three channels. 8. Notes support and re
    Introduction Excessive Momentum Indicator is the momentum indicator to measure the excessive momentum directly from raw price series. Hence, this is an extended price action and pattern trading. Excessive Momentum Indicator was originally developed by Young Ho Seo. This indicator demonstrates the concept of Equilibrium Fractal Wave and Practical Application at the same time. Excessive Momentum detects the market anomaly. Excessive momentum will give us a lot of clue about potential reversal and
    BubbleBlue
    Joan Chepkoech
    Bubble blue is candlestick pattern trading bot that utilizes algorithm that mimics existing candle patterns (such as Doji, Hammer, Morning star, Evening star, Hanging man, among others) together with preset conditions to enter a trade. The bot is fairly flexible and requires a basic understanding of candlestick patterns. Nevertheless, simple optimized default inputs with one condition have been made for GBPUSD.
    Gartley Projections D
    Oleksandr Medviediev
    3 (2)
    The indicator identifies the harmonic patterns (XABCD) according to developments of H.M.Gartley ( "Profits in the Stock Market" , 1935г). It projects D-point as a point in the perspective projection (specify ProjectionD_Mode = true in the settings). Does not redraw. When a bar of the working timeframe closes, if the identified pattern point has not moved during Patterns_Fractal_Bars bars, an arrow appears on the chart (in the direction of the expected price movement). From this moment on, the ar
    Fara
    Vladimir Emelianov
    The   Fara   Expert Advisor with a drawdown of 6% for 3 years shows itself best on the   EUR/USD H1  pair. It uses only three indicators  "Moving Average", "Bollinger Bands"  and  "Top Bottom Price" . Each trade is protected by a Stop Loss and Take Profit. In the parameters of the Expert Advisor, you can change the lot size, as well as the values of indicators, Stop Loss and Take Profit, if necessary. Below is the testing statistics for 3 years. Other product:   https://www.mql5.com/ru/users/rev
    Owl Smart Levels MT5
    Sergey Ermolov
    4.07 (28)
    Versione MT4  |  FAQ L' indicatore Owl Smart Levels è un sistema di trading completo all'interno dell'unico indicatore che include strumenti di analisi di mercato popolari come i frattali avanzati di Bill Williams , Valable ZigZag che costruisce la corretta struttura a onde del mercato, e i livelli di Fibonacci che segnano i livelli esatti di entrata nel mercato e luoghi per prendere profitti. Descrizione dettagliata della strategia Istruzioni per lavorare con l'indicatore Consulente-assistente
    ATR Line
    Evgeny Levchenko
    The indicator - "ATR Line" determines the current trend and gives signals to buy (green arrow to the top) or sell (red arrow to the bottom). The indicator calculation is based on the deviation of the average price of the instrument from its average true range - ATR. The moving average of prices is used to reduce "market noise". If the main line of the indicator - "ATR Line" is lower the instrument price chart, then the market is in a "bullish" trend. If the main line of the indicator is higher t
    Dragon Signal
    Ignacio Agustin Mene Franco
    Pack Dragon , Indicator 3/1, Dragon signal It has the strategy of an oscillator programmed to grab supports and resistances to take advantage of every candle in the market, and it gives you to take your time and a simple analysis it is simple where you mark the green dots at the bottom gives you input for long And when it does not mark anything, it is giving you a short warning! works for all seasons for forex markets and synthetic indices !
    Dragon Machine
    Ignacio Agustin Mene Franco
    Pack Dragon. indicator 3/3 Dragon machine, has the perfected support and resistance strategy, indicates the floors and ceilings with the naked eye can be seen, giving signal to each circle pink giving entry to the rise and the green circle gives entry to the low wing, where the support of the green and red lines helps. Works for synthetic indices and forex all pairs, ideal for operating crash and boom. !
    We have turned one application of the RSI indicator into a separate indicator, represented by red and green bars, which is incredibly simple and effective. By simply inputting the parameters for the RSI, you can obtain the RSI indicator represented by red and green bars. The application of the RSI indicator has been expanded into a powerful new indicator, visually presented through red and green bars, undoubtedly an innovative move in the field of financial technical analysis. The design of t
    Win43 Scalper
    Eadvisors Software Inc.
    O novo s43 Scalper para Mini-Índice (WIN-IND) faz operações de curto prazo no timeframe 1min buscando pequenas variações do mercado, utiliza nova tecnologia de trade, os resultados no intraday são íncríveis, confira:      Após a instalação adicione no gráfico dos instrumentos win para visualizar os resultados no backteste. Recomendamos o timeframe de 1min.
    All about time and price by ICT. This indicator provides a comprehensive view of ICT killzones, Silver Bullet times, and ICT Macros, enhancing your trading experience.  In those time windows price either seeks liquidity or imbalances and you often find the most energetic price moves and turning points. Features: Automatic Adaptation: The ICT killzones intelligently adapt to the specific chart you are using. For Forex charts, it follows the ICT Forex times: In EST timezone: Session: Asia: 20h00-0
    Smart Fractals Indicator - Un Fractal Potenziato per il Tuo Trading su MT5 Lo Smart Fractals è l'evoluzione dell'indicatore Fractal classico che conosci e utilizzi nei tuoi grafici. Progettato specificamente per MetaTrader 5, questo indicatore non si limita a identificare i classici punti di inversione sul mercato, ma va oltre, rendendo il tuo trading più efficiente e redditizio. Abbiamo preso il concetto di base dei frattali e l'abbiamo trasformato in uno strumento più intelligente e funziona
    Chanlun
    Xiaonong Yu
    The ChanLun or Chan theory is one of the most popular trading theories in China. But it seems like that it has little influence in western countries. Actually, the Chan Theory is based on a sophisticated mathematical model. The basic idea ChanLun is to simplify the bar chart by its model. With the help of ChanLun, a trader can analyze and predict the trend of future goods, stocks. In ChanLun, there are several basic elements called fractals, strokes, line segments and pivots . A trader should p
    The Penta-O is a 6-point retracement harmonacci pattern which usually precedes big market movements. Penta-O patterns can expand and repaint quite a bit. To make things easier this indicator implements a twist: it waits for a donchian breakout in the right direction before signaling the trade. The end result is an otherwise repainting indicator with a very reliable trading signal. The donchian breakout period is entered as an input. [ Installation Guide | Update Guide | Troubleshooting | FAQ | A
    Gli utenti di questo prodotto hanno anche acquistato
    TPSpro RFI Levels MT5
    Roman Podpora
    5 (13)
    ISTRUZIONI       RUS   -   INGLESE       Si   consiglia di utilizzare con un indicatore       -       TPSpro   TENDENZA PRO -   Versione MT4         Un elemento chiave nel trading sono le zone o i livelli da cui vengono prese le decisioni di acquisto o vendita di uno strumento di trading. Nonostante i tentativi dei principali attori di nascondere la loro presenza sul mercato, lasciano inevitabilmente delle tracce. Il nostro compito era imparare a identificare queste tracce e interpretarle corre
    IVISTscalp5
    Vadym Zhukovskyi
    5 (6)
    What's new about iVISTscalp5 forecast indicator (Version 10)? iVISTscalp5 is a unique nonlinear forecasting for a week ahead system for any financial instrument which executes fast scalping using time levels. iVISTscalp5 is a tool for easy study and understanding of financial market. 1) iVISTscalp5 forecast indicator has been completely rewritten into another programming language (C++), which has accelerated data loading and processing. As a result, a different graphical display of forecast
    AT Forex Indicator MT5
    Marzena Maria Szmit
    5 (5)
    The AT Forex Indicator MT5 is a sophisticated trading tool designed to provide traders with a comprehensive analysis of multiple currency pairs. This powerful indicator simplifies the complex nature of the forex market, making it accessible for both novice and experienced traders. AT Forex Indicator uses advanced algorithms to detect trends, patterns and is an essential tool for traders aiming to enhance their forex trading performance. With its robust features, ease of use, and reliable signal
    Ora $ 147 (aumentando a $ 499 dopo alcuni aggiornamenti) - account illimitati (PC o MAC) Manuale utente di RelicusRoad + Video di formazione + Accesso al gruppo Discord privato + Stato VIP UN NUOVO MODO DI GUARDARE IL MERCATO RelicusRoad è l'indicatore di trading più potente al mondo per forex, futures, criptovalute, azioni e indici, fornendo ai trader tutte le informazioni e gli strumenti di cui hanno bisogno per rimanere redditizi. Forniamo analisi tecniche e piani di trading per aiutar
    Fibonacci retracement is a method of technical analysis for determining support and resistance levels. The TSO Fibonacci Chains Indicator is different from a simple Fibonacci Retracements indicator in that it provides the targets for each retracement level. In other words, there is an Extension Level (D) for every Retracement Level (C). In addition, if an Extension Level is reached, then a new Fibonacci setup is created automatically. These consecutive Fibonacci setups create a chain that reveal
    Volume by Price MT5
    Brian Collard
    3.25 (4)
    The Volume by Price Indicator for MetaTrader 5 features Volume Profile and Market Profile TPO (Time Price Opportunity). Volume and TPO histogram bar and line charts. Volume Footprint charts. TPO letter and block marker collapsed and split structure charts. Static, dynamic and flexible range segmentation and compositing methods with relative and absolute visualizations. Session hours filtering and segment concatenation with Market Watch and custom user specifications. Graphical layering, positio
    Happy entries
    Godwill Fortune Otieno Juma
    The  product gives optimized entries for 3min ,1 hr and day timeframes  Does well with indices  ASIAN- HK50 AND CHINA A50 USA-US30,US100,US500 GER40 ,UK100 For stocks trade with the day timeframes Happy Entry employs advanced algorithms and real-time data analysis to identify optimal entry points with unprecedented accuracy. Its adaptive nature allows it to seamlessly adjust to changing market conditions, ensuring you never miss out on profitable opportunities. Whether you're a beginner or sea
    This indicator belongs to the family of channel indicators. These channel indicator was created based on the principle that the market will always trade in a swinging like pattern. The swinging like pattern is caused by the existence of both the bulls and bears in a market. This causes a market to trade in a dynamic channel. it is designed to help the buyer to identify the levels at which the bulls are buying and the bear are selling. The bulls are buying when the Market is cheap and the bears a
    The indicator is designed to close positions on the market in time. For example: to take profits ahead of schedule if the price has not reached TakeProfit, and the market is turning around. The indicator analyzes the momentum, not the trend. He does not give any information about the trend. The indicator is well suited for finding divergence. The Ershov 38 Parrots indicator dynamically adjusts to the market and detects price movement impulses of medium and high amplitude. It almost does not rea
    FxaccurateLS
    Shiv Raj Kumawat
    WHY IS OUR FXACCCURATE LS MT5 THE PROFITABLE ? PROTECT YOUR CAPITAL WITH RISK MANAGEMENT Gives entry, stop and target levels from time to time. It finds Trading opportunities by analyzing what the price is doing during established trends. POWERFUL INDICATOR FOR A RELIABLE STRATEGIES We have made these indicators with a lot of years of hard work. It is made at a very advanced level. Established trends provide dozens of trading opportunities, but most trend indicators completely ignore them!
    MetaForecast M5
    Vahidreza Heidar Gholami
    5 (2)
    MetaForecast predice e visualizza il futuro di qualsiasi mercato basandosi sull'armonia dei dati dei prezzi. Sebbene il mercato non sia sempre prevedibile, se esiste un modello nei prezzi, MetaForecast può prevedere il futuro con la massima precisione possibile. Rispetto ad altri prodotti simili, MetaForecast può generare risultati più accurati analizzando le tendenze di mercato. Parametri di input Past size (Dimensione passata) Specifica il numero di barre che MetaForecast utilizza per creare
    L'indicatore Quadrato di Gann è uno strumento potente di analisi di mercato basato sull'articolo "Formula Matematica per le Previsioni di Mercato" scritto da W.D. Gann. Questo strumento utilizza concetti matematici e teorie di Gann per effettuare un'analisi precisa del mercato. Utilizza i quadrati di 144, 90, 52 e anche il quadrato di 9. Inoltre, integra il metodo del  per il quadrato di 9 e la sua relazione con canali e modelli stellari di quel quadrato. Manuale Utente e Applicazione: Prima di
    Piranha version 2
    Maria Strudov
    5 (1)
    "Piranha" - an autonomous trading system that determines overbought and oversold levels on the chart. Red and blue zones represent overbought and oversold levels respectively. Entry points are marked with arrows: a downward arrow in the red zone for "sell" and an upward arrow in the blue zone for "buy". The Take profit level is indicated by the green moving average. Key features: Adjusting the Take profit level as the green moving average changes position. Averaging ability when a new market e
    SMCpro
    Arief
    5 (2)
    Currently Price  20% OFF  ( for unlimited use ) Indicator   USER MANUAL , trade setups, solving issues, etc :  Direct Download Here     (  for users only  ) Hello World! Introducing.. SMCpro tool and Indicator for  MetaTrader 5 , a cutting-edge feature designed to revolutionize your trading experience. With innovative ICT Smart Money Concept, you gain unparalleled insight into market dynamics, empowering you to make informed trading decisions like never before. SMC Indicator built on th
    How to use Pair Trading Station Pair Trading Station is recommended for H1 time frame and you can use it for any currency pairs. To generate buy and sell signal, follow few steps below to apply Pair Trading Station to your MetaTrader terminal. When you load Pair Trading Station on your chart, Pair Trading station will assess available historical data in your MetaTrader platforms for each currency pair. On your chart, the amount of historical data available will be displayed for each currency pai
    Carnaval mt5
    Petro Lytvynov
    This is an indicator that includes the best basic forex indicators, without redrawing. Based on this data, a sell or buy signal is generated. It does not disappear anywhere after the signal, which gives us the opportunity to see the results on the history. It can be used on any currency pair, crypto, metals, stocks It is best used on an hourly chart, but other periods are also acceptable. The best results for the period H1,H4,daily If customers have any questions, I will answer them and
    Fxaccurate TCT
    Shiv Raj Kumawat
    WHY IS OUR FXACCCURATE TCT MT5 THE PROFITABLE ? Gives entry, stop and target levels from time to time. It finds Trading opportunities by analyzing what the price is doing during established trends. We have made these indicators with a lot of years of hard work. It is made at a very advanced level. Established trends provide dozens of trading opportunities, but most trend indicators completely ignore them! The trend reveals trading indicator represents an average of 10 different trades per trend
    Price Action Scanner Pro is an indicator that identifies price behaviors and provides alerts, offering more features and customization compared to Price Action Scanner. This indicator can simultaneously detect signals for up to 15 symbols across different timeframes. You can configure it to detect signals during specific trading sessions such as Asian, European, and US sessions, using different timeframes. This allows you to use lower timeframes for active trading periods and higher timeframes
    GannRS Trend Scalper   GannRS is an advanced trading tool based on Gann Law and Supports and Resistances. designed to have an   active trading at any time not lagging Indications are given at the beginning of a new candle Please watch the full tutorial video. How to use GannRS Very easy to set up... Put it on your chart Adjust inputs Inputs Show Resistance and support : [bool]  true = Shows R/S on chart false = does not show Show Levels :[bool]  true = Shows levels on the chart false = doe
    The iChannels
    BeeXXI Corporation
    5 (2)
    Ultra-fast recognition of parabolic channels (as well as linear, horizontal and wavy channels) throughout the depth of history, creating a hierarchy of channels. Required setting: Max bars in chart: Unlimited This indicator is designed primarily for algorithmic trading, but can also be used for manual trading.  This indicator will have a very active evolution in the near future and detailed descriptions on how to apply to create robots
    BookMap HeatMap
    Roberto Spadim
    1 (2)
    This Indicator creates a heatmap based on depth of market of the current symbol or another symbol. Other symbol is useful when you trade futures market and a contract has 'mini' and 'full' split. For example, in Brazil (B3 - BMF&Bovespa), WDO and DOL are future Forex contract of BRL/USD (where 1 DOL = 5 WDO) and big banks work mostly with DOL (where liquidity is important). Please use with M1 timeframe , objects are too small to be displayed at higher timeframes (MT5 limit). The number of level
    VIP Buy Sell Signals
    Hapu Arachchilage Tharindu Lakmal
    Here is a Live DEMO testing account for the indicator. ( Profit proofs ) Login (MT5) - 100246 Server - FusionMarkets-Demo Investor PW - VIPindicator@2024 Contact me through this email aaddress to download the FREE strategy PDF for this indicator tharindu999lakmal@gmail.com Introduction   The   "Buy Sell Signals"   is designed to provide BUY and SELL trade signals based on the current market conditions.   A   Profitable   Trading Strategy   (Chee sheet)   is provided for this trading indicato
    Introducing the POWER TRADE indicator created by a small group of traders with a few years trading trading the financial market profitably . This is a plug and play indicator that provides you with  POWERFUL Entry signals with Profit Taking and rebound zones. The indicator Works with all MT5 trading instruments. The indicator uses previous  chart data as receipt to speculate on future market moves.
    Noize Absorption Index - is the manual trading system that measures the difference of pressure between bears forces and bulls forces. Green line - is a noize free index that showing curent situation. Zero value of index shows totally choppy/flat market.Values above zero level shows how powerfull bullish wave is and values below zero measures bearish forces.Up arrow appears on bearish market when it's ready to reverse, dn arrow appears on weak bullish market, as a result of reverse expectation.
    The   Viking Strategy Signal Indicator   is a trading tool designed to assist traders by providing reliable entry signals without the issues of repainting or lag. Developed over four years of experience and various methodologies (including SMC, SnD, HLZ, ICT, and WICKOFF), this indicator is particularly beneficial for those who lack the time to analyze charts and wait for confirmations before executing trades. Key Functions: Market Structure Detection : Identifies and draws market structure (hig
    Elliot Waves Analyzer Pro
    Viktor Weidenthal
    2.67 (3)
    Elliot Waves Analyzer Pro calculates Elliot Waves to Help Identify Trend direction and Entry Levels. Mainly for Swing Trading Strategies. Usually one would open a Position in trend direction for Wave 3 or a Correction for Wave C . This Indicator draws Target Levels for the current and next wave. Most important Rules for Elliot Wave Analysis are verified by the Indicator.  The Pro version analyzes Multiple Timeframes and shows the Subwaves and Target-Levels.   For an Overview  " Elliot Waves Anal
    Go Way TREND
    Ywsf Hsyn Hmad Alrsh
    Segui la tendenza. Sì, attendi il segnale di ingresso, sia di acquisto che di vendita, su un frame di 15 minuti e controlla il segnale se appare su un frame di 30 minuti (a volte ci vuole un'ora o più prima che il segnale appaia. Puoi tornare al frame di 15 minuti e torna al frame di 30 minuti, e ripeti l'operazione finché non appare il segnale principale. Se il segnale appare sul frame di 30 minuti, entra con il prezzo e il profitto viene preso quando la linea di disegno cambia , viene registr
    Boom and Crash Trend Detector is a  Non-Repaint   MT5 trading system usually being sold for 50 0$ . Most people use this for Deriv but can be used to forex too. The boom and crash spike indicator is a spike detecting software, with Multiple features, these features include. Spike Alert ( from 10 to 100-second warning before spike) Continues spike Alert (for double or continuous spikes at a time) supports all Boom/crash Indices M6 time frame works best here . Bigger time frame trend pointer f
    QUESTO INDICATORE, BASATO SULL'INTELLIGENZA ARTIFICIALE, individua i possibili punti di inversione del mercato attraverso la lettura del footprint, e segnala IN ANTICIPO dei piccoli movimenti del mercato prima che questi avvengano. A differenza degli indicatori di prezzo e di volume, che generano gli ingressi "in ritardo" ovvero quando è già avvenuta una conferma nel prezzo o del volume su un cambio di direzione, e quindi spesso il movimento si è già esaurito, questo indicatore segnala, in base
    Satoro mt5
    Mykhailo Lozhkin
    5 (1)
    An indicator based on time-tested trading methods that gives a signal that the market is overbought or oversold in a certain period of time The indicator does not disappear when it appears, easy to use Suitable for any trade It can be used on any currency pair or crypto He performed best in the period H1,H4,daily After the purchase, you will also receive a seller's template with settings The seller uses it more for trading on cryptocurrency After the purchase, I also keep in touch
    Altri dall’autore
    You have good intuitions, but you want more from your trade ... or you are a tireless hedger . Would it be very useful for you if the TP moves further and further with configurable response times and offsets price ? Imagine: You have a buy order on a bullish day on Dow Jones. You set a "take profit" at 200 points, but you know he can give you more! Attach "Orions Move Target" to any chart and it will pass all the open orders in the terminal, moving them following these 3 trivial parameters:
    FREE
    Solo un indicatore per individuare grande volatilità : Williams Percent. E' stato pensato per l'oro su timeframe 5 minuti, ma può essere utilizzato anche sugli indici con differenti timeframe. Tale Expert Advisor, ancora in fase di sviluppo, intercetta la grande volatilità, aiutando il trader nell'aprire posizioni. In seguito l'intervento umano sarà necessario per la chiusura che deve essere veloce quanto il movimento stesso, oppure lasciare andare con timeframe più elevati. Ad aiutare il tr
    FREE
    Orions WPR
    Umberto Boria
    06/30/23 v1.1 New features. Read before operate. Remarkable configurations: 1) "No close order", "Auto-Hedging" FALSE, "Close all" FALSE : You can transform this EA in a assistant that simply open orders. After you will be the mind of the operativity. Warning : find a good setting of "Pause in minute" and "Max alert" to delay the operativity and filter the wrong signals. These last parameters can change by market condition and asset. 2) "Breakeven and WPR inversion", "Auto-Hedging" FALSE, "C
    FREE
    Sei un testardo e non vuoi chiudere una situazione disastrosa del tuo conto? I tuoi robot hanno fatto un disastro nel tuo account? Nessun problema: c'è Mr. Hedging a risolvere la situazione! L'expert advisor legge ad ogni tick il drawdown reale e, qualora si superi la soglia impostata, partendo dal primo ordine perdente della lista del terminale, lo mette in copertura aprendo un ordine di verso opposto e volume multiplo come da parametro assegnato. E' possibile anche impostare SL e TP
    Un metodo semplice e automatico per vincere nel forex. Se non prendi la direzione giusta, l'algoritmo creerà una gabbia (o tunnel di 10 pips) in cui rilanciare continuamente in verso contrario affinché nel globale l'operazione si concluda in attivo. Puoi usare un filtro sugli orari ed avere la certezza di una liquidità sufficiente per il rilancio sia all'avvio che durante l'operatività. Per aprire la prima operazione è necessario avere una buona volatilità controllata con l'indicatore ATR e R
    L'indicatore è come una suocera, che parla spesso, parla tanto e spesso a sproposito. L'indicatore, oltre a darci un segnale di entrata su parametri che poi vi elenco, monitora l'andamento del timeframe orario, OSMA per capire il verso di entrata, RSI per intuire eventuali condizioni di ipercomprato o ipervenduto da cui astenersi, ATR per la volatilità e ADX per il trend. Indicatore non consigliato per neofiti. Solo il giudizio umano di questi parametri, congiunto con il segnale di entrata,
    Filtro:
    Nessuna recensione
    Rispondi alla recensione