Gold Trend 5
- インディケータ
- Sergei Linskii
- バージョン: 1.5
- アップデート済み: 26 11月 2023
- アクティベーション: 5
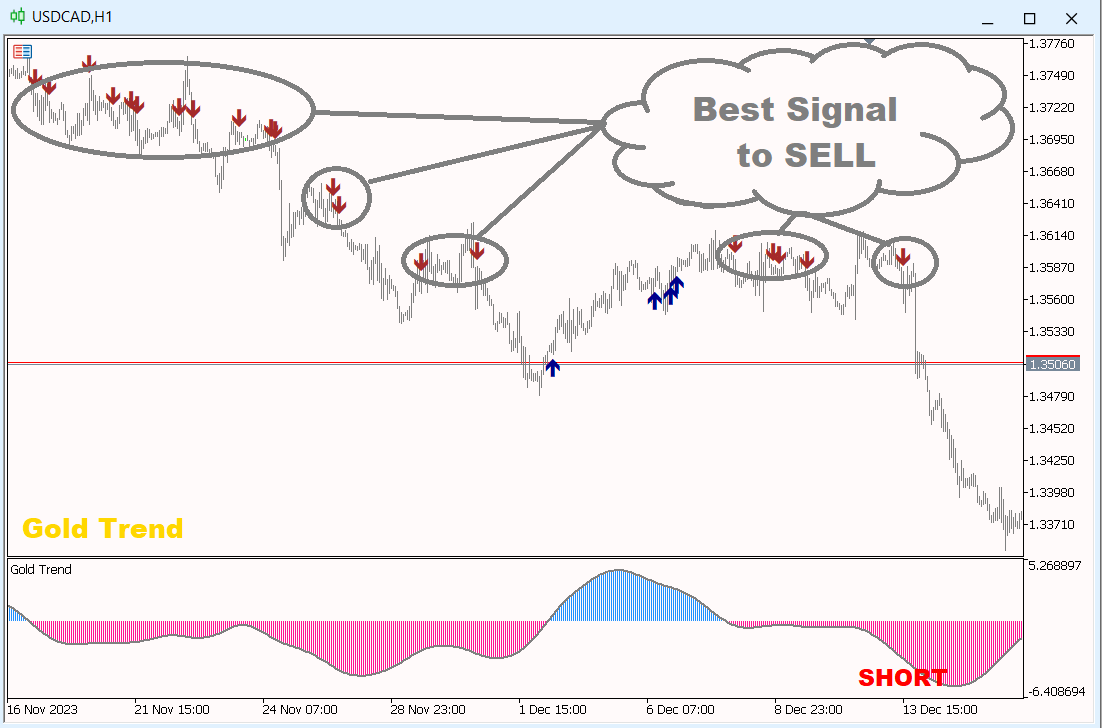
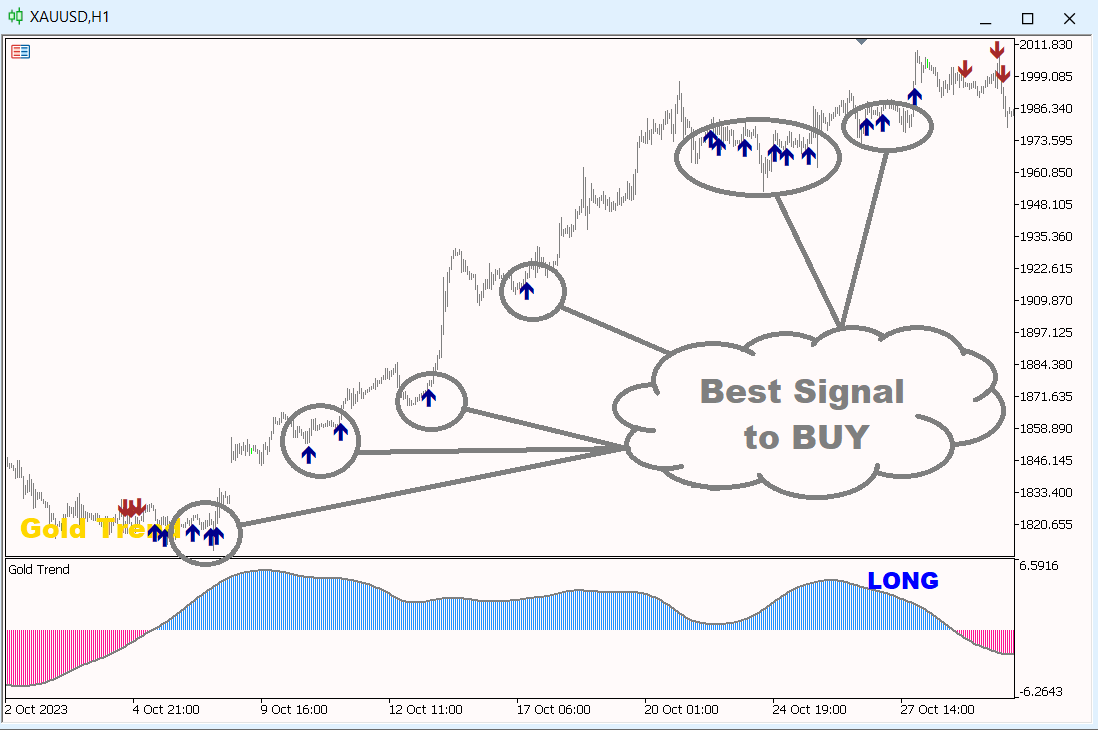
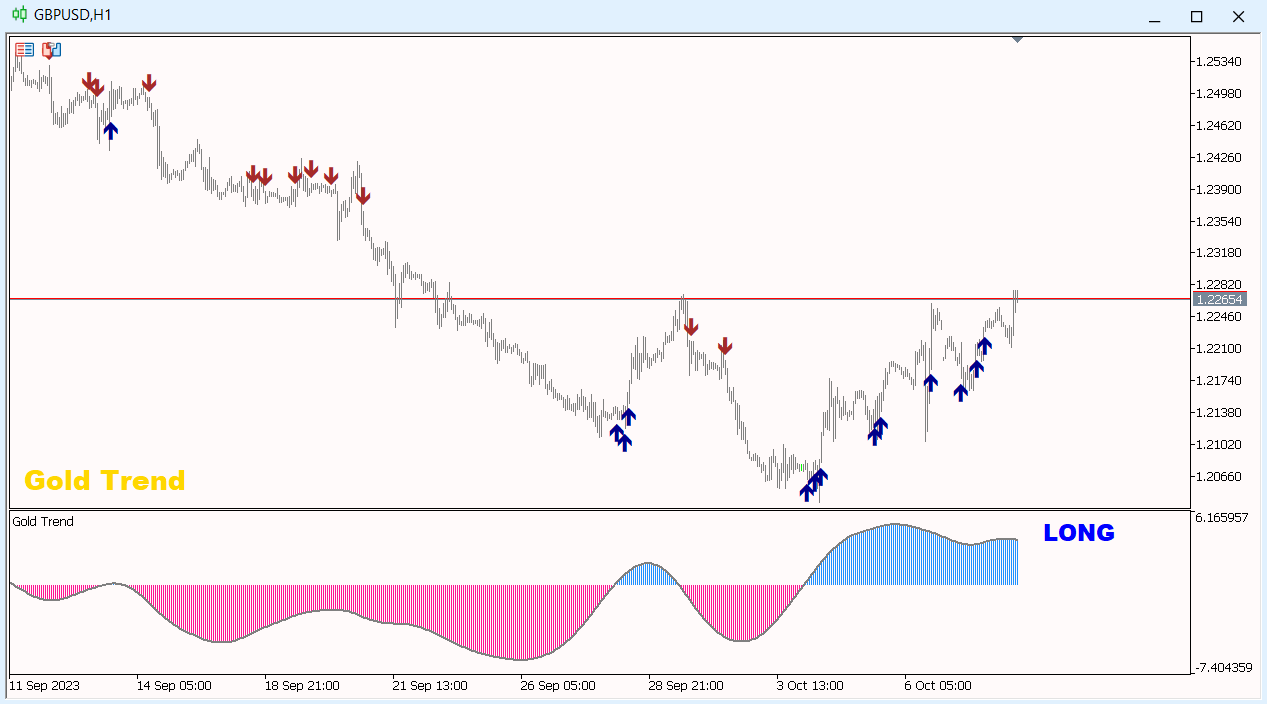
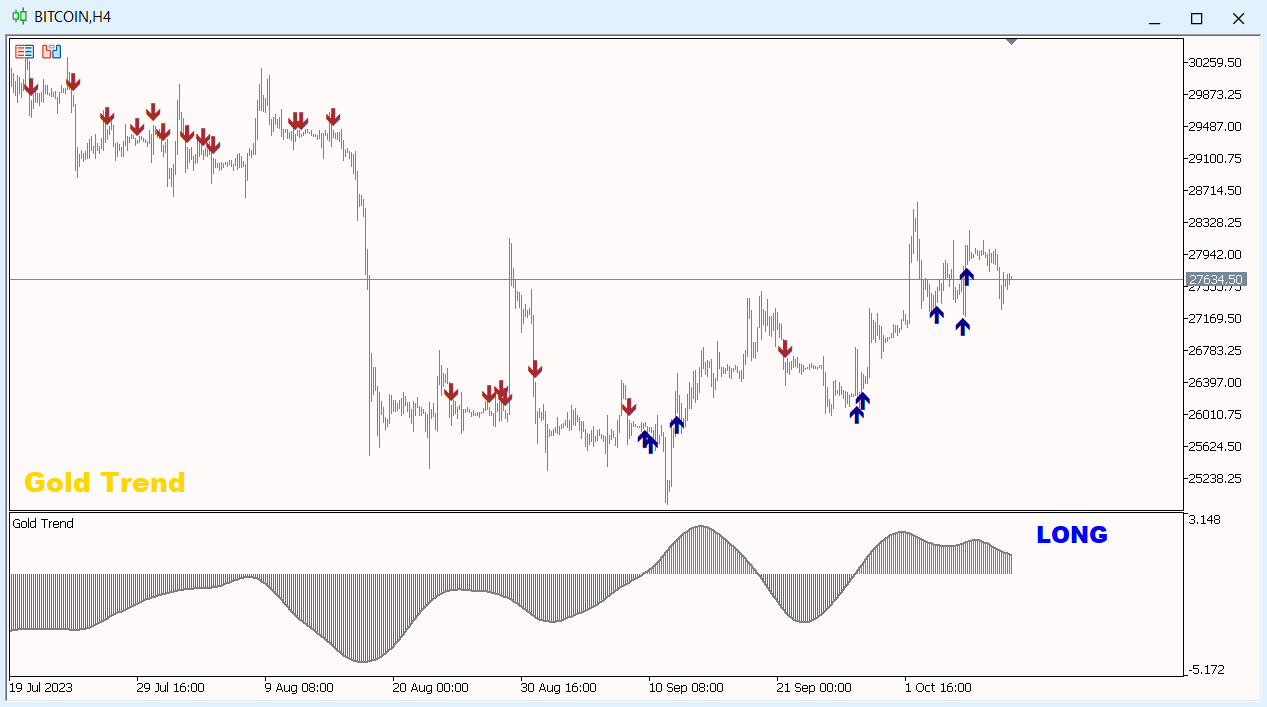
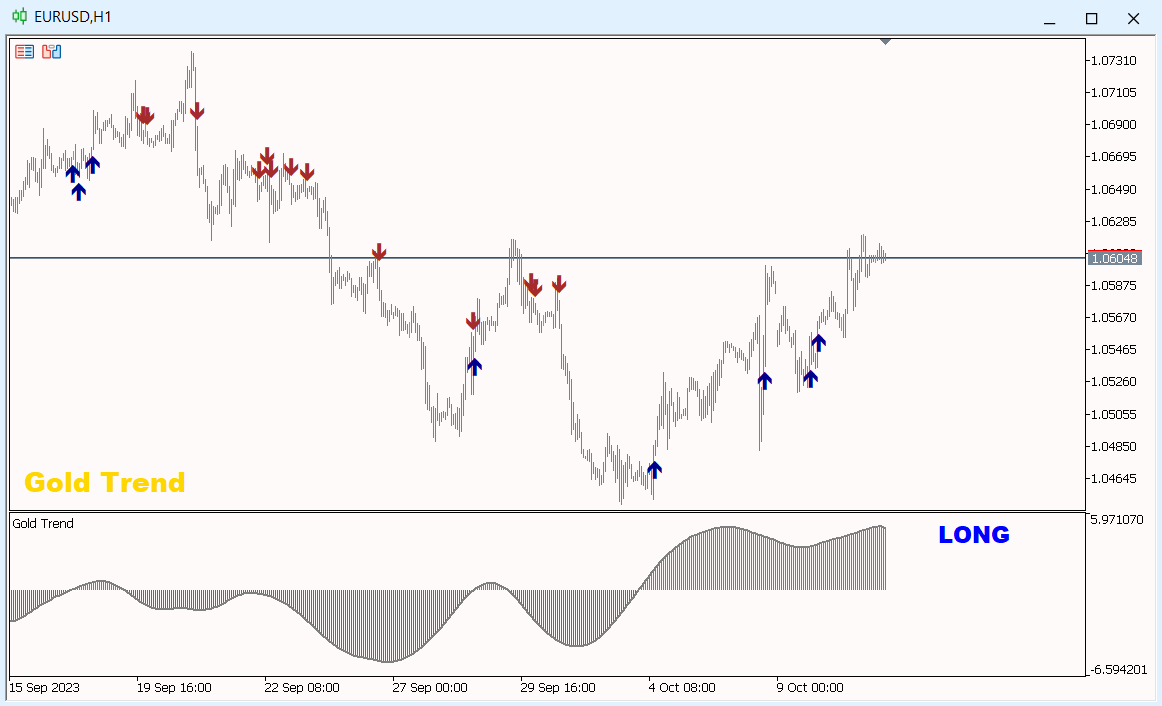
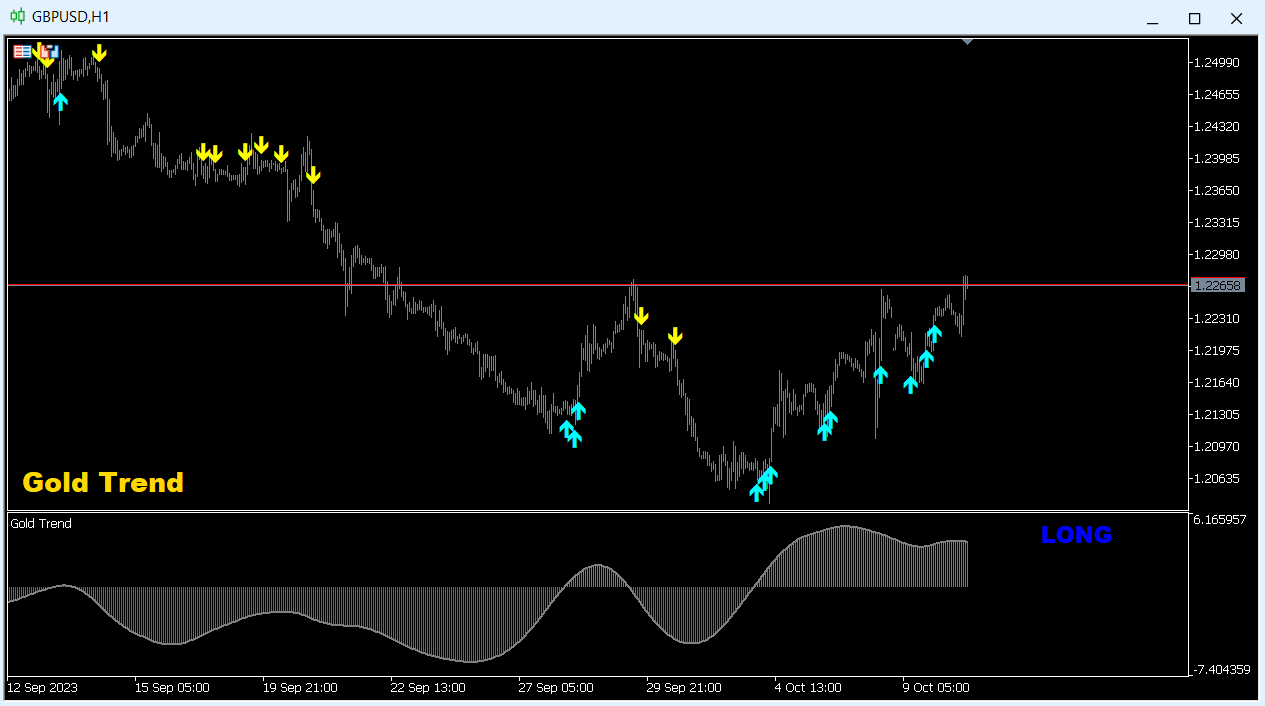
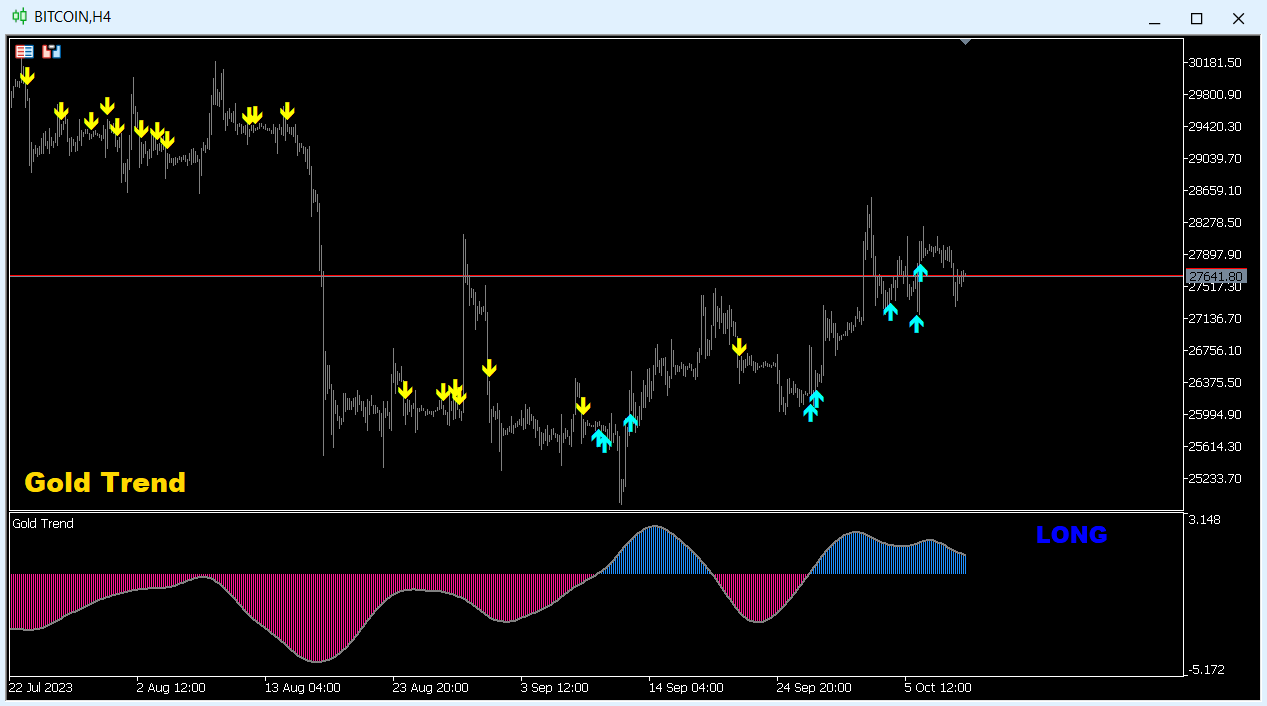
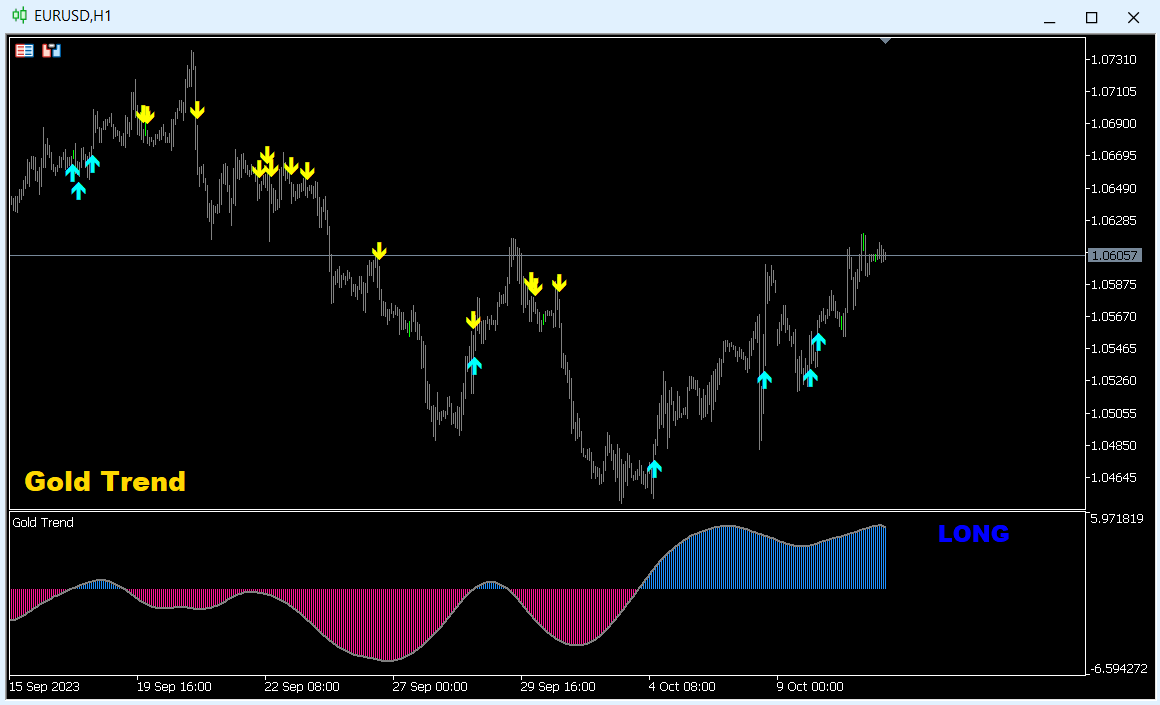
Gold Trend - これは優れた株価テクニカル指標です。指標のアルゴリズムは、資産の値動きを分析し、ボラティリティと潜在的なエントリーゾーンを反映しています。
最高の指標シグナル:
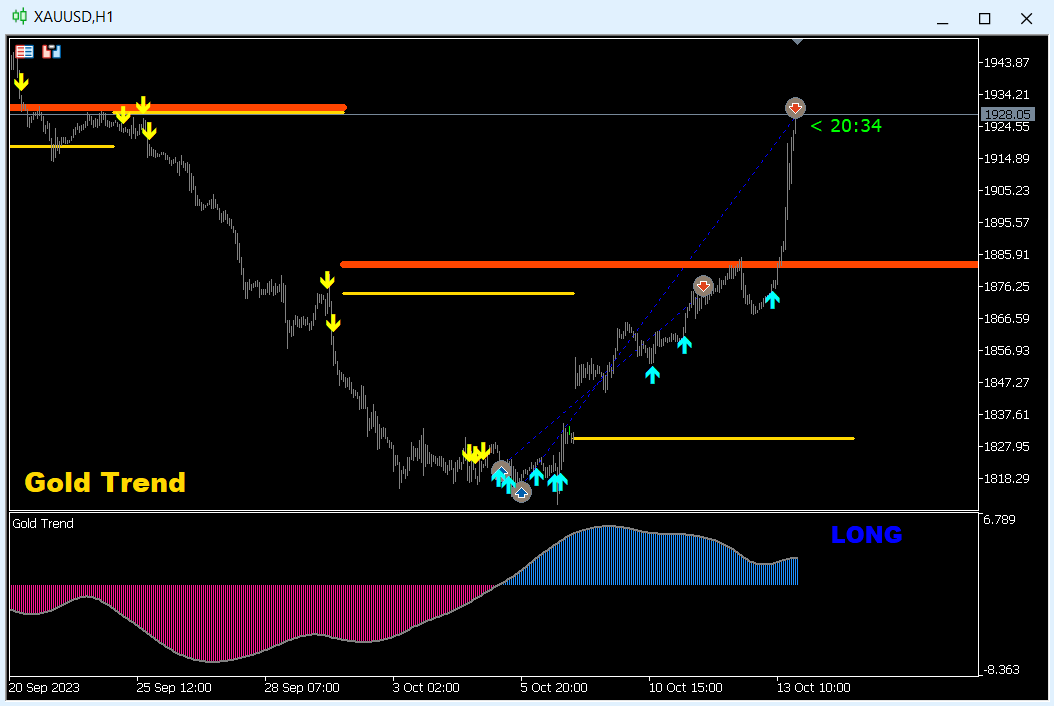
- 売りの場合 = 赤のヒストグラム + 赤のショートポインター + 同じ方向に黄色のシグナル矢印。
- 買いの場合 = 青のヒストグラム + 青のロングポインター + 同じ方向の水色のシグナル矢印。
インジケータの利点
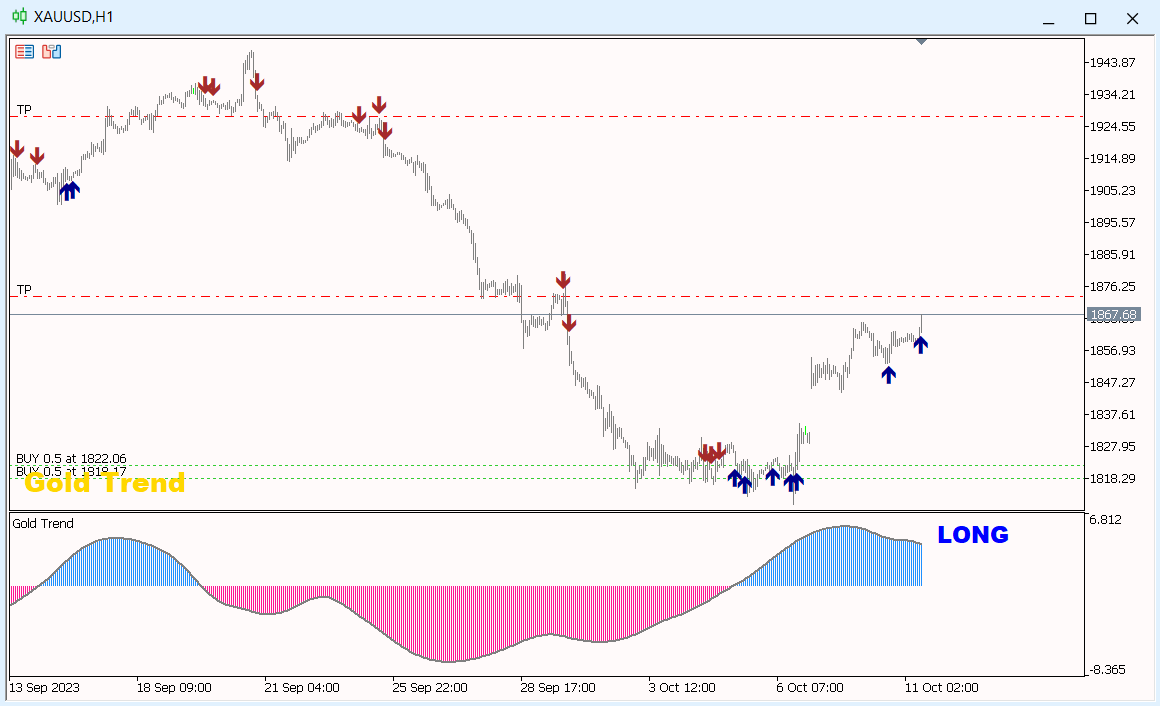
1. このインディケータは、高い精度でシグナルを発信します。
2. 確定した矢印シグナルは、トレンドが変化したときにのみ再描画されます。
3. どのブローカーのMetaTrader 5取引プラットフォームでも取引できます。
4. あらゆる資産(通貨、金属、暗号通貨、株式、指数など)を取引できます。
5. H1タイムフレーム(中期取引)で取引するのがよい。
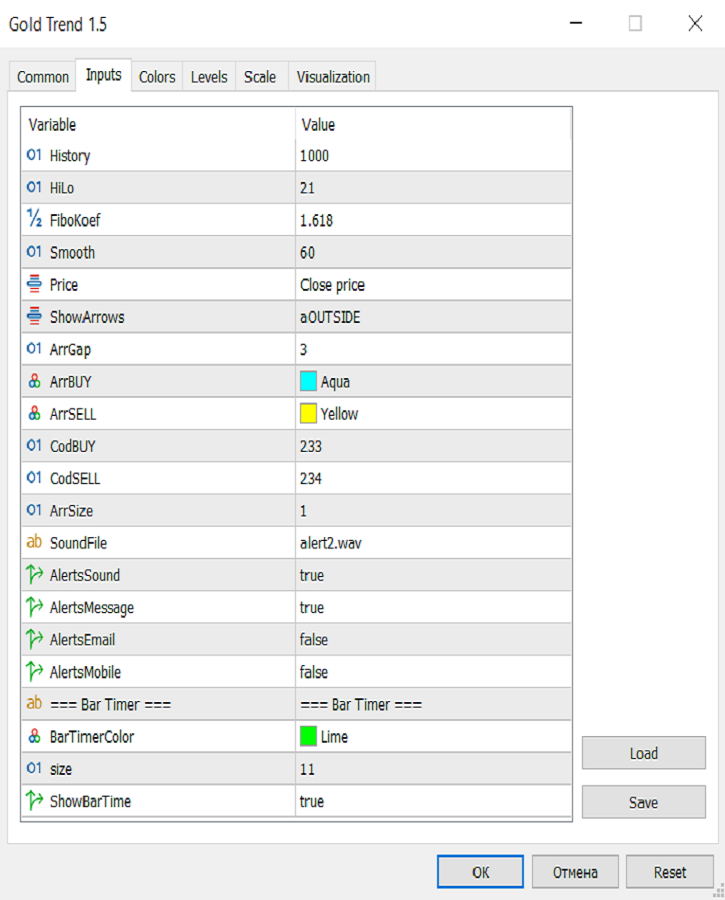
6. 各トレーダーがインディケータを自分用に簡単にカスタマイズできるよう、インディケータ設定で個々のパラメータ(TF、色など)を変更できます。
7. このインディケータは、トレーディングシステムの優れたメイン機能として、また独立したトレーディングシステムとして使用することができます。
注:取引の精度と収益性は、トレーダーのスキルにのみ依存します。どのインジケータもトレーダーのアシスタントに過ぎず、行動を導くものではありません。 黄金律 - トレンドに従って注文を開き、利益を得て、次の最良のシグナルが出るまで待ちます。
皆様のトレードの幸運と安定した利益をお祈りいたします!

Big Ups to the developer...the product is exactly as it is advertised. Every trend signal is clear, so far haven't lost a single trade within 8 days. Don't hesitate, just buy the product and see it for yourselves.