Gold Trend 5
- Indicadores
- Sergei Linskii
- Versión: 1.5
- Actualizado: 26 noviembre 2023
- Activaciones: 5
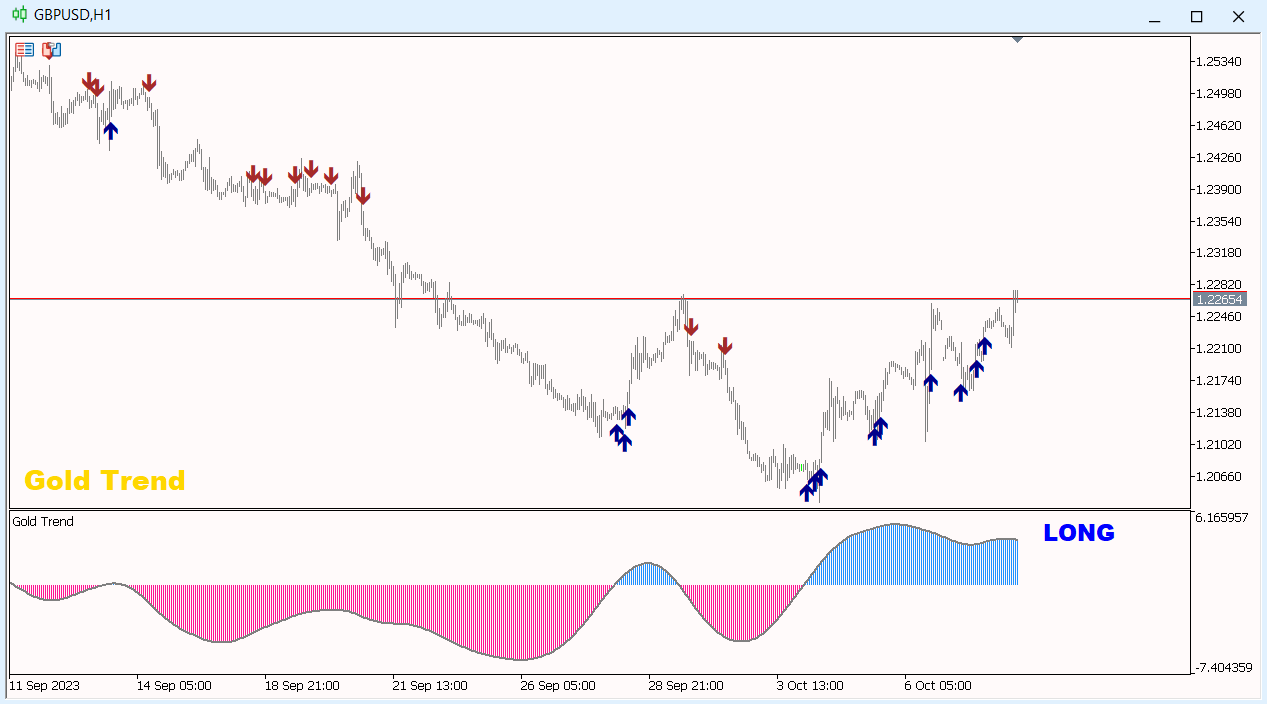
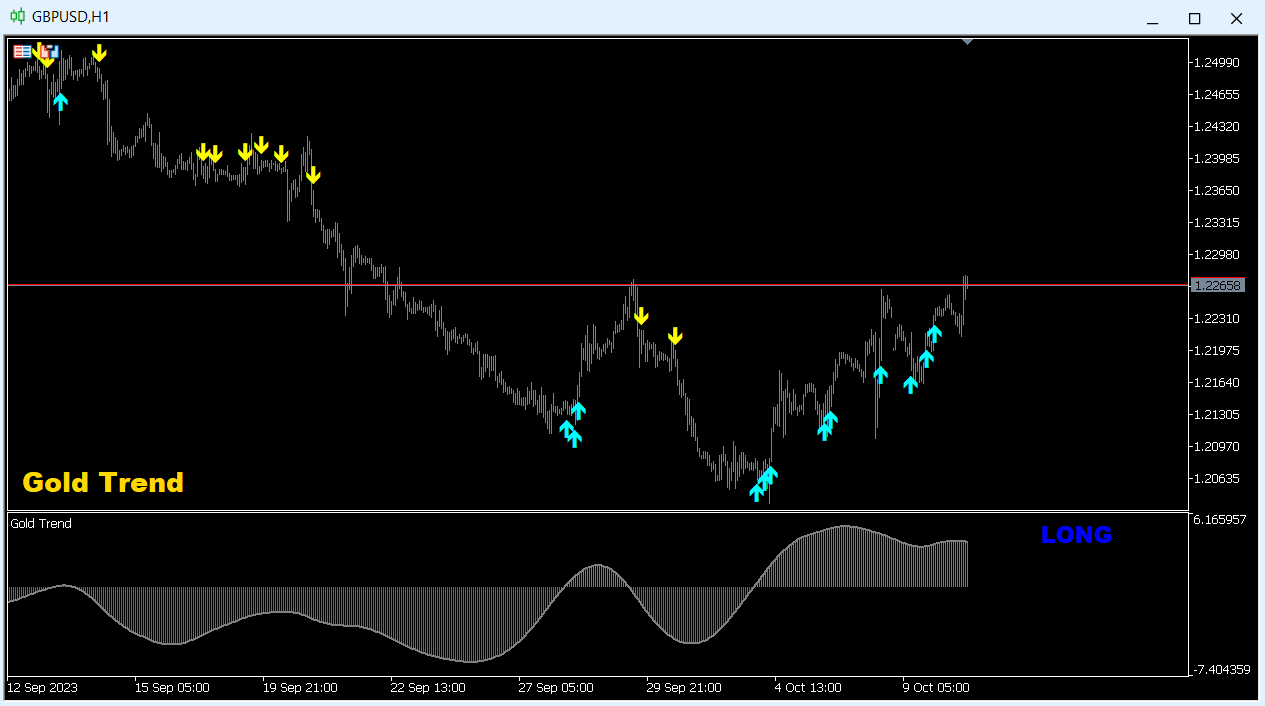
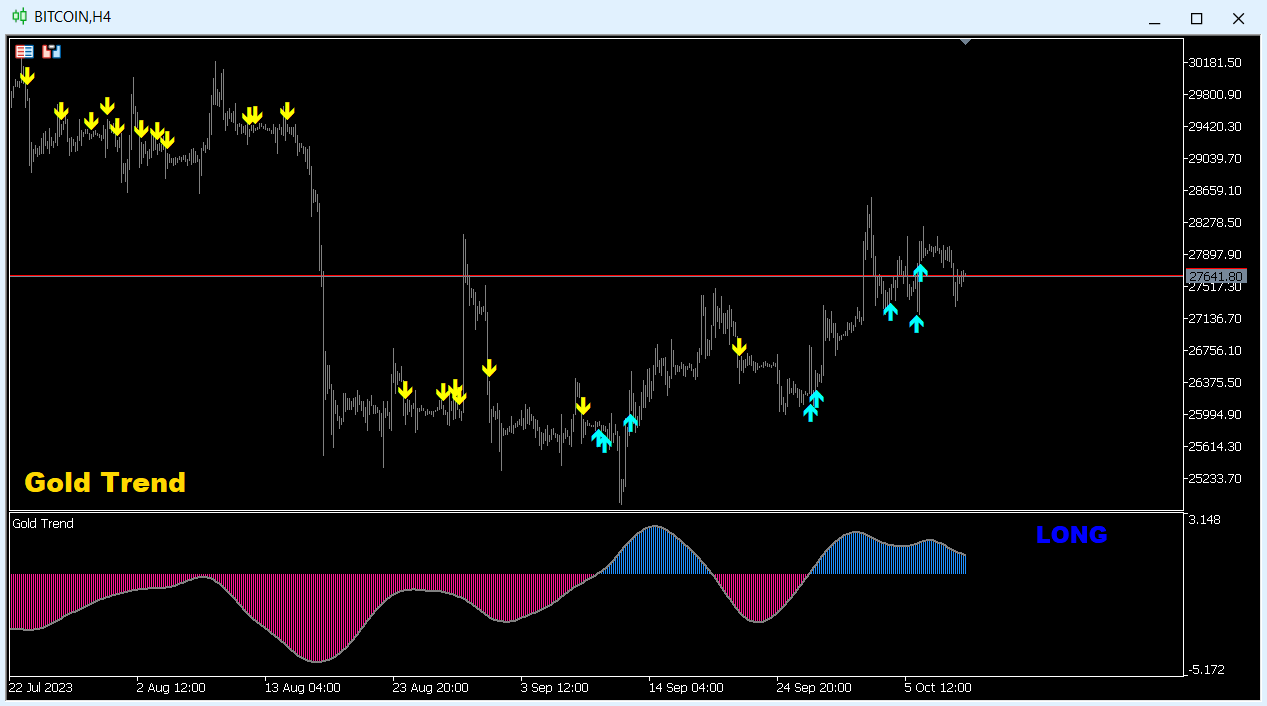
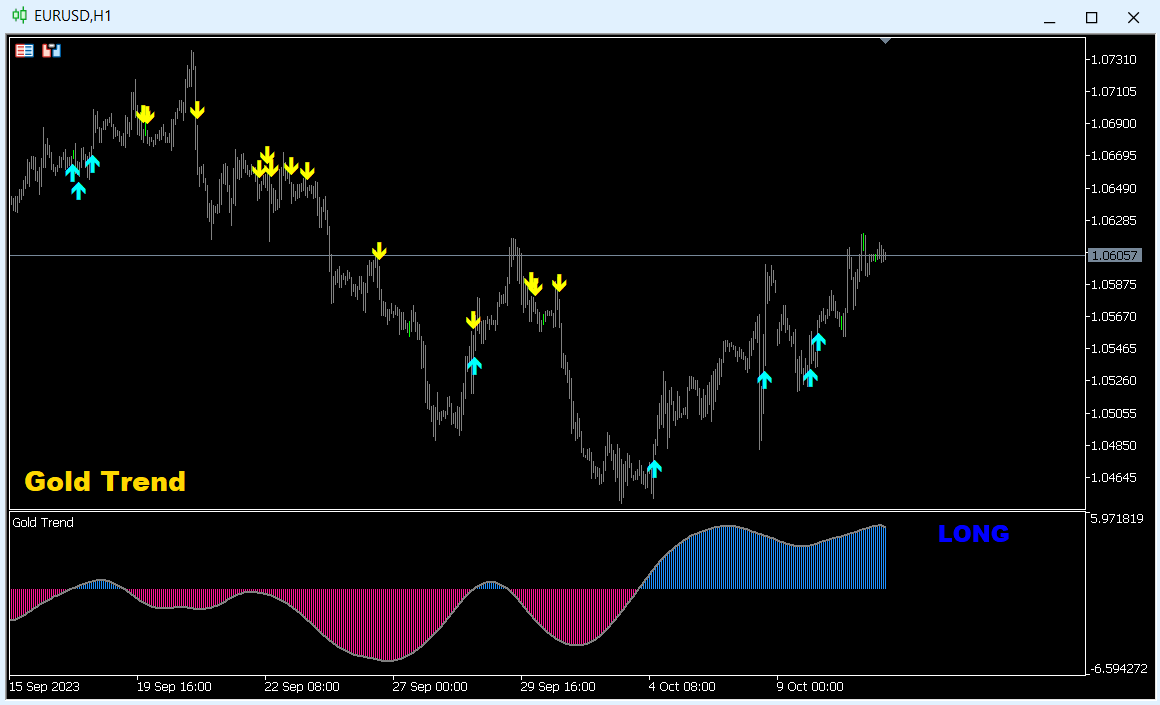
Tendencia del oro: se trata de un buen indicador técnico bursátil. El algoritmo del indicador analiza el movimiento del precio de un activo y refleja la volatilidad y las posibles zonas de entrada.
Las mejores señales del indicador:
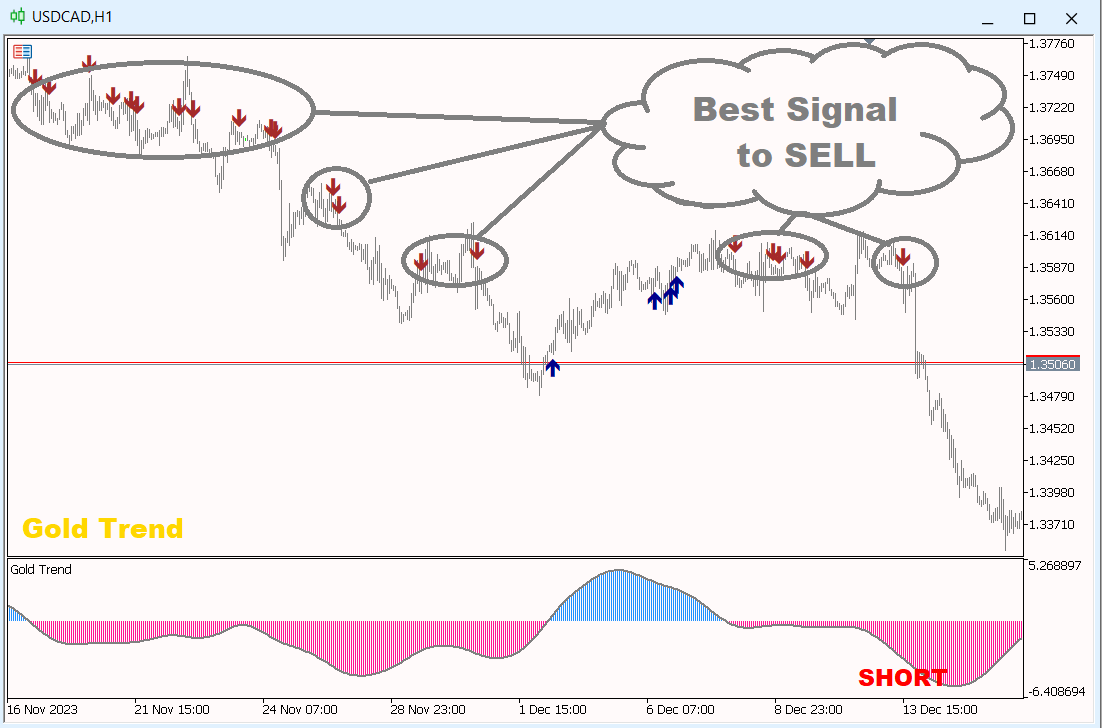
- Para VENTA = histograma rojo + puntero rojo CORTO + flecha amarilla de señal en la misma dirección.
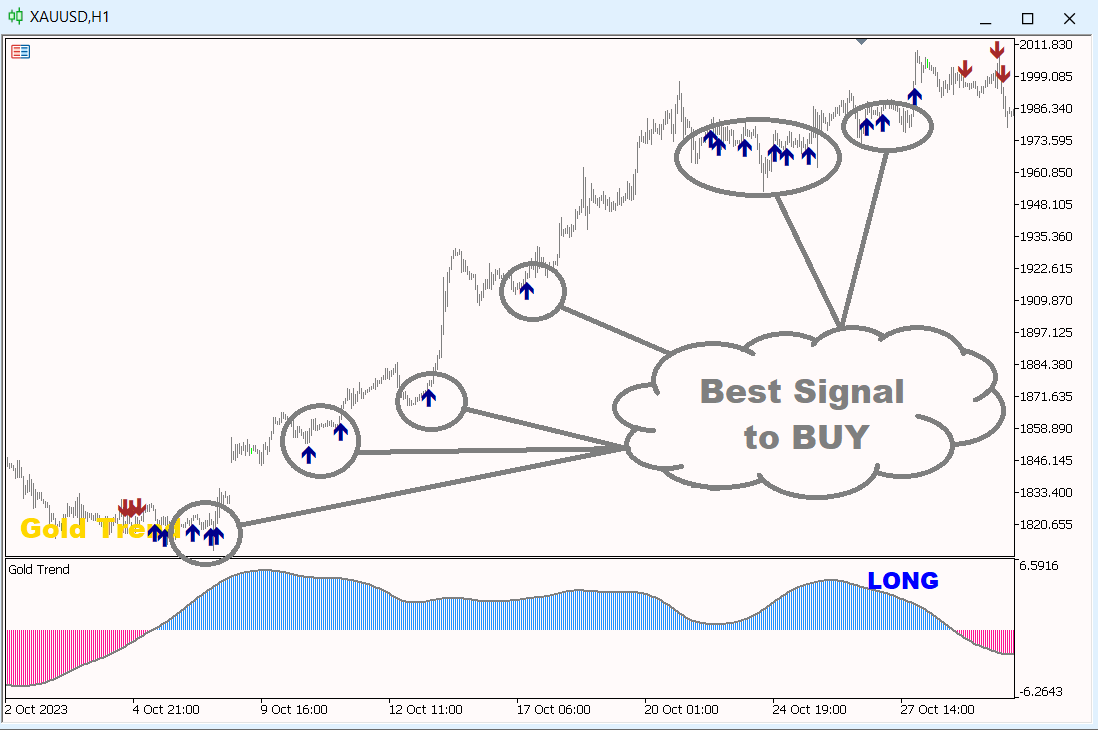
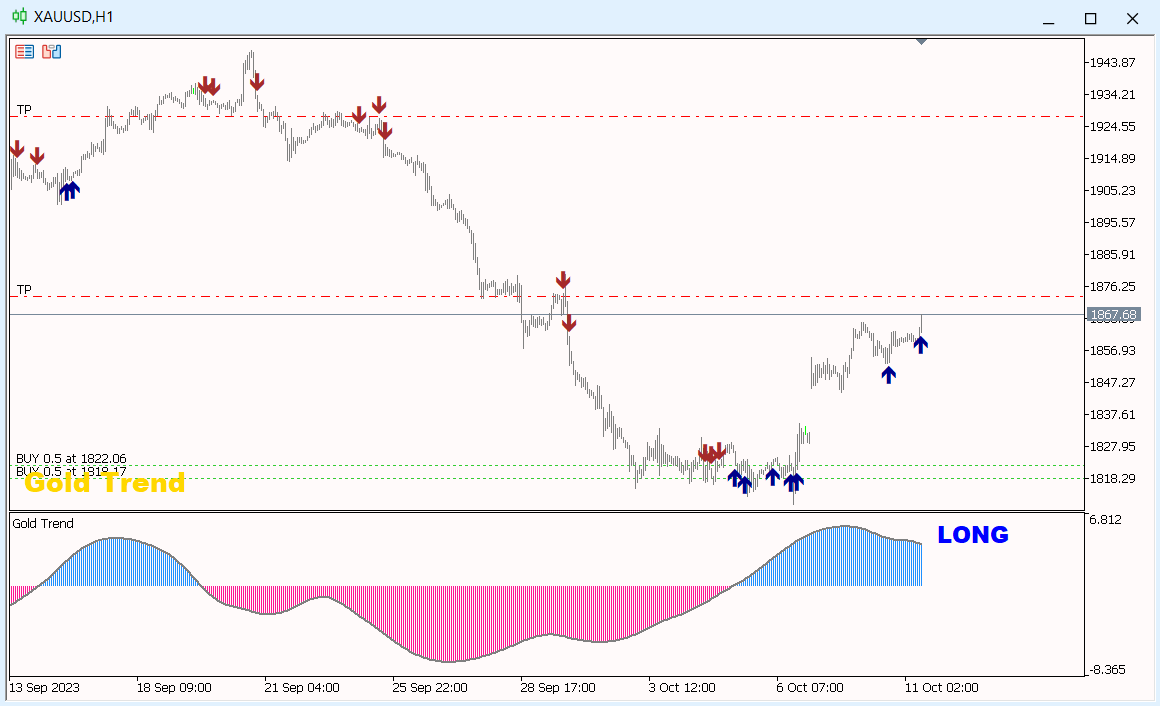
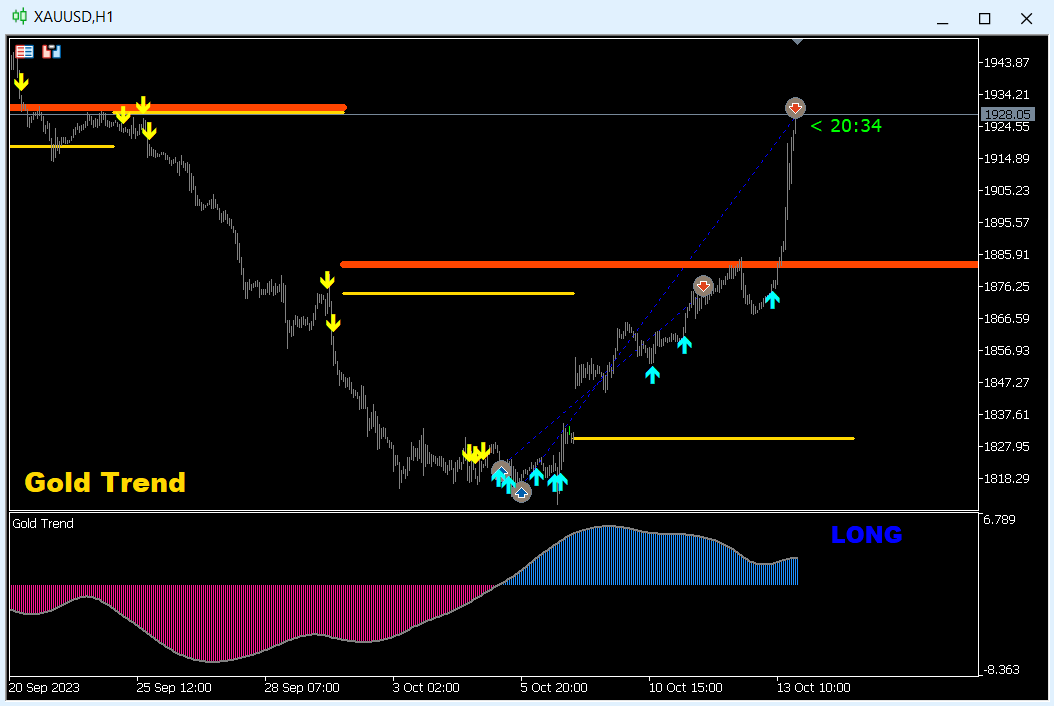
- Para COMPRA = histograma azul + puntero azul LARGO + flecha de señal aqua en la misma dirección.
Ventajas del indicador:
1. El indicador produce señales con alta precisión.
2. Una señal de flecha confirmada sólo puede ser redibujada cuando cambia la tendencia.
3. Puede operar en la plataforma de trading MetaTrader 5 de cualquier broker.
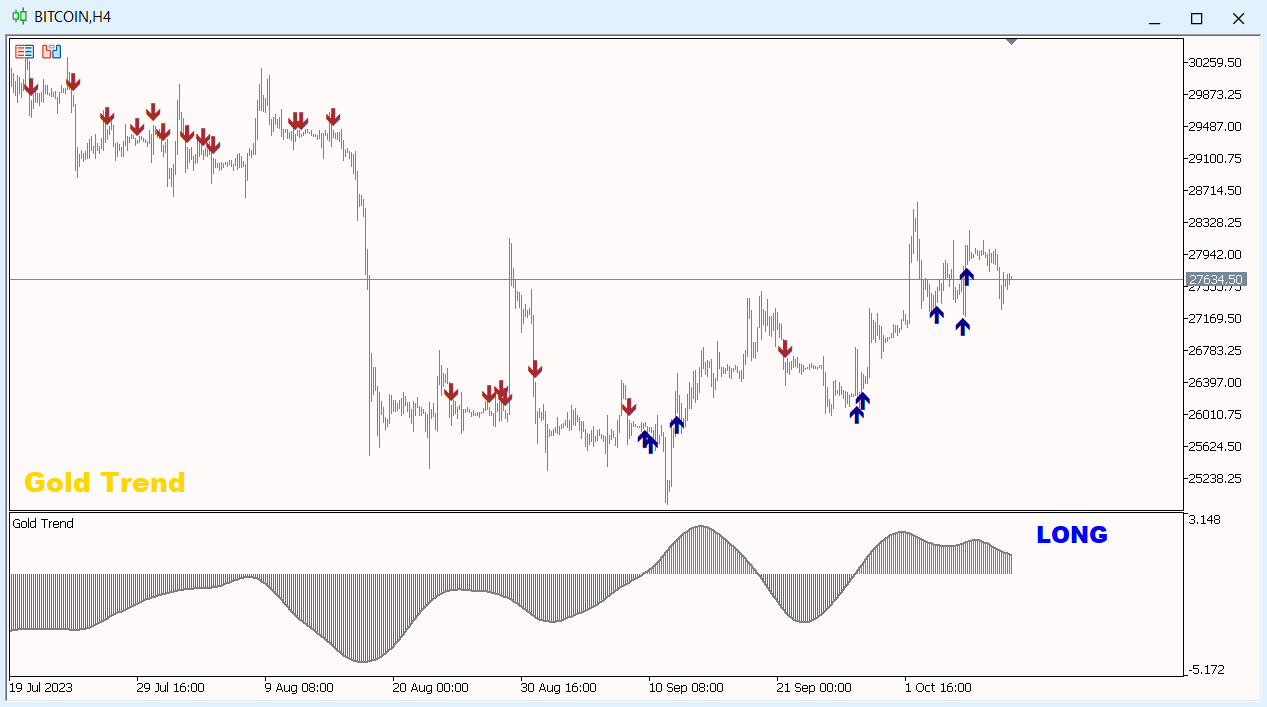
4. Puede operar con cualquier activo (divisas, metales, criptodivisas, acciones, índices, etc.).
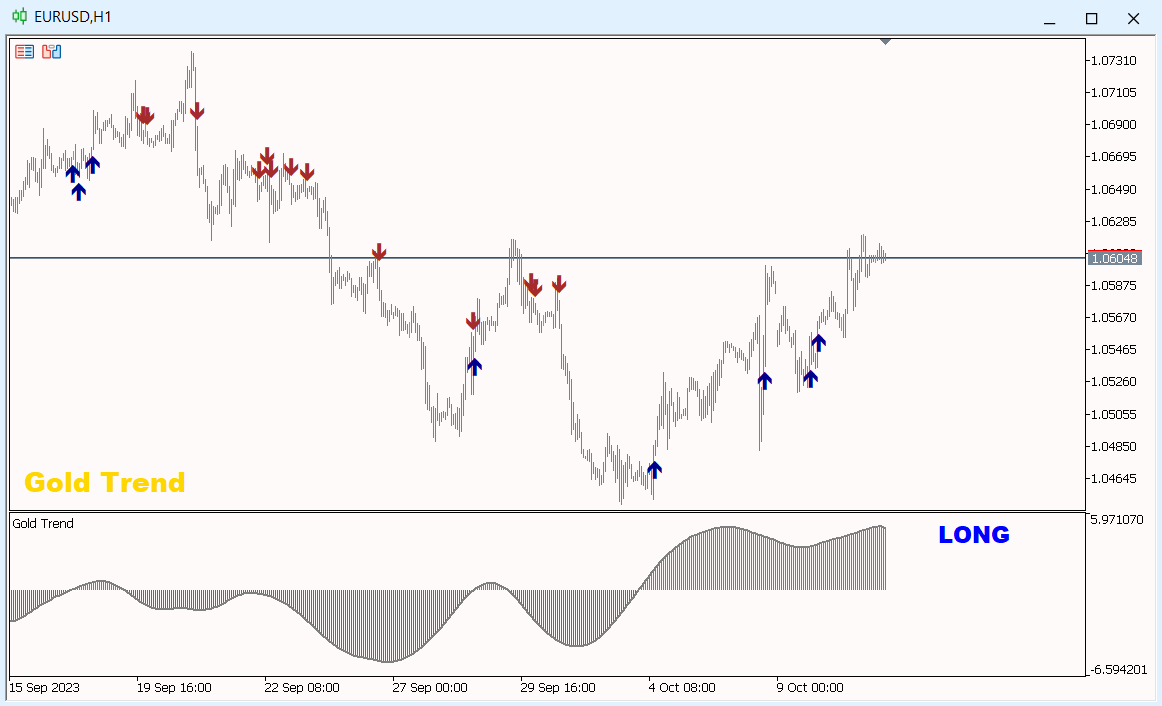
5. Es mejor operar en marcos temporales H1 (trading a medio plazo).
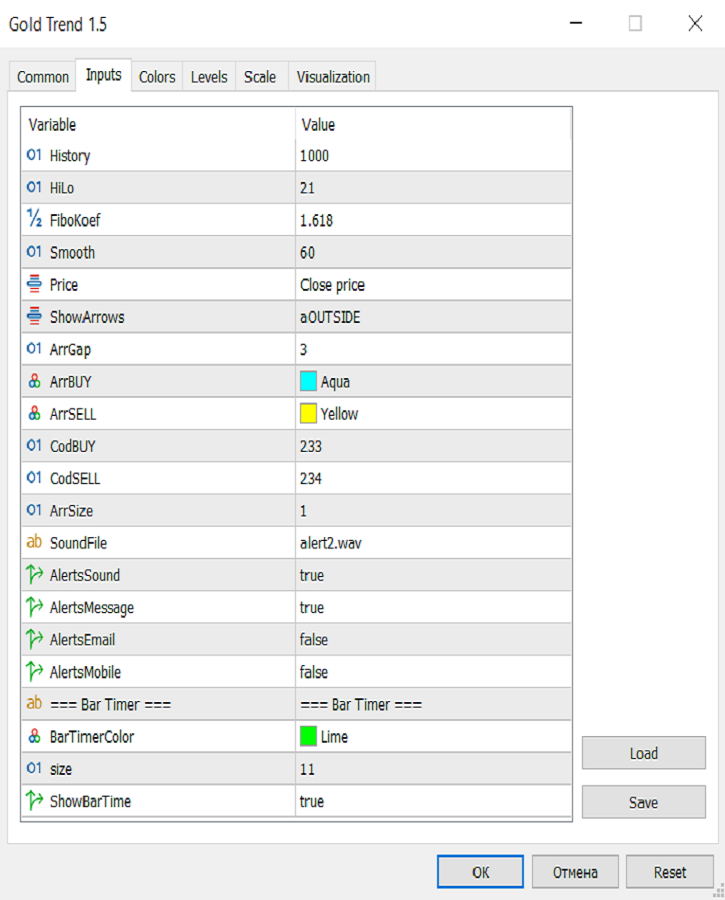
6. Los parámetros individuales (TF, color, etc.) están disponibles para cambiar en la configuración del indicador para que cada comerciante pueda personalizar fácilmente el indicador para sí mismos.
7. 7. El indicador puede utilizarse como un excelente complemento principal de su sistema de trading, así como un sistema de trading independiente.
NOTA: La precisión de entrada y la rentabilidad del trading dependen únicamente de la habilidad del trader. Cualquier indicador es sólo un asistente para el comerciante, y no una guía para la acción. La regla de oro: abrir una orden según la tendencia, tomar ganancias y esperar hasta la siguiente mejor señal.
¡Les deseo a todos buena suerte en el comercio y ganancias estables!

Big Ups to the developer...the product is exactly as it is advertised. Every trend signal is clear, so far haven't lost a single trade within 8 days. Don't hesitate, just buy the product and see it for yourselves.