• 概要
  • レビュー (18)
  • コメント (59)
  • 最新情報

PROscalper

3.6

PROscalper is a perfect tool for traders who use the scalping strategy!

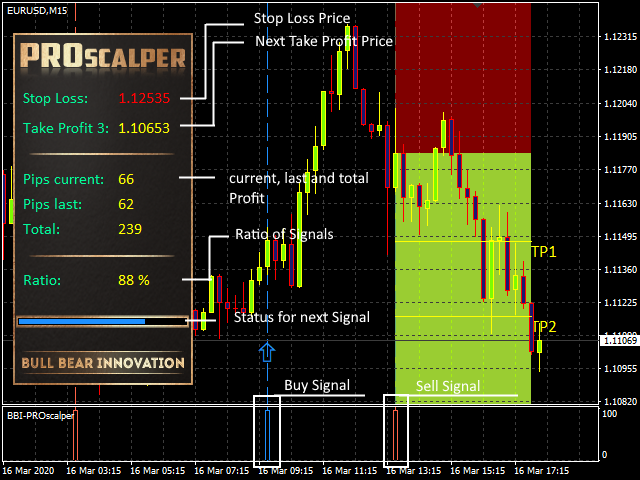
It gives you the visual view of the main Stoploss, Takeprofits and current/last pips on the chart and also in the integrated menu.

So with this overview you have the high quality indicator for scalping!

You can use PROscalper on any timeframes and on any pairs, but lower timeframes are recommended.

To improve results, you can combine PROscalper with a Trendindicator (TrendfollowerSR) to get a dual confirmation for the entries.


    Benefits

    • Overall view using the menu
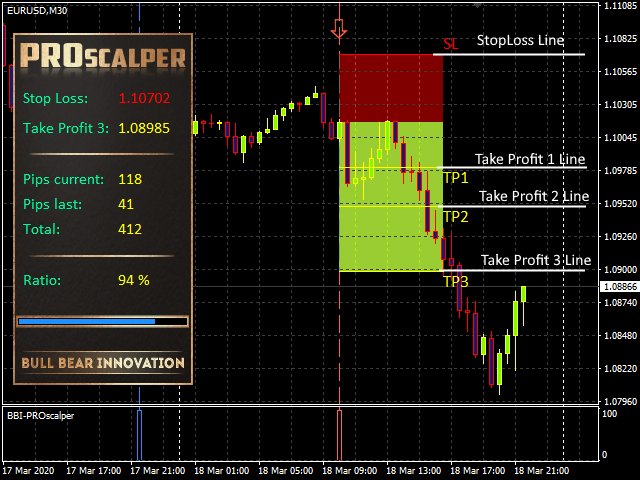
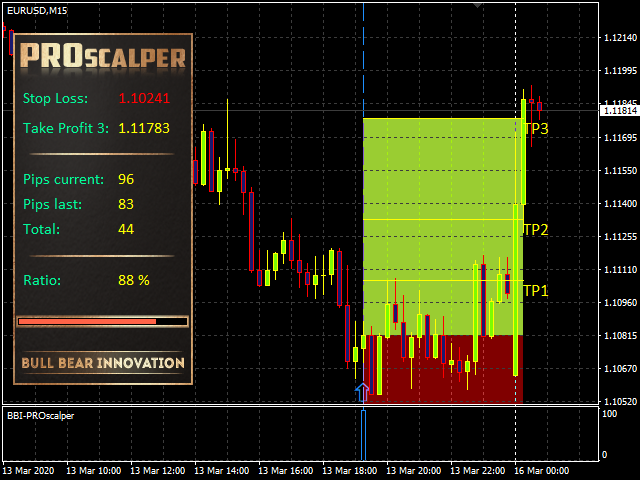
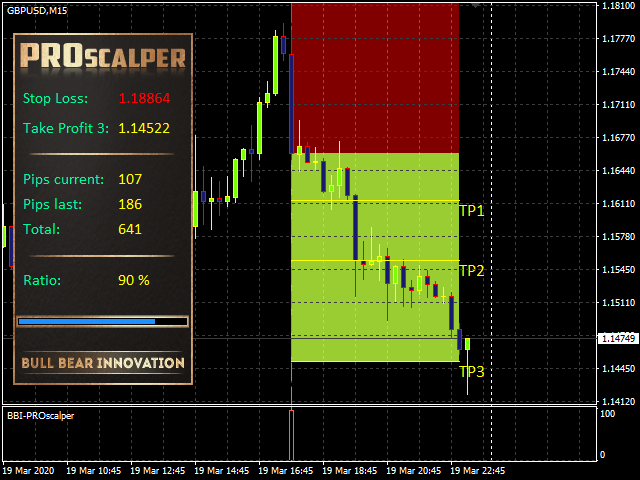
    • Visual view of the Stoploss and Takeprofits on the chart
    • Very easy to use
    • Suitable to professional traders and also for beginners
    • Increase Profit using just a trendindicator
    • No repaint & no backpaint


    PROscalper inputs

    • Filter A - First filter to adjust the signals
    • Filter B - Second filter to adjust the signals
    • Digits Broker - your digits of the price in the chart

    Signals:

    • Draw Vertcal Lines - Draw vertical Entry lines
    • Line Style - Style of the vertical Entry lines
    • Buy-Line - Color of the vertical Buy line
    • Sell-Line - Color of the vertical Sell line
    • Draw Arrows - Draw the signal arrows on/off
    • Buy-Arrow - Color of the Buy arrow
    • Sell-Arrow - Color of the Sell arrow
    • MT4 Alert - Alarm notification on your Metatrader 4 platform
    • EMail Alert - Alarm notification on your EMail account
    • Mobile Alert - Alarm notification on your mobile device

    SL & TP:

    • Risk type - Higher risk -> the TP and SL are further away from the entry
    • Stop Loss Color - Color for the Stop Loss line
    • Take Profit 1 Color - Color of the first Take Profit line
    • Take Profit 2 Color - Color of the second Take Profit line
    • Take Profit 3 Color - Color of the third Take Profit line
    • Draw Background - Draw the Stop Loss and Take Profit Zones on/off
    • Stop Loss Background Color - Color for the background of the Stop Loss Zone
    • Take Profit Background Color - Color for the background of the Take Profit Zone

    Menu:

    • Show Menu - Show the Menu on/off
    • Coord. X - X coordinate for the menu (horizontal)
    • Coord. Y - Y coordinate for the menu (vertical)
    • Menu Background color - the color of menu
    • Menu Label color - the color of the font
    • Menu in Background - if yes, then you see other objects through the menu
    • Statuscolor BUY - the color of the menu status line for BUY (at the bottom)
    • Statuscolor SELL - the color of the menu status line for SELL (at the bottom)
    レビュー 18
    TheFXChamp
    366
    TheFXChamp 2021.06.25 00:17 
     

    This system is a buried treasure! I only trade XAUUSD and it solved my 1year old problem I love how it works most excellent product. The pip counter is off a bit but it's not a big deal to me. I will send you message in regards to the SR Breakout using Camarilla levels we need to discuss business.

    rainwalker123
    3362
    rainwalker123 2019.04.04 09:03 
     

    I really dont understand the reviews with 1star.

    Those bad reviews just from people, who dont have a clue about trading.

    Oustanding scalper, and easy to handle. You can customize the indicator to your trading needs.

    10 stars

    Dmitriy Karev
    218
    Dmitriy Karev 2017.12.05 09:23 
     

    Ребята я это индикатор купил 2005 году )) И только сейчас я вспомнил про его существование ... Буду работать ))

    おすすめのプロダクト
    Was: $249  Now: $99   Market Profile defines a number of day types that can help the trader to determine market behaviour. A key feature is the Value Area, representing the range of price action where 70% of trading took place. Understanding the Value Area can give traders valuable insight into market direction and establish the higher odds trade. It is an excellent addition to any system you may be using. Blahtech Limited presents their Market Profile indicator for the MetaTrader community. Ins
    This indicator was inspired by М & W Wave Patterns by A. Merrill. 5 extremums or 4 edges of ZigZag are enough to build M or W pattern at arbitrary offset in the history. The classical approach includes a table of predefined figures of ZigZag waves, which can transform into each other under special rules—so that next edge can be forecasted based on these rules. Unlike to this approach, the indicator analyses available history and builds statistics for all M and W patterns, which differ in their c
    We present you the indicator "Candle closing counter", which will become your indispensable assistant in the world of trading. That’s why knowing when the candle will close can help: If you like to trade using candle patterns, you will know when the candle will be closed. This indicator will allow you to check if a known pattern has formed and if there is a possibility of trading. The indicator will help you to prepare for market opening and market closure. You can set a timer to create a p
    The Th3Eng PipFinite indicator is based on a very excellent analysis of the right trend direction with perfect custom algorithms. It show the true direction and the best point to start trading. With StopLoss point and Three Take Profit points. Also it show the right pivot of the price and small points to order to replace the dynamic support and resistance channel, Which surrounds the price. And Finally it draws a very helpful Box on the left side on the chart includes (take profits and Stop loss
    これは、キャンドルの終値を予測する指標です。 このインジケータは、主にD1チャートでの使用を目的としていますが. この指標は、従来の外国為替取引とバイナリオプション取引の両方に適しています。 インジケーターは、スタンドアロンのトレーディングシステムとして使用することも、既存のトレーディングシステムへの追加として機能させることもできます。 このインジケーターは、現在のキャンドルを分析し、キャンドル自体の内部の特定の強度係数と、前のキャンドルのパラメーターを計算します。 したがって、この指標は、市場の動きのさらなる方向性と現在のキャンドルの終値を予測します。 この方法のおかげで、この指標は、短期の日中取引だけでなく、中期および長期の取引にも適しています。 インジケーターを使用すると、市場の状況の分析中にインジケーターが生成する潜在的な信号の数を設定できます。 インジケーターの設定には、このための特別なパラメーターがあります。 また、インジケーターは、チャート上のメッセージの形式で、電子メールで、およびPUSH通知の形式で、新しい信号について通知することができます。 購入後は必ず私に書いて
    This unique multi-currency strategy simultaneously determines the strength of trends and market entry points, visualizing this using histograms on the chart. The indicator is optimally adapted for trading on the timeframes М5, М15, М30, Н1. For the convenience of users, the indicator renders the entry point (in the form of an arrow), recommended take profit levels (TP1, TP2 with text labels) and the recommended Stop Loss level. The take profit levels (TP1, TP2) are automatically calculated for
    Trade with Gann on your side!! MASTER CIRCLE 360 CIRCLE CHART, originally created by Gann admitted that this is “The Mother of all charts”. It is one of the last studies that this great trader left for us. The numeric tab le is apparently quite simple like all the tables and is based on square numbers, the SQUARE OF 12 and is by evolution, one of the most important square numbers. Here we can find CYCLE, PRICE AND TIME thanks to angles and grades, to show past and future support and resistance.
    A scalping indicator based on mathematical patterns, which on average gives signals with relatively small SL, and also occasionally helps to catch big moves in the markets (more information in the video) This indicator has three main types of notifications: The first type warns of a possible/upcoming signal on the next bar The second type indicates the presence of a ready signal to enter the market/open a position The third type is for SL and TP levels - you will be notified every time price r
    The indicator looks for buying and selling zones, where a deal can be opened with a minimal stop loss and a better Risk Reward Ratio. The indicator is based on qualitative search of the Double top/Double bottom pattern. Indicator operation principle Looks for local tops/bottoms which can potentially become a Reversal zone It waits for an impulse movement that would exceed the Reversal zone and draws a red/blue wide rectangle Within the Reversal zone, it looks for the strongest area of the zone
    It will be the best tool for you to make a profit! Through unique algorithms You're going to see an amazing amount of right trading signals Make huge profits every day and realize more possibilities!   Like the car no money to buy it, the love of the girls dare not to pursue?Or the credit card bill is not paid, the rent does not have the extra money to settle?Or are you fed up with being bossed around by your boss and Hope to get more people's respect?Can't afford to buy the things you want ? wa
    This indicator monitors the market for a flat state and possible breakout. The flat state is detected as a predefined number of consecutive bars during which price fluctuates inside a small range. If one of the next bars closes outside the range, breakout is signaled. The indicator shows 3 lines: blue - upper bound of flat ranges AND consecutive breakout areas; red - lower bound of flat ranges AND consecutive breakout areas; yellow - center of flat ranges (NOT including breakout areas). When a b
    Старый, добрый "AP" в версии трендового осциллятора. Это простой индикатор, который использует максимум возможностей языка MQL4. Но при этом он работает достаточно быстро даже на процессорах 1 Гигагерц и менее. При анализе следует обращать внимание на пересечение уровня 50, если вы намеренны использовать его как трендовый индикатор. Индикатор не перерисовывает, и работает на всех типах графиков и таймфреймах. Сделаны основные возможности оповещения, оповещения работают в обоих направлениях
    The perfect tool for Scalng in the Forex markets You can trade both from signal to signal and using take profit  The algorithm does not use Zigzag!  No redrawing!  This is a channel instrument that uses a moving average as a filter. Moving Average  There are 2 parameters for the settings Ma Period = 5 period Moving Average  Channel 1.0 distance of channel lines from the chart Price Signal Filter - calculation of signal opening and filter There is a complete set of Alert There is a multi-timefram
    The Chaikin Oscillator is a technical indicator developed by Marc Chaikin that combines price and volume data to measure the accumulation and distribution of a financial instrument. It aims to identify potential buying and selling opportunities in the market. The Chaikin Oscillator is calculated by subtracting a 10-day exponential moving average of the Accumulation Distribution Line (ADL) from a 3-day exponential moving average of the ADL. Here's how to use the Chaikin Oscillator indicator in tr
    フィボナッチリトレースと拡張ラインツール DiNapoliポイント取引方法とゴールデンセクション取引を使用するトレーダーにとって理想的なMT4プラットフォームのフィボナッチリトレースと拡張ラインツール 主な特長: あなたはフィボナッチリトレースメントの複数のセットを直接描くことができ、重要なリターンポイント間の関係は一目瞭然です。 2.フィボナッチ拡張を描画することができます。 3.フィボナッチフォールドバックとラインの延長は、簡単な観察と数値表示のために左右に動かすことができます。 4.チャートは非常に爽やかな 5.数字キーでサイクルを切り替えることができます。 ファンクションキー: 1。 [戻るを押す、要求に応じて描画する、最大8つのグループにする 2。拡張]を描くには[押す] 3。 \を押すと、現在のサイクルの下にあるすべての拡張機能と折り畳みが削除されます 4。フォールドバックを移動して削除して展開する (1)最初のフォールドバックセットのF5行をクリックします。 一度クリックすると(黄色に変わります)、キーボードのDel
    The Point61 indicator is the result of many years of monitoring of price behavior of currency pairs and metals. It is not a secret, that in times of uncertainty, traders are looking for possible levels of support and resistance - the point, where price should stop its movement. There are 2 possible scenarios at these points: 1. Reverse (correction) to the opposite direction; 2. Breakthrough to continue movement. Very often these points are used to set stop orders - TakeProfit or
    LevelPAttern is a technical indicator based on the daily levels and Price Action patterns. The indicator is based on the standard ZigZag indicator + reversal candlestick pattens, such as Star, Hammer (also knows as Pin bar), Engulfing and others. The indicator generates audio and text notifications when a pattern is formed and a level is touched. It also supports sending email and push notifications. Indicator operation features It is suitable for working with any CFD and FOREX trading instrum
    "Pattern 123" is an indicator-a trading system built on a popular pattern, pattern 123. This is the moment when we expect a reversal on the older trend and enter the continuation of the small trend, its 3rd impulse. The indicator displays signals and markings on an open chart. You can enable/disable graphical constructions in the settings. The indicator has a built-in notification system (email, mobile terminal, standard terminal alert). "Pattern 123" has a table that displays signals from
    1000% non-repaint high accuracy signal technical indicator. Solar wind Predator work on all pairs with high and low volatility Solar wind Predator work from the 1 minute timeframe to the Monthly timeframe Swing trading H1 to W1 Scalping M1 to M30 Blue arrows above the zero line look for buying(bullish) opportunities. Orange arrows below zero line look for selling(bearish) opportunities.
    Noize Absorption Index - is the manual trading system that measures the difference of pressure between bears forces and bulls forces. Green line - is a noize free index that showing curent situation. Zero value of index shows totally choppy/flat market.Values above zero level shows how powerfull bullish wave is and values below zero measures bearish forces.Up arrow appears on bearish market when it's ready to reverse, dn arrow appears on weak bullish market, as a result of reverse expectation. S
    WaveMaster Pro : Advanced Market Analysis Indicator for MetaTrader 4 Overview WaveMaster Pro is an advanced MetaTrader 4 (MT4) indicator engineered to enhance trading strategies by offering a sophisticated analysis of market trends and price movements. By integrating sector analysis, micro wave detection, and price projection capabilities, WaveMaster Pro provides traders with actionable insights for better decision-making. Whether you are a novice trader or a seasoned professional, this tool is
    VR Cub
    Vladimir Pastushak
    VR Cub は、質の高いエントリーポイントを獲得するためのインジケーターです。このインジケーターは、数学的計算を容易にし、ポジションへのエントリーポイントの検索を簡素化するために開発されました。このインジケーターが作成されたトレーディング戦略は、長年にわたってその有効性が証明されてきました。取引戦略のシンプルさはその大きな利点であり、初心者のトレーダーでもうまく取引することができます。 VR Cub はポジション開始ポイントとテイクプロフィットとストップロスのターゲットレベルを計算し、効率と使いやすさを大幅に向上させます。取引の簡単なルールを理解するには、以下の戦略を使用した取引のスクリーンショットを見てください。 設定、設定ファイル、デモ版、説明書、問題解決方法は、以下から入手できます。 [ブログ] レビューを読んだり書いたりすることができます。 [リンク] のバージョン [MetaTrader 5] エントリーポイントの計算ルール ポジションをオープンする エントリーポイントを計算するには、VR Cub ツールを最後の高値から最後の安値までストレッチする必要があります。
    Heiken Ashi candle chart is an improved version of The Japanese candle chart, which can effectively filter the market "noise" of the Japanese candle chart. It is favored by many traders for its simplicity and intuition. For trend traders, the HA candle chart is a magic tool. Unlike the traditional Japanese candle chart, Heikenashi does not reflect the opening price, high price, low price and closing price of the market. Instead, Heikenashi calculates the value of a single K line in the dominant
    The indicator provides a superior alternative to price action analysis. It enables the identification of normalized patterns, which are then transformed into a graphical representation to forecast future steps within a time series. In the top-left corner, you'll find information regarding the expected prediction accuracy, determined through a complex MSQE calculation. You have the flexibility to adjust the time window, making it easy to validate the indicator's performance. Additionally, you can
    Consolidations
    Rofhiwa Bruce Nthulane
    5 (1)
    What if you could see trouble from far, just imagine having some ability to foresee danger. This indicator has the ability to see consolidations before they are clear to everyone else. In the market everything is always fun until the market starts consolidating and often times by the time people realise it it's often too late. This Indicator will spot consolidations very fast and let you know at the top right of the chart so that you can either avoid losses by stopping to trade using trend follo
    Title : Market Bias Indicator - Oscillator-Based Trading Tool Introduction : Discover the potential of the "Market Bias Indicator," a revolutionary oscillator-based trading tool designed for precise market analysis. If you're in search of a robust alternative to traditional bias indicators, your quest ends here. Market Bias Indicator offers unparalleled accuracy in identifying market sentiment and is your gateway to confident trading decisions. Recommended Trading Pairs : Market Bias Indicator i
    The indicator algorithm with the highest accuracy generates input signals using the arrows. Strategy for trading in a flat, all the necessary functions built into one tool! The principle of the indicator is to automatically determine the current state of the market when it is placed on a chart, analyze historical data, based on historical data and display instructions to the trader for further actions. The system itself shows in the form of arrows when to buy and when to sell.
    This is a future predictor based on so called backward WPR . The indicator calculates conditional probability of conversions between WPR and backward WPR values on available quotes history. Then it estimates future price movement using these probabilities and latest WPR readings. The backward WPR is nothing special except that it's counted from right to left, i.e. from the future to the past. The main advantage of the backward WPR is that it knows the future and its values are always optimal for
    This MT4 indicator has been designed to be used on any currency pair and any time frame . It has the scalper and swing trader in mind.  The indicator looks for short-term high-probability reversals in price and will indicate to you to go long (buy) or short (sell) if you see a green or red arrow next to the current candlestick respectively. The indicator provides the best trading opportunities to you during the active trading hours of London and New York, but it will continue to give signals all
    このプロダクトを購入した人は以下も購入しています
    まず第一に、この取引インジケーターは再描画されず、再描画されず、遅延しないことを強調する価値があります。これにより、手動取引とロボット取引の両方に理想的なものになります。 ユーザーマニュアル:設定、入力、戦略。 アトミックアナリストは、価格の強さとモメンタムを利用して市場でより良いエッジを見つけるためのPA価格アクションインジケーターです。ノイズや誤ったシグナルを除去し、取引ポテンシャルを高めるための高度なフィルターを備えています。複雑なインジケーターの複数のレイヤーを使用して、アトミックアナリストはチャートをスキャンし、複雑な数学的計算をシンプルなシグナルと色に変換します。これにより、どのような初心者トレーダーでも理解して使用し、一貫した取引の決定を行うことができます。 「アトミックアナリスト」は、新規および経験豊富なトレーダー向けにカスタマイズされた包括的な取引ソリューションです。プレミアムインジケーターとトップノッチの機能を1つの取引戦略に組み合わせ、すべてのタイプのトレーダーにとって汎用性のある選択肢にします。 デイリートレーディングとスキャルピング戦略:高
    Reversal First Impulse levels (RFI)    INSTRUCTIONS        RUS       -       ENG              R ecommended to use with an indicator   -   TREND PRO -  Version MT5 A key element in trading is zones or levels from which decisions to buy or sell a trading instrument are made. Despite attempts by major players to conceal their presence in the market, they inevitably leave traces. Our task was to learn how to identify these traces and interpret them correctly. Main functions: Displaying active zones
    An exclusive indicator that utilizes an innovative algorithm to swiftly and accurately determine the market trend. The indicator automatically calculates opening, closing, and profit levels, providing detailed trading statistics. With these features, you can choose the most appropriate trading instrument for the current market conditions. Additionally, you can easily integrate your own arrow indicators into Scalper Inside Pro to quickly evaluate their statistics and profitability. Scalper Inside
    現在20%OFF! 初心者やエキスパートトレーダーのためのベストソリューション! このダッシュボードソフトウェアは、28の通貨ペアで動作しています。それは私達の主要な指標(高度な通貨の強さ28と高度な通貨インパルス)の2に基づいています。それは全体の外国為替市場の大きい概観を与えます。それは、すべての(9)時間枠で28の外国為替ペアのための高度な通貨の強さの値、通貨の動きの速度と信号を示しています。チャート上で1つのインディケータを使用して市場全体を観察し、トレンドやスキャルピングの機会をピンポイントで見つけることができたら、あなたのトレードがどのように改善されるか想像してみてください。 このインディケータには、強い通貨と弱い通貨の識別、潜在的な取引の識別と確認がより簡単になるような機能が搭載されています。このインディケータは、通貨の強さや弱さが増加しているか減少しているか、また、すべての時間枠でどのように機能しているかをグラフィカルに表示します。 新機能として、現在の市場環境の変化に適応するダイナミックなマーケットフィボナッチレベルが追加され、すでに当社のAdvan
    TPSpro TRENDPRO  - is a trend indicator that automatically analyzes the market and provides information about the trend and each of its changes, as well as giving signals for entering trades without redrawing! The indicator uses each candle, analyzing them separately. referring to different impulses - up or down impulse. Exact entry points into transactions for currencies, crypto, metals, stocks, indices!  -  Version MT5               DETAILED DESCRIPTION                R ecommended to use with
    Enigmera
    Ivan Stefanov
    5 (3)
    エニグメラ:市場の中核 https://www.enigmera.com はじめに このインディケータと取引システムは、金融市場に対する驚くべきアプローチです。ENIGMERAは、フラクタルサイクルを使用して、サポートとレジスタンスレベルを正確に計算します。本格的な蓄積局面を示し、方向性と目標を示します。 トレンド中でも調整中でも機能するシステムです。 どのように作動するのか? ENIGMERAは、支持線・抵抗線、目標線、乖離線の3つのラインで構成されています。このシステムは、過去のデータを現在と未来に外挿する典型的な市場指標とは異なり、現在の完全な画像を提供します。支持線上にある場合、それは本当の支持を意味し、抵抗線上にある場合、それは本当の抵抗を意味する。ある水準が破られた場合、それはトレンドの変化を意味する。再描画はしない。 市場は常に進化しているため、ENIGMERAはその評価ツールを適応させ、定期的に戦略を修正しています。  これにより、すべてのシナリオが徹底的に評価されることが保証されます。この市場指標の独自性は、その能力を見れば明らかです。  ENIGM
    ご紹介   クォンタム トレンド スナイパー インジケーターは 、トレンド反転を特定して取引する方法を変革する画期的な MQL5 インジケーターです。 13年以上の取引経験を持つ経験豊富なトレーダーのチームによって開発されました。     クォンタムトレンドスナイパーインジケーター   は、非常に高い精度でトレンドの反転を識別する革新的な方法で、あなたのトレーディングの旅を新たな高みに押し上げるように設計されています。 ***Quantum Trend Sniper Indicatorを購入すると、Quantum Breakout Indicatorを無料で入手できます!*** クォンタム ブレイクアウト インジケーターは、トレンドの反転を特定するとアラートを発し、矢印を示し、3 つのテイクプロフィットレベルを提案します。 初心者トレーダーにもプロのトレーダーにも適しています。 量子EAチャネル:       ここをクリック MT5のバージョン:       ここをクリック 推奨事項: 期間: すべての時間枠。最良の結果を得るには、
    FX Volume
    Daniel Stein
    4.6 (35)
    mql5と Telegramの モーニング・ブリーフィングで、詳細とスクリーンショットを含む毎日のマーケット・アップデートをご覧 ください! FX Volumeは、ブローカーの視点から市場のセンチメントをリアルに洞察する、最初で唯一の出来高インジケーターです。 ブローカーのような機関投資家が外国為替市場でどのようなポジションをとっているか、COTレポートよりもはるかに速く、素晴らしい洞察を提供します。 この情報をチャート上で直接見ることは、あなたの取引にとって真のゲームチェンジャーであり、画期的なソリューションです。 以下のようなユニークなマーケットデータ洞察から利益を得てください。 比率は 、通貨のロングポジションとショートポジションの比率をパーセントで表示します。 比率の変化は 、選択した期間内のロング比率とその変化率を表示します。 Volumes Totalは 、通貨の取引量(ロングとショート)の合計をロット単位で表示します。 Volumes Long :全通貨のロングポジションの取引量を表示します。 Volumes(ショート )は、全通貨のショートポジションの取引量を表示
    ご紹介     Quantum Breakout PRO は 、ブレイクアウト ゾーンの取引方法を変革する画期的な MQL5 インジケーターです。 13年以上の取引経験を持つ経験豊富なトレーダーのチームによって開発された Quantum Breakout PROは 、革新的でダイナミックなブレイクアウトゾーン戦略により、あなたの取引の旅を新たな高みに押し上げるように設計されています。 クォンタム ブレイクアウト インジケーターは、5 つの利益ターゲット ゾーンを備えたブレイクアウト ゾーン上のシグナル矢印と、ブレイクアウト ボックスに基づいたストップロスの提案を提供します。 初心者トレーダーにもプロのトレーダーにも適しています。 量子EAチャネル:       ここをクリック MT5バージョン:   ここをクリック 重要!購入後、インストールマニュアルを受け取るためにプライベートメッセージを送ってください。 推奨事項: 時間枠: M15 通貨ペア: GBPJPY、EURJPY、USDJPY、NZDUSD、XAUUSD アカウントの種類: ECN、Raw、また
    Indicator : RealValueIndicator Description : RealValueIndicator is a powerful tool designed specifically for trading on the EURUSD pair. This indicator analyzes all EUR and USD pairs, calculates their real currency strength values, and displays them as a single realistic value to give you a head start on price. This indicator will tell you moves before they happen if you use it right. RealValueIndicator allows you to get a quick and accurate overview of the EURUSD currency pair tops and bottoms,
    Thise indicator is up down v6  comes with tradingwiev pinescript. purchased people, after installed on terminal ,contact me on mql5  to get BONUS  TradingView pinescript. up-down indicator is no repaint and works all pairs and lower than weekly time frames charts. it is suitable also 1 m charts for all pairs. and hold long way to signal. dont gives too many signals. when red histogram cross trigger line that is up signal.and price probably will down when blue histogram cross trigger line that
    ECM Elite Channel is a volatility-based indicator, developed with a specific time algorithm, which consists of finding possible corrections in the market. This indicator shows two outer lines, an inner line (retracement line) and an arrow sign, where the channel theory is to help identify overbought and oversold conditions in the market. The market price will generally fall between the boundaries of the channel. If prices touch or move outside the channel, it's a trading opportunity. The
    Gold Channel is a volatility-based indicator, developed with a specific timing algorithm for the XAUUSD pair, which consists of finding possible corrections in the market. This indicator shows two outer lines, an inner line (retracement line) and an arrow sign, where the theory of the channel is to help identify overbought and oversold conditions in the market. The market price will generally fall between the boundaries of the channel. If prices touch or move outside the channel it is a tra
    Gann Signal is a very simple indicator at first glance, but hidden inside is many years of experience in studying W.D.Ganna methods. The indicator gives accurate BUY/SELL signals, without redrawing. The indicator is very easy to use. All you need to do is attach it to your chart and follow its recommendations. The indicator constantly analyzes the market for entry opportunities. When such an opportunity appears, the indicator gives a signal in the form of an arrow. I repeat, all signals are NOT
    Please send me Direct message on MQL5 CHAT after purchasing the Indicator for Training and Installation Support There are some additional files that is important to use with the Indicator . So be sure to contact me after purchasing the Indicator So that I can add you for training and support . If you find any difficulty with installation then send me Direct message here So that I can connect with you via Anydesk or Teamview for the product installation. " Smart Order Block Indicator " to find
    Introduction to X3 Chart Pattern Scanner X3 Cherart Pattern Scanner is the non-repainting and non-lagging indicator detecting X3 chart patterns including Harmonic pattern, Elliott Wave pattern, X3 patterns, and Japanese Candlestick patterns. Historical patterns match with signal patterns. Hence, you can readily develop the solid trading strategy in your chart. More importantly, this superb pattern scanner can detect the optimal pattern of its kind. In addition, you can switch on and off individu
    現在20%OFF! 初心者やエキスパートトレーダーに最適なソリューションです。 このインディケータは、エキゾチックペア・コモディティ・インデックス・先物など、あらゆるシンボルの通貨の強さを表示することに特化したインディケータです。金、銀、原油、DAX、US30、MXN、TRY、CNHなどの通貨の強さを表示するために、9行目にどのシンボルでも追加することができます。独自の機能を多数搭載し、新しい計算式を採用したため、ユニークで高品質、かつ手頃な価格のトレーディングツールとなっています。新しいトレンドやスキャルピングチャンスのトリガーポイントを正確に把握することができるため、あなたのトレードがどのように改善されるか想像してみてください。 ユーザーマニュアル:ここをクリック   https://www.mql5.com/en/blogs/post/708876 すべての時間枠に対応します。あなたはすぐにトレンドを見ることができるようになります! 新しいアルゴリズムに基づいて設計されているため、潜在的な取引の特定と確認がより簡単になります。これは、8つの主要通貨と1つのシンボ
    TrendMaestro
    Stefano Frisetti
    5 (3)
    note: this indicator is for METATRADER4, if you want the version for METATRADER5 this is the link:  https://www.mql5.com/it/market/product/108106 TRENDMAESTRO ver 2.4 TRENDMAESTRO recognizes a new TREND in the bud, he never makes mistakes. The certainty of identifying a new TREND is priceless. DESCRIPTION TRENDMAESTRO identifies a new TREND in the bud, this indicator examines the volatility, volumes and momentum to identify the moment in which there is an explosion of one or more of these data a
    norepaint buy sell indicator is norepaint indicator.and works all pairs and all timeframes. using is wery simple ,it puts arrow on price probably buy sell arrows. thise indicator is suitable for beginner and experienced traders. there is cnt numbers that show how many bars you see the signal back. increasing it possible but up to chart have the how many bars . minimum value of this 500.
    SNR LEVEL INDICATOR Accurate Snr level indicator will only display Fresh Levels that are close to the Current Market Price. This indicator is very accurate in mapping Support & resistance levels. there is an alert feature when the price TOUCHES the SNR LEVEL, WHEN CLOSE CANDLE BREAK/REJECT SNR LEVEL. INDICATOR MARKING :: - SUPPORT LEVEL == V SHAPE - RESISTANCE LEVEL == APEX LEVEL - GAP RESISTANCE & GAP SUPPORT == OPEN CLOSE CANDLE - SUPPORT BECAME RESISTANCE & RESISTANCE BECAME SUPPORT INDIC
    このインディケータは、当社の2つの製品 Advanced Currency IMPULSE with ALERT  +   Currency Strength Exotics . のスーパーコンビネーションです。 このインジケーターは全ての時間枠で作動し、8つの主要通貨と1つのシンボルの強弱のインパルスをグラフで表示します。 このインジケータは、金、エキゾチックペア、商品、インデックス、先物など、あらゆるシンボルの通貨強度の加速度を表示することに特化されています。金、銀、原油、DAX、US30、MXN、TRY、CNHなどの通貨強度の加速度(インパルスまたは速度)を表示するために、任意のシンボルを9行目に追加できる、この種の最初のものです。 新しいアルゴリズムに基づいて構築され、潜在的な取引の特定と確認がさらに容易になりました。これは、通貨の強さや弱さが加速しているかどうかをグラフィカルに表示し、その加速の速度を測定するためです。加速すると物事は明らかに速く進みますが、これはFX市場でも同じです。つまり、反対方向に加速している通貨をペアリングすれば、潜在的に利益を生む取
    The All-in-One Trade Indicator (AOTI) determines daily targets for EURUSD, EURJPY, GBPUSD, USDCHF, EURGBP, EURCAD, EURAUD, AUDJPY, GBPAUD, GBPCAD, GBPCHF, GBPJPY, AUDUSD, and USDJPY. All other modules work with any trading instruments. The indicator includes various features, such as Double Channel trend direction, Price channel, MA Bands, Fibo levels, Climax Bar detection, and others. The AOTI indicator is based on several trading strategies, and created to simplify market analysis. All-in-One
    "The Squeeze indicator attempts to identify periods of consolidation in a market. In general the market is either in a period of quiet consolidation or vertical price discovery. By identifying these calm periods, we have a better opportunity of getting into trades with the potential for larger moves. Once a market enters into a "squeeze," we watch the overall market momentum to help forecast the market direction and await a release of market energy." Modified TTM Squeeze Indicator is a modifica
    これはMT4のインジケーターで、再描画なしで取引に参入するための正確なシグナルを提供します。 外国為替、暗号通貨、金属、株式、インデックスなど、あらゆる金融資産に適用できます。かなり正確な見積もりを提供し、取引を開始して終了するのに最適な時期を教えてくれます。1つのシグナルを処理しただけでインジケーターの元が取れた例の 動画 (6:22)をご覧ください。Entry PointsPro インジケーターの助けを借りたほとんどのトレーダーの最初の1週間の結果が改善しています。 Telegramグループ に登録してください。Entry Points Proインジケーターのメリットは次の通りです。 再描画のないエントリーシグナル 再描画されるインジケーターでは一度表示されたシグナルが削除されて大きな金銭的損失につながることがありますが、これと異なり、表示されて確認されたシグナルは消えることがありません。 エラーなしの取引開始 インジケーターアルゴリズムによって取引を開始する(資産を売買する)理想的な瞬間を見つけることができます。それを使用するすべてのトレーダーの成功率が向上します。
    もちろんです。以下は、提供いただいたテキストの日本語への翻訳です: MT4用の天文学指標をご紹介します:究極の天体トレーディングコンパニオン トレーディング体験を天空の高みに高める準備はできていますか?私たちの革命的なMT4用の天文学指標をご紹介します。この革新的なツールは、複雑なアルゴリズムの力を借りて、類まれなる天文学的洞察と精密な計算を提供します。 あなたの指先で宇宙の情報を: 宝のような天文学的データが明らかになる包括的なパネルをご覧ください。惑星の地理的/太陽中心座標、太陽と地球の距離、星の大きさ、伸び、星座、黄道座標および赤道座標、さらには水平座標まで、それぞれが綿密に計算され美しく表示されています。指標によって生成される垂直線は時間値に対応し、トレーディングの旅に宇宙の視点を提供します。 惑星のラインと関係: グラフを飾る惑星のラインの魔法を体験し、スケールと角度をカスタマイズできます。直感的なコントロールパネルを介して各惑星のラインの表示を簡単に切り替えることができます。指定された時刻範囲内での合会、六分会、四分会、三分会、対会、逆行の指標で天体の関係の芸術を発見してく
    Ace Supply Demand Zone Indicator The concept of supply demand relies on the quantity mismatching between buying and selling volumes in the financial market. Supply and demand zone can provide the good entry and exit. A zone is easier to trade than a line. The supply demand zone can provide the detailed trading plan and the risk management. Its ability to predict market direction is high. There are two distinctive points about Ace Supply Demand Zone Indicator. Ace Supply Demand Zone indicator was
    収益性の高い取引機会を簡単に特定するのに役立つ強力な外国為替取引インジケーターをお探しですか?ビースト スーパー シグナル以外に探す必要はありません。 この使いやすいトレンドベースのインジケーターは、市場の状況を継続的に監視し、新しいトレンドを検索したり、既存のトレンドに飛びついたりします。ビースト スーパー シグナルは、すべての内部戦略が一致し、互いに 100% 合流したときに売買シグナルを発するため、追加の確認は不要です。シグナル矢印アラートを受け取ったら、単に売買します。 購入後、プライベート VIP グループに追加されるようにメッセージを送ってください! (完全な製品購入のみ)。 購入後、最新の最適化されたセット ファイルについてメッセージを送ってください。 MT5バージョンは こちらから入手できます。 Beast Super Signal EA は こちらから 入手できます。 コメント セクションをチェックして、最新の結果を確認してください。 ビースト スーパー シグナルは、1:1、1:2、または 1:3 のリスクと報酬の比率に基づいて、エントリ
    Tradeable Changer Indie
    Opengates Success International
    Tradeable Changer Indie Trade-able Changer Indie is an indicator that serves several purposes. The idea behind this operating indicator is to have a minimal set of indicator or experts on the chart in order to avoid clumsy chart window and at the same time have a great time trading profitably. This is a combination of Symbol/Time-frame Changer and a Trading system based on Trends following. It has a small board to display trade signals for the trader. Due to the nature of these com
    Volatility Trend System - a trading system that gives signals for entries. The volatility system gives linear and point signals in the direction of the trend, as well as signals to exit it, without redrawing and delays. The trend indicator monitors the direction of the medium-term trend, shows the direction and its change. The signal indicator is based on changes in volatility and shows market entries. The indicator is equipped with several types of alerts. Can be applied to various trading
    NAM Order Blocks
    NAM TECH GROUP, CORP.
    5 (1)
    MT4マルチタイムフレームオーダーブロック検出インジケーター。 特徴 -チャートコントロールパネルで完全にカスタマイズ可能で、完全な相互作用を提供します。 -必要な場所でコントロールパネルを表示および非表示にします。 -複数の時間枠でOBを検出します。 -表示するOBの数量を選択します。 -さまざまなOBユーザーインターフェイス。 -OBのさまざまなフィルター。 -OB近接アラート。 -ADRの高線と低線。 -通知サービス(画面アラート|プッシュ通知)。 概要 注文ブロックは、金融機関や銀行からの注文収集を示す市場行動です。著名な金融機関と中央銀行が外国為替市場を牽引しています。したがって、トレーダーは市場で何をしているのかを知る必要があります。市場が注文ブロックを構築するとき、それは投資決定のほとんどが行われる範囲のように動きます。 注文の構築が完了すると、市場は上向きと下向きの両方に向かって急激に動きます。注文ブロック取引戦略の重要な用語は、機関投資家が行っていることを含むことです。それらは主要な価格ドライバーであるため、機関投
    作者のその他のプロダクト
    TradingInfo
    Paul Reymkhe
    4.67 (9)
    TradingInfo shows you detailed Information about your Account. It also shows you your Profit, Trades, Ratio and the Spread of current Chart. With integrated function "Draw Profit" you will get all your Orders drawn with Profit on the Chart. You can use it on any Chart and any Timeframe, also for manual Trading or an EA. With this powerful Tool you have a great overview of your Account. TradingInfo Inputs Menu Background color - the color of menu Manu Label color - the color of the font Menu in
    FREE
    SpreadLive
    Paul Reymkhe
    4.67 (3)
    SpreadLive shows the full Spread history of a chart with different colors. It alerts you (MT4, E-Mail and Mobile) when the spread reaches the limit, which you can define in the settings. The menu contains Current Spread , Average Spread and Highest Spread of current chart. The main idea is to use it with an EA and analyze negative profits from the spread history. This helps you to see how your broker varies the spread. Inputs Spread limit - limit to alert. Type - Show in points or pips. Alert:
    FREE
    Take Your Trading Experience To the Next Level ! and get the exclusive TFSR-Analyzer for free !    So you have all these outstanding features  on up to 20 symbols and all timeframes in a smart and clear Design. Correct identification of the trends  in stock investments are pivotal and TrendFollowerSR ensures this perspective while displaying the correct trend on multiply timeframes to help you go long way as much as possible. The latest technology of the Indicator enables to track whether if
    DailyBreakouts is the perfect tool for traders who use the breakout strategy! First, DailyBreakouts analyzes the last day; then, the beginning of the new day. After that, it gives you the signal for the breakout . With the integrated menu, you have the perfect overview of the pips, breakout zones, stop loss, and take profit. DailyBreakouts works on M30 and H1 timeframes, because it gives you one signal per day - so it is pointless to use lower or higher timeframes. To improve results, you can co
    BreakoutSR shows you possible breakouts for current/following day . With integrated Support and Resistance lines and a menu you have a better overview of the chart. If the candle closes above "LONG" go long , if the candle closes below "SHORT" go short . Same is for SHORT/LONG Breakouts. Quick and easy to understand - tool, perfect for all types of traders. BreakOutSR Inputs MT4 Alert - Alerts you on ur MT4 Terminal Broker GTM - your Broker GTM BreakOuts: Draw Breakouts - Draw the Breakout lin
    PROvolumes is the tool for traders who trade on lower Timeframes such as M1 and M5. The Indicator is based on serveral Oscillators with Multitimeframe Trendfilters - The entries in the Market are really tight by this Indicator. It gives you visual view of the Signalratio for current Chart and Timeframe and will also notify you when it's time to go long or short. For maximum Profit you can use our top Trendindicator TrendFollowerSR to get even better Winrate. You don't need to configurate PROvolu
    IPRO Zar EA
    Paul Reymkhe
    3.31 (13)
    ATTENTION :  Since 30.11.2022 the strategy has been revised from scratch - therefore a completely new  strategy . It took us over a year to finally come up with a reasonable strategy, since the old one didn't work. We apologize for this long delay. MT5 Version : IPRO Zar MT5 Live Signals:   IPRO Zar 150 multi IPRO Zar 200 IPRO Zar default The main idea was to make as much profit as possible with the EA over a not too long period and to withdraw it again and again - but in the end the EA can
    N9Tx EA
    Paul Reymkhe
    3.08 (13)
    2 copies left - next price 799$ . The price will be increased until it reaches the final price. Please contact us after purchase so that we can give you the necessary Set Files and invite you to our  VIP group . N9T  is an innovative Night-Scalping EA. The main strategy is from   PROscalper supplemented by  TrendFollowerSR   and DailyBreakouts  with several additional filters. The EA does not  use grid ,  martingale  or other  dangerous strategies . Fixed stoploss and take profit are a part
    2 days left - next price 699$ . The price will be increased until it reaches the final price. Please contact us after purchase so that we can give you the necessary   Set Files   and invite you to our  VIP group . N9T  is an innovative Night-Scalping EA. The main strategy is from   PROscalper   supplemented by  TrendFollowerSR   and   DailyBreakouts  with several additional filters. The EA   does not  use grid ,  martingale  or other  dangerous strategies . Fixed stoploss and take profit ar
    Live Signals:   IPRO Zar 150 multi IPRO Zar 200 IPRO Zar default The main idea was to make   as   much profit   as possible   with the EA over a not too long period and to   withdraw   it again and again - but in the end the EA can do   both . IPRO Zar   is able to generate   smaller profits   in the   long term   and thus let the account grow slowly. It is also   possible   with the EA to   achieve   large  profits   in the short term, but with a   very high risk . EA looks for   pull backs  
    フィルタ:
    Don Calito
    945
    Don Calito 2022.11.18 04:44 
     

    Not a good indicator its literally like throwing dice or flipping a coin..... it's not consistent you win 1 you lose 2, you win 2 you lose 2 and it keeps repeating this type cycle. Been testing for 2 months on demo before leaving this review and find this indicator signals extremely poor and unreliable for serious trading. The author knows fully well the indicator triggers a lot of false signals, this is why he cleverly wants you to purchase another indicator of his with the excuse it will improve results.... Definitely Not recommended!

    ROBERT EDWARD BIRD
    2098
    ROBERT EDWARD BIRD 2022.11.07 01:50 
     

    I found this system to not be very accurate at all. Signals are poor and most end up in loss. I found that the TrendfollowerSR to be 5 star though. This one? I wish there was a money back button.....

    TheFXChamp
    366
    TheFXChamp 2021.06.25 00:17 
     

    This system is a buried treasure! I only trade XAUUSD and it solved my 1year old problem I love how it works most excellent product. The pip counter is off a bit but it's not a big deal to me. I will send you message in regards to the SR Breakout using Camarilla levels we need to discuss business.

    bouledefeux
    667
    bouledefeux 2021.03.19 06:48 
     

    One of the, or the best indicator in his speciality. A Great Thank. 🙏

    maggie1234588
    61
    maggie1234588 2020.04.14 22:11 
     

    ユーザーは評価に対して何もコメントを残しませんでした

    rainwalker123
    3362
    rainwalker123 2019.04.04 09:03 
     

    I really dont understand the reviews with 1star.

    Those bad reviews just from people, who dont have a clue about trading.

    Oustanding scalper, and easy to handle. You can customize the indicator to your trading needs.

    10 stars

    kalinkus
    69
    kalinkus 2019.01.05 12:21 
     

    ユーザーは評価に対して何もコメントを残しませんでした

    max.pleasu
    70
    max.pleasu 2018.12.30 10:34 
     

    ユーザーは評価に対して何もコメントを残しませんでした

    trader7771122
    68
    trader7771122 2018.12.29 10:37 
     

    ユーザーは評価に対して何もコメントを残しませんでした

    Dmitriy Karev
    218
    Dmitriy Karev 2017.12.05 09:23 
     

    Ребята я это индикатор купил 2005 году )) И только сейчас я вспомнил про его существование ... Буду работать ))

    Jaric Terios
    53
    Jaric Terios 2017.03.05 17:14 
     

    ユーザーは評価に対して何もコメントを残しませんでした

    thungjing
    34
    thungjing 2017.03.05 17:13 
     

    ユーザーは評価に対して何もコメントを残しませんでした

    daily_trader
    79
    daily_trader 2017.03.05 17:12 
     

    ユーザーは評価に対して何もコメントを残しませんでした

    CGT
    179
    CGT 2016.06.09 10:34 
     

    One of the worst indicators that I bought

    mexxlabel
    575
    mexxlabel 2016.03.05 09:43 
     

    a giant indi in combination with TrendfollowersSR

    Preeda Boonkhun
    2467
    Preeda Boonkhun 2015.08.18 21:06 
     

    Very good

    Xiaolei Liu
    449
    Xiaolei Liu 2015.08.03 04:44 
     

    I bought this indicator, but I feel bad, can I have a refund?

    SkystheLimit 986
    4837
    SkystheLimit 986 2015.07.13 12:00 
     

    Excellent indicator!!! Paul is one of the very best! Well done!!

    レビューに返信
    バージョン 1.80 2020.04.12
    Changes:
    - New Menu
    - Code fix
    - Status new feature for next Signal
    バージョン 1.60 2019.01.09
    - Changed the Menu-Background
    - Added Mobile Alert for SL and TP
    バージョン 1.50 2015.12.10
    Improved the code, made small changes in the Algorithm.
    バージョン 1.40 2015.08.17
    - Improved the pips calculation and the history
    バージョン 1.30 2015.08.13
    - Improved pips calculation
    バージョン 1.20 2015.08.12
    - Minor fixes
    - Added a button to look back in the history. To see how many pips made with the settings.
    バージョン 1.10 2015.07.09
    Fast update on request:
    - added Alert function for the Stop Loss and Take Profit