YouTubeにあるマーケットチュートリアルビデオをご覧ください
ロボットや指標を購入する
仮想ホスティングで
EAを実行
EAを実行
ロボットや指標を購入前にテストする
マーケットで収入を得る
販売のためにプロダクトをプレゼンテーションする方法
MetaTrader 5のための有料のエキスパートアドバイザーとインディケータ - 97
Description: - Chart Time + Indicator is very simple and easy, but it can be very important to control the time before opening any manual trade. This indicator shows the time in a panel between 3 different options. Can be possible to move the panel with mouse or with fixed coordinates on the chart. Input Parameters: - Local Time : Enable Local Time if you want to show it (Personal Computer Time). - Server Time : Enable Server Time if you want to show it (Broker Time). - GMT Time

Description: - We all want to have the lowest spread and never high, with this utility we can have more information and a clearer idea of when the spread is acceptable or not. The Panel InfoSpread is a utility expert advisor and shows information on different spread options in one or more symbols, can be actual spread, average, minimum, maximum and tick counter. Read and show the symbols that are in the Market Watch window. Also you can put a maximum limit of average spread in every symbol f

BeST_Darvas Boxes is a Metatrader Indicator based on the trading method developed in the 50’s by the Hungarian Nicolas Darvas . BeST_Darvas Boxes indicator draws the Top and the Bottom of every Darvas Box that can be confirmed on the current Chart draws Buy and Sell Arrows for every confirmed Upwards or Downwards Breakout of the above levels draws always only after the bar closing and so is non-repainting or backpainting it can be used as a standalone trading system/method
Inputs
Basic Sett
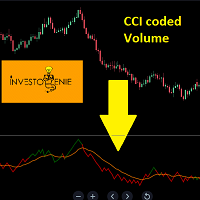
The Indicator is based on Commodity Channel Index (CCI) coded on Volume. The concept is to try and analyze the movement of Volume and Price in a certain direction
Concept:
If the Price of the indicator moves below the threshold price, it turns RED indicating the direction downwards is getting strong.
If the Price of the indicator moves above the threshold price, it turns GREEN indicating the direction upwards is getting strong.
The moving average acts as a great filter to decide entry/exi

Day Channel インディケータは、設定で設定された古い期間のバーの極値レベルに基づいて構築されたチャネルを描画し、終値のレベルも表示します。インジケーターが正しく機能するためには、インジケーターが設定される現在の期間が、インジケーター設定で指定された期間よりも短い必要があります。 インジケーター設定の説明: TimeFrame-インジケーターレベルをプロットするための期間の選択。デフォルトでは、日次チャート期間が設定されています。 LevelClose-古い期間の終値レベルの表示を有効または無効にします。 Bar_Limit-指定された数のバーでのインジケーター表示の制限。= 0の場合、使用可能なすべてのバーに表示されます。

Pivots Points are significant levels traders can use to determine directional movement, support and resistance. Pivot Points use the prior period's high, low and close to formulate future support and resistance. In this regard, Pivot Points are predictive and leading indicators. Pivot Points were originally used by floor traders to set key levels. Floor traders are the original day traders. They deal in a very fast moving environment with a short-term focus. At the beginning of the trading day,

This indicator uses VWAP and projects this VWAP into up to 3 levels, shifted by a percentage of the chart's symbol.
How to configure: Choose the symbol and desired graphic time Set the start time of the symbol (in bovespa, WIN and WDO start at 9 o'clock). This time is used as the cutoff reference for VWAP. Check which VWAP period fits the chart better: Ideally, a period when VWAP is not too distant from the chart Set percentage levels: Ideally, you should set levels based on history, so that l

The FourierExtrapolationMA indicator transforms and extrapolates the Moving Average function by the Fast Fourier Transformation method.
1. The transformation period is set by two vertical lines, by default the first blue line and the second pink.
2. By default, the Moving Average (MA) line is drawn in red.
3. By Fourier Transform, the indicator builds a model of N harmonics, which is as close as possible to the MA values. The model is drawn by default in blue over the MA for the period bet

The principle of construction - on top of any number of bars set by the user, a channel is constructed with maximum and minimum lines so that the bars touch the maximum and minimum of the channel at exactly three points. The name of the indicator follows from this principle. Both vertical lines can be moved along the graph by the user, thus specifying the period on which the channel is built. After a specified period, channel rays are drawn that define a channel in which the price can move.

Deposit Supercharger: Optimized Trend Indicator This indicator is based on three technical analysis indicators and two filters, providing more accurate signals. Description: Technical Indicators: The indicator operates based on three technical analysis indicators that help determine the trend direction and potential reversal points. Filters: To filter signals, it uses the price highs and lows from the last two days (support and resistance levels) and a volume indicator, which enhances the signa

Trailing Stop Universal MT4 / MT5 utility is a multifunctional tool for protecting floating profit on open positions and reducing possible risks in trading. To realize these goals, the tool offers the user the following features. Breakeven function - transfers a position to breakeven when the profit of the position allows it. If this function is enabled and the conditions of its operation are met, it moves the StopLoss order to the opening price of the position or even to the profitable

This positions risk visualization indicators, indicators allow you to clearly know how much price go back will be generated account Stop Out. This is a very useful indicator for Controlling Risk when account is open positions, attach this indicator to the chart of the open positions, the indicator will draw a Line Of Stop Out Price on the chart, and output Stop Out Point Value in the upper left corner. Stop Out Price can give you clearly know what price is Account Stop Out, can giv

While you are trading, Auto StopLoss Premium doing all the routine work. "Must have" for scalping. Best way to save account balance in case of force majeure.(Internet connection loss, power outage, sharp change in price direction) The Utilite automatically adds a stop loss to open and pending orders that have no stoploss set. Also adds a take profit. The anti-requote system is built into the Utilite. That means the stop loss will be registered anyway! In the settings you can set any stop los

While you are trading, Auto StopLoss Defender doing all the routine work. "Must have" for scalping. Best way to save account balance in case of force majeure.(Internet connection loss, power outage, sharp change in price direction) The Utilite automatically adds a stop loss to open and pending orders that have no stoploss set. The anti-requote system is built into the Utilite. That means the stop loss will be registered anyway! In the settings you can set any stop loss begin from 0.0001 (If yo
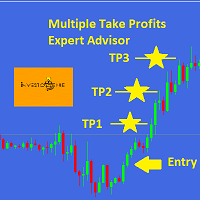
This EA is designed for MULTIPLE TAKE PROFITS options based on User's order management.
ABOUT EXPERT ADVISOR:
The expert advisor is designed to help user take multiple profits on single order. The multiple take profits can be allocated a fixed percentage based on user's preferences. The user is required to set an entry level in price and set target percentages and target prices. The stop loss and price to close options helps user in risk management.
ADVANTAGES:
Option of Taking Profits

TeaCii trend is a LEADING NON-LAG indicator to trade Ranged Markets or Breakouts. The indicator marks support and resistance at the moment they are formed . It has only one setting for the ATR. We recommend leaving default.
This is not an indicator that draws lines from the highs or lows and regards them as SR. It creates actual SR levels way before the market even shows the level as SR. Often 5 to 10 candles before the naked eye can see it. Look at the first dot and know that SR was declared

Панель предназначена для быстрого визуального нахождения и отображения внешних баров по всем периодам и на любых выбранных валютных парах одновременно. Цвет сигнальных кнопок, указывает на направление паттерна. По клику на сигнальную кнопку, осуществляется открытие графика с данным паттерном. Отключить не используемые периоды, можно кликом по его заголовку. Имеется поиск в истории (по предыдущим барам). Прокрутка (scrolling) панели, осуществляется клавишами "UP" "DOWN" на клавиатуре. Имеется Pus

The utility is entended for preparing information for the Sprint EA . Preparing information for different financial instruments needs the EA to be attached to a chart of the corresponding financial instrument. The EA prepares information in online mode only. Input Parameters Symbol Name - name of financial instrument of the chart the EA is attached to. Connection Control - control of disconnections with the trade server: true - enable. false - disable. Send Mail - send an e-mail notification abo
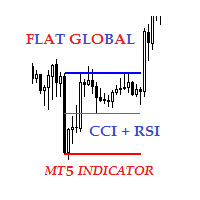
Description The indicator of local flat for CCI and RSI indicators. Users can select financial instruments. The indicator allows to find local flats in the following options: Width of channels that is not more than certain range Width of channels that is not less than certain range Width of channels that is not more and not less than certain range The indicator displays the middle and boundaries of the channel.
Purpose
The indicator can be used for manual or automated trading within an Exper

Introduction This indicator detects volume spread patterns for buy and sell opportunity. The patterns include demand and supply patterns. You might use each pattern for trading. However, these patterns are best used to detect the demand zone (=accumulation area) and supply zone (=distribution area). Demand pattern indicates generally potential buying opportunity. Supply pattern indicates generally potential selling opportunity. These are the underlying patterns rather than direct price action. T

Simple WhiteRegr expert, minimum parameters. Advanced development of the White bot. The principle of operation is to monitor the market using two channels of the regression indicator. Open orders as often as possible with a given step in increments. Thus, the position is constantly changing in the wake of the market. Extremely reliable strategy, the leader of all created by the author of strategies for reliability. Compared with the previous version, forecasting is much better. It gives very goo

Very simple White expert, minimum parameters. The principle of operation is to follow the market. Open an order as often as possible with a given step in increments. Thus, the position is constantly changing in the wake of the market. Extremely reliable strategy, the leader of all created by the author of strategies. It gives very good results when used in a multi-currency mode. Profit for one pair is not big but good forecasting is very clearly seen. Accordingly, in such conditions, when using
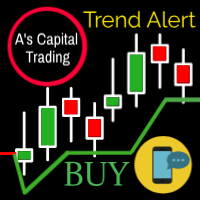
A's Capital Line is a complex algorithm that detects 100% of the trends .
This line marks the following information: The entrance to the trend. Stop of loss. Supports and resistances. When to take Profit.
Send alerts to your cell phone through metatrader It works perfect on any instrument (stocks, forex, crypto, commodities, indices, etc). Also in any time frame to adjust to any trading style. Please see Screenshots for examples and Follow us on instagram. Image 1 Line settings are difere
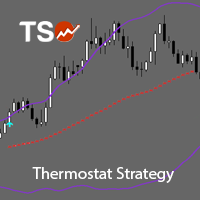
TSO Thermostat Strategy is an indicator that can adapt to the current market conditions by switching from a trend-following mode to a short-term swing mode, thus providing the best possible entry/exit signals in any situation. It is based on the Thermostat Trading Strategy as presented in the book Building Winning Trading Systems with TradeStation by G. Pruitt and J. R. Hill. Strategy The Thermostat Strategy uses different entry and exit conditions based on the current situation of the market

This EA take advantage from great markets movement by setting up pending orders on support and resistance lines, after that it wait the market movement to fill these orders, if it don't the EA deletes them and creates another pending orders. This system don't use grid neither martingale. It is simple and pure TakeProfit and StopLoss, and it has virtual trailing stop to mask trailing stop from server. It don't need to worry about news of high impact. It is advisor to use ECN account type with low

Основа работы советника, это увеличение лота и их усреднение, но основное отличие, это пропорциональная торговля. Благодаря этому параметры советника не будут переоптимизированны. Советник торгует одновременно в обе стороны, без индикатора. Самая важная информация о работе выводится на график. Главное правило- это правильно оптимизировать советник. Покупки и продажи оптимизируются отдельно, для этого следует выключить LONG TRADES OPEN или SHORT TRADES OPEN. Начинать оптимизировать советник на

This utility ensures a real-time synchronization of multiple charts. Any event of a graphical object creation/modification/deletion, chart scrolling and zooming is copied from the current source chart to one or more receiving charts. Note: demo-version of this product doesn't work in the backtester! ______________________________________________________________ Settings: Synchronize with - select the receivers: Same symbol - all charts with the same symbol; Same symbol - all charts with the same
Данный софт позволяет вам управлять своими параметрами риска и мани менеджмента. Вы можете задавать параметр риска как на текущий капитал, так и на предполагаемый уровень депозита, что позволит контролировать риски в каждой сделке и в каждом активе. Open order script также позволяет задать фиксированный объём открытия операций и вести торговлю «в один клик» благодаря реализации дополнительных кнопок Sell / Buy непосредственно на график. Особенность скрипта
Ключевой особенностью и характеристи

Технический индикатор Universal Oscillator является комбинацией торговых сигналов самых популярных и широко используемых осцилляторов. Индикатор представлен гистограммами, а также линиями fast и slow MA, что позволяет расширить список получаемых торговых рекомендаций и работать как по тренду, так и в боковом движении рынка. Таким образом, гистограммы позволяют определить момент пробоя ценовых значений и движение в новой фазе рынка, а линии указывают на зоны перекупленности и перепроданности. Ос

Технический индикатор Price Channel & Bollinger Bands является комбинацией двух наиболее популярных канальных индикаторов. Данный индикатор отображает моменты пробоя как каждого канала по отдельности, так и генерирует сигналу в момент одновременного закрытия цен за линиями поддержки/сопротивления. Каждый пробой подсвечивает свечу определенным цветом, что позволяет убрать линии для более комфортной работы с графиком. В случае одновременного пробоя PC и BB, индикатор также отобразит необходимый ма

Технический индикатор Bollinger Bands классически отображается двумя линиями, которые демонстрируют отклонение котировок от МА 20. Для этого используется стандартное отклонение, параметр которого собственно и задаёт динамику двум полосам. Так как индикатор отображает момент повышенной волатильности на рынке, закрытие котировок за полосами свидетельствует об импульсном направлении рынка или же выхода с длительной зоны проторговки. Таким образом, работа на пробой позволяет войти в момент отклонени

Технический индикатор Angry Alligator является расширенной авторский интерпретацией индикатора от B. Williams’а. Данный индикатор имеет такие же принципы работы, что и классический индикатор Alligator и основан на тех же параметрах. Ключевым отличием и преимуществом данного индикатора заключается в том, что в нем реализован дополнительный торговой сигнал в виде ещё одной линии. Продолжая тему B. Williams’а сигнал отображает «укус» котировок индикатором - Alligator’s Bite. Дополнительный параметр

LinLit mq5 EURAUD is fully automated EA. The input parameters are optimized for EURAUD - M15 time frame We use, Envelopes, Volumes and Money Flow Index indicators EA NOT use Martingale, GRID, Averaging and other dangerous strategies! Full compliance with the FIFO method! Recommendations EA Settings : Use default settings. Symbol : EURAUD. Time Frame : M15. Brokers : ECN brokers, low spread/commission, 1:400 leverage Minimum Deposit : $200 USD.
Parameters Entry lot size : Initial lot siz

LinLit mq5 AUDCAD is fully automated EA. The input parameters are optimized for AUDCAD - M15 time frame, But can also work on other pairs, and CFD's and time frames We use, Directional Indicators and Bollinger Bands indicators EA NOT use Martingale, GRID, Averaging and other dangerous strategies! Full compliance with the FIFO method! Recommendations EA Settings : Use default settings. Symbol : AUDCAD. Time Frame : M15. Brokers : ECN brokers, low spread/commission, 1:400 leverage Minimum

LinLit mq5 GBPUSD is fully automated EA. The input parameters are optimized for GBPUSD - M15 time frame, But can also work on other pairs, and CFD's and time frames We use, Bollinger Bands and Stochastic indicators EA NOT use Martingale, GRID, Averaging and other dangerous strategies! Full compliance with the FIFO method! Recommendations EA Settings : Use default settings. Symbol : GBPUSD. Time Frame : M15. Brokers : ECN brokers, low spread/commission, 1:400 leverage Minimum Deposit : $2

LinLit mq5 EURUSD is fully automated EA. The input parameters are optimized for EURUSD - M15 time frame, But can also work on other pairs, and CFD's and time frames We use, Commodity Channel Index, Force Index and Standard Deviation indicators EA NOT use Martingale, GRID, Averaging and other dangerous strategies! Full compliance with the FIFO method! Recommendations EA Settings : Use default settings. Symbol : EURUSD. Time Frame : M15. Brokers : ECN brokers, low spread/commission, 1:400 leverag
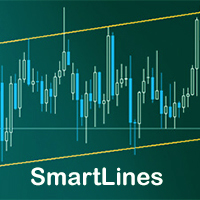
SmartLines allows you to open orders using trend lines. SmartLines for MT4 https://www.mql5.com/ru/market/product/25875
Now you have the opportunity to control breakthroughs of the trend corridor automatically and without delay. As soon as the price crosses your trend line with your settings, the order is automatically opened. You will not miss the moment of the trend change. The principle of working with SmartLines is similar to placement of pending orders. However, pending orders only have t

This indicator uses volume and volatility information to indicate the trend or to indicate the market reversion/correction. There are 2 indicators in one. The indicator works in two styles: values per candle and accumulated values. Using the volume and volatility information, when well adjusted, this indicator has a good probability to indicate the right direction, both in lower (M1, M2, M5) and higher (M15, M30) timeframes.
Strategy 1: Trend indicator Indicates the operation direction. To u

Swing Points are those places on the chart where price changes direction. This is an MT5 version of my MT4 Swing Points Indicator. Found on the code base at https://www.mql5.com/en/code/15616 and in the market at https://www.mql5.com/en/market/product/22918
The beginning input parameters allow you to configure your alerts. Turn on screen alerts allows you to turn on and off screen alerts. True is on, false is off. Turn on push to phone alerts allows you to turn on and off push to phone ale

Average True Range. Fully automatic. Calculates last candle high and low for finding trends. Strong results with british pound in daily charts. Uses Atr modificable periods, trailing stop and take profit. Tested in real accounts. Is a great expert advisor with great results. You can choose the risk you want to take. Can calculate automaticaly the total amount of risk for new trades. Tested with 10 years data. Best inputs 1 atr for open, 2 for close. Atr settings to 200.

Description
The base of this indicator is an ZigZag algorithm based on ATR and Fibo retracement. The ZigZag can be drawn like a classic ZigZag or like Arrows or needn't be drawn at all. This indicator is not redrawing in sense that the ZigZag's last shoulder is formed right after the appropriate conditions occur on the market. The shoulder doesn't change its direction afterwards (can only continue). There are some other possibilities to show advanced information in this indicator: Auto Fibo on
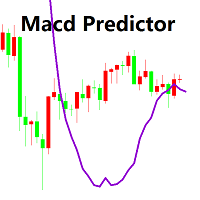
Macdのメインチャートインジケータ
1. MACDが買いから売りに変わる価格を決定することができます。逆も同様です。 これはオシレータの予測子のいとこです。 当時のポジションを知っていれば、正確な価格、現在および次の(将来の)列はMACDクロスオーバに到達する必要があります。 あなたは、現在のポジションが次のMACDクロスオーバーフォースによって助けられたりブロックされたりする前に、市場がどのくらい離れていなければならないかを見ることもできます。 プレディクタはリアルタイムで更新されるため、すべての時間枠でこれを行うことができます。
2. MACD予測変数の履歴を使って価格行動を明確に観察し、棒グラフに直接重ねることで、市場の「動圧」を決定できます。 ダイナミックな圧力とは、信号を売買する市場の反応を指します。 MACDで30分間販売していて、市場が平坦であれば、次の購入信号が簡単に大きな勝者になることがわかります! これは私がよく標準MACDで行うことですが、今は見やすいです! input: Fast EMA - period of the fast Moving Av

MA strategies EA is a moving average cross EA that can support multiple MA cross strategies that involve two or three moving averages. Purchasing this EA can save you the time taken to automate your existing MA strategy through coding a custom EA and it also helps you discover profitable moving average strategies as its fully compatible with the strategy tester and all settings are editable. The EA supports both scalping, short term and long term strategies. The various supported settings are ex
The expert allows you to build a trading system based on an arbitrary set of technical indicators MT5. The EA uses the following signals: - OpenBuy / OpenSell - opening positions;
- StopBuy / StopSell - closing positions;
- TakeProfitBuy / TakeProfitSell - get TP levels;
- StopLossBuy / StopLossSell - getting SL levels;
- NoLossBuy / NoLossSell - transfer to the breakeven state;
- MinProfitBuy / MinProfitSell - closing part of a position;
- CancelBuy / CancelSell - allow a repeated signal
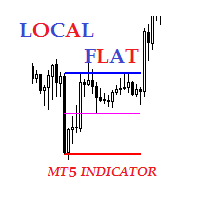
Description The indicator of local flat. The indicator allows to find local flats in the following options: Width of channels that is not more than certain number of points Width of channels that is not less than certain number of points Width of channels that is not more and not less than certain number of points The indicator displays the middle and boundaries of the channel. Attaching multiple instances of the indicator to the chart with different ranges leads to displaying a system of chann
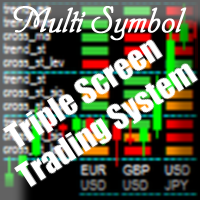
Purpose The indicator is intended for manual multi-currency trading based on the Triple Screen Strategy. It works with any symbols located in the Market Watch window of the MT5: currencies, metals, indexes, etc. The number of instruments can be limited by capacity of the МТ5's parameters. But if desired, you can create several windows with various set of instruments and parameters.
Operation Principle The indicator uses the modified Triple Screen Strategy for determining trend direction in the

The Expert Advisor is a great tool that allows you to control your trade with ease and precision. The tool can be moved in the graphs and offers the following characteristics:
Instant order entry with a single click. Entry of pending orders using price tags and trend lines. Instant order closure with a single click. Instant order closure using trend lines as output levels that the broker can not see. We can modify the way to enter and exit the market, allowing us to choose the way to do it. Fo

Average True Range. Calculates last candle high and low for finding trends. Strong results with british pound in daily charts. Uses Atr modificable periods, trailing stop and take profit. Tested in real accounts. Is a great expert advisor with great results. You can choose the risk you want to take. Can calculate automaticaly the total amount of risk for new trades.

The EA uses economic news trading using low, medium and high news. The EA is set for each piece of news separately. Trading is conducted on 26 currency pairs and 3 timeframes from M5-M30. The EA uses trading on such indicators as CCI, Standard Deviation, Moving Average, Relative Strength Index, Momentum and MACD . The EA looks for small price deviations by indicators and uses 3 types of economic news to confirm the position opening. Adaptive breakeven, trailing stop , and partial position clo

The utility refers to probabilistic analysis tools, in particular the Monte Carlo method. The Monte Carlo method is defined as the simulation of processes in purpose to evaluate their probabilistic characteristics and apply them to the solvable task.
Operation features The simulation uses a tick model with the subsequent transformation to the candles form, as a model as close as possible to the real market process. The utility generates a stream of a random tick sequence until a result with t

This indicator shows the remaining time for the candle to close, even if the price does not change in value, the clock keeps counting backward. You can also program price alert levels using trend lines.
It can be used together with Expert Advisors and other panels, such as Controller without limit MT5
MT4 version
Instructions To set a price alert level, you must draw a trend line. Once the object has been drawn, it must be named so that the indicator recognizes the object. In the

This is a complete and customizable Trading HUD (Head-Up Display) combining all important tools and information for professional trading in one window. Features:
1. Display key indicators that most professionals consider for their trading decisions Current daily, weekly and/or monthly Pivot Points with 7 Levels (PP, S1, S2, S3, R1, R2, R3) Complete history of daily, weekly and/or monthly Pivot Points Current level of exponential moving averages (EMAs) from different timeframes. The User can de

MultiTimeframe (MTF) Support and Resistance Indicator is use to measure last 320 bar (user input) of support and resistance of the dedicated timeframe.
User can attached this indicator to any desire timeframe. Features: User input desire timeframe (default Period H4) User input numbers of last bars (default 320 bars) User input measurement of last HH and LL (default 10 bars) Line styling and colors. MT4 Version : https://www.mql5.com/en/market/product/31984

Market profile was developed by Peter Steidlmayer in the second half of last century. This is a very effective tool if you understand the nature and usage. It's not like common tools like EMA, RSI, MACD or Bollinger Bands. It operates independently of price, not based on price but its core is volume. The volume is normal, as the instrument is sung everywhere. But the special thing here is that the Market Profile represents the volume at each price level.
1. Price Histogram
The Price Histogram

Price action is among the most popular trading concepts. A trader who knows how to use price action the right way can often improve his performance and his way of looking at charts significantly. However, there are still a lot of misunderstandings and half-truths circulating that confuse traders and set them up for failure. Using PA Trend Reversal will be possible to identify high probability exhaustion moves of a trend. Features The indicator gives alerts in real-time when the conditions are me

Renko Graph 練行足グラフ 現在の価格の場所にあるメインチャートウィンドウの練行足インジケーター。 インディケータは、通常の相場チャートの背景に対して、長方形(「ブリック」)の形で価格変動を表示します。設定で指定されたポイント数による価格の上昇は、前の次の長方形の上に追加することによってマークされ、下向きの動きは前の長方形の下に追加されます。 インジケーターは、主なトレンドを視覚的に識別するように設計されています。根底にあるトレンドを平均化する際に、主要なサポートとレジスタンスのレベルを特定するために使用されます。このビューでは、小さな価格変動(「ノイズ」)は考慮されていないため、非常に重要な動きに集中できます。 価格変動が指定されたしきい値レベルを超えた場合にのみ、上または下の新しい指標値がプロットされます。サイズは設定で設定され、常に同じです。たとえば、基本サイズが10ポイントで、価格が20上昇した場合、2つのインジケーター値が作成されます。 インジケーターの利点は、どのレンガでもその形成時間の長さを示すことができることです。価格が範囲内で変動し、成長せず、しきい値の
マスターキットは、既製のEAであなたの戦略が含まれてい
スキャルピング/トレンド/カウンタートレンド/フラット=一つにすべて、唯一の気分!
フォーツと外国為替
EAの可能性は巨大です。 設定の組み合わ
簡単なセットアップでボリュームを増やす複雑で信頼性の高いメインシステムを使用
可能な設定:
方向-購入のみ、販売のみ、またはRSIインジケータによる自動選択の方向 最初の巻 最大取引ロット ボリューム多重度-取引を失うのシリーズの後にボリュームを増加させる回数。 ストップロス Profit factor-数値として設定します。 それが4の場合、SL=100、TP=400です。 増加する取引を失う-SLによって行のどのように多くの取引 損失なしで取引をスキップ-"はい"または"いいえ"の選択。 "はい"オプションが有効になっている場合、トレーリングストップが取引を損益分岐に移動した場合、取引はSLシリーズでは考慮されず、ボリュームを増加 "いいえ"が選択されている場合、いずれの場合でも、SL取引はシリーズでカウントされ、ボリュームが増加します 末

Slick 指標は、取引決定を行うためのアラート信号を備えた二重アイロン相対力指数(RSI)です。インジケーターは価格に従い、その値は0〜100の範囲です。インジケーターの範囲は通常のRSIインジケーターの範囲と同じです。 インジケーター設定の説明: Period_1-インデックスを計算するための期間 Period_2-インジケーターの平滑化の主要な期間 Period_3-インジケータースムージングの2次期間 MAMethod-アンチエイリアシングメソッド AppliedPrice-価格定数 MAX_bound-上位信号ゾーンのレベル MIN_bound-下位信号ゾーンのレベル アラート-カスタムデータを含むダイアログボックスを有効にします Text_BUY-買いシグナルのカスタムテキスト Text_SELL-売りシグナルのカスタムテキスト Send_Mail- [メール]タブの設定ウィンドウで指定されたアドレスにメールを送信します 件名-メールヘッダー Send_Notification- [通知]タブの設定ウィンドウでMetaQuotesIDが指定されているモバイル端末に通知を

WavesTrends このオシレーターは、価格が一定の範囲内で変動する場合に使用される市場指標の1つです。オシレーターには独自の境界(上限と下限)があり、近づくと、市場参加者は売られ過ぎまたは買われ過ぎの市場に関する情報を受け取ります。インディケータは、特定のボラティリティの範囲内で価格変動を登録します。 オシレーターシグナルが価格チャートで確認されると、取引の可能性が高まります。この方向は、オシレーターのいわゆる上部ゾーンと下部ゾーンに反映されます。楽器は買われ過ぎと売られ過ぎの状態に基づいています。これらのパラメータを決定するために、特別なレベルが設定されます。 発振器は本質的に二次的です。これは、主要なツールとしてではなく、分析のための補助的なツールと見なす必要があります。主なパラメータは常に実際の価格変動です。 インジケーター設定の説明: Waves_Period-インジケーターを計算するための主要な期間 Trends_Period-インジケーターを計算するための2次期間 Width_Period-線の間の幅を計算するための期間 ARROW_SHIFT-信号ポイントの垂直

BinaryPinMt5 is an indicator developed and adapted specifically for trading short-term binary options. The indicator's algorithm, before issuing the signal, analyzes many factors, such as market volatility, searches for the PinBar pattern, calculates the probability of success when making a deal. The indicator is set in the usual way. The indicator itself consists of an information window where the name of the trading instrument is displayed, the probability of making a successful transaction,

The EA uses two strategies, the first trend strategy the second reverse strategy can be enabled or disabled through the settings. The EA has been optimized for the last 10 years. The adviser uses a variety of indicators such as Bollinger Bands , Moving Average , Momentum with different settings for the most accurate signals. To close positions, stop loss and take profit are used, as well as additional methods of order modifications. Very easy to set up, does not require special knowledge. You c

Delta EMA is a momentum indicator based on the changes of closing price from one bar to the next. It displays a histogram of the exponential moving average of those changes, showing magnitude and direction of trend. Positive delta values are displayed as green bars, and negative delta values are displayed as red bars. The transition from negative to positive delta, or from positive to negative delta, indicates trend reversal. Transition bars that exceed a user specified value are displayed in br

Tarzan この指標は、相対力指数の読み取りに基づいています。
速い線は、シニア期間からのインデックスの読み取り値です。たとえば、H4期間からのインジケーターの読み取り値が設定され、インジケーターがM15に設定されている場合、シニア期間の1つのバーに収まるバーの数だけ再描画されます。 、再描画はM15期間で16小節になります。
スローラインは、平滑化された移動平均インデックスです。
インディケータは、設定に応じて、さまざまなタイプのシグナルを使用して取引の決定を行います。 インジケーター設定の説明: TimeFrame-インジケーターが計算されるチャート期間。 RSI_period-インデックスを計算するための平均期間。 RSI_applied-中古価格。 MA_period-インデックス平滑化期間。 iMA_method-アンチエイリアシングメソッド アラート-カスタムデータを含むダイアログボックスを有効にします Text_BUY-買いシグナルのカスタムテキスト Text_SELL-売りシグナルのカスタムテキスト Send_Mail- [メール]タブの設定ウィンドウで指定

Панель предназначена для быстрого визуального нахождения и отображения внутренних баров по всем периодам и на любых выбранных валютных парах одновременно. Цвет сигнальных кнопок, указывает на направление паттерна. По клику на сигнальную кнопку, осуществляется открытие графика с данным паттерном. Отключить не используемые периоды, можно кликом по его заголовку. Имеется поиск в истории (по предыдущим барам). Прокрутка (scrolling) панели, осуществляется клавишами "UP" "DOWN" на клавиатуре. Имеется

Rush Point System
It is a detector indicator of breakage of support and resistance with continuity force.
Operation:
The Rush Point System detects in real time when a buying or buying force exceeds the spread limits in order to consume large quantities of lots placed in the book, which made price barriers - also called support / resistance.
At the very moment of the break, the indicator will show in the current candle which force is acting, plotting in the green color to signal purchasin

Rush Point Histogram Continuity force indicator. Operation: After a breach of support or resistance of an asset, the trader can understand by reading the histogram if such a move tends to continue, thus filtering false breaks or short breaks without trend formation. Through a simple, level-based reading, the trader can make a decision based on the histogram, where: Below 21: No trend formation 21 to 34: Weak trend 34 to 55: Strong Trend 55 to 89: Strong tendency Suggested Reading: Observed disru

Мультитаймфреймовый индикатор показывает спрос и предложение, вырожденный через тиковый объем. Индикатор разделен на 3 зоны. Зона снизу показывает спрос и предложение текущего временного периода. Выше нее располагается значения показывающий таймфрейм старшего периода. В верхней зоне располагается отображение таймфрейма на 2 больше текущего. Пример: основной временной период 1 минута - будет отображаться в нижней зоне индикатора. Выше нее расположится 5 минутный период. В 3 зоне расположится 1

MMM Commodity Channel Index Mapped Timeframe Strategy: The Expert Advisors uses its two built-in CCI indicators in 12 different timeframes to determine the prices trends and calculates the signal to decide to open buy or sell positions; You can define the time period of each day of the week the EA should not trade (the bad time to trade). Usually the period of day when the impact news are published. This way the EA will trade only on good hours. General Inputs Closes orders with any profit of va
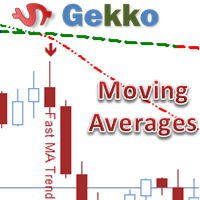
his is Gekko's Moving Averages indicator. It extends the use of the famous moving averages and calculates strong entry and exit signals using Price versus a Fast Moving Average versus a Slow Moving Average. You can set it up in many different ways, eg: price crossing, moving averages crossing, moving averages trend, among others.
Inputs Number of Bars to Plot Indicator: number of historical bars to plot the indicator, keep it low for better performance; FAST Moving Average Details: settings f

The indicator Universal Separate Window MT5 works according to your rules. It is sufficient to introduce a formula, along which the line of the indicator will be drawn.
This indicator is intended for use in the separate chart window.
All indicators of the series Universal :
Main window Separate window Free MT4 Universal Main Window Free MT5 Universal Main Window Free MT5 MT4 Universal Separate Window Free MT5 Universal Separate Window Free MT5 Full MT4 Universal Main Window MT5 Universal Ma
MetaTraderマーケットが取引戦略とテクニカル指標を販売するための最適な場所である理由をご存じですか?宣伝もソフトウェア保護も必要なく、支払いのトラブルもないことです。これらはすべて、MetaTraderマーケットで提供されます。
取引の機会を逃しています。
- 無料取引アプリ
- 8千を超えるシグナルをコピー
- 金融ニュースで金融マーケットを探索
新規登録
ログイン