Robots comerciales e indicadores de pago para MetaTrader 5 - 97

ScalpingProMt5 is a new indicator for professional traders. The indicator is a ready-made scalping strategy. The algorithm calculates a micro trend, then searches for price roll-backs and forms a short-term trading signal according to the market price. The indicator consists of a data window and a graphical signal on the chart in the form of an up or down arrow. The data window displays the current trading symbol, spread and appropriate trader's actions: WAIT, SELL and BUY .
Advantages the ind

This long-term trading system works on 9 pairs and timeframe. The Expert Advisor uses various trading systems, such as trend trading, counter-trend trading and others. The EA has the built-in smart adaptive profit taking filter. The robot has been optimized for each currency and timeframe simultaneously. EA uses economic news. No martingale, grid and other risky strategies. EA uses timeframes:
MetaTrader 4 MetaTrader 5 M5, M15, M30, H1 M2, M3, M4, M5, M6, M10, M12 , M15, M20, M

DAR Portfolio Modeller Expert Advisor forms an investment share portfolio. Its model is based on two key indicators of any financial instrument - profitability and risk that are both quantified. According to the model, the profitability is a mathematical expectation of profit, while risk is defined as a profitability distribution near the mathematical expectation and calculated using the standard deviation. Unlike other similar programs, you do not have to manually download history and insert it

Fibonacci decorator is a unique product that decorates Fibonacci objects. This indicator can change the specific level line of a Fibonacci object. This tool caters to both beginners and advanced traders using Fibonacci objects.
Advantages Supports three Fibonacci objects: Fibonacci Retracement Fibonacci expansion Fibonacci time zones Just add the mark of your choice to the description of a Fibonacci object's level Easy setting This indicator does not work well with Strategy Tester. Please down

The BuySellArrows is an indicator without any input parameters. This makes it an easy-to-use trend trading indicator for beginners, advanced and professional traders. The main purpose of this indicator is to detect and mark (with arrows) a local trend, which is one of the most important problem for a trader regardless of their trading style. The main coding algorithm inside the indicator is calculating the speed and direction of the price change. This indicator will show Buy (color Aqua) or Sell
TSI - Trend Semaphore Indicator
Work tool developed to display the force of movement. This tool was developed for Trend Following strategies. Recommended for all types of traders. Can be used in any instrument and market. Can be used in any period of time. Trend indication using multicolored candles.
New trend A new trend is signaled by the changing colors on the chart's candles. The indicator indicates the upward trend with the green color, the downward trend by the red color and weak moveme
This indicator calculates and draws lines over the chart. There are two types of channels: Channel A: the mainline is drawn using local lows for uptrends and local highs for downtrends Channel B: the mainline is drawn using local highs for uptrends and local lows for downtrends The parallel lines of both types are built using the max. fractal between the base points of the mainline. There are a few conditions, which have to be fullfilled and can be changed by the parameters (see also picture 4):

Displays multiple indicators, across multiple timeframes and symbols to give a comprehensive overview of the market. Uniquely, the indicators are configurable and can include custom indicators, even those where you just have the ex4 file or those purchased from Market. Standard indicators can also be selected, the default being ADX, CCI, market price above/below Moving Average (MA), Moving Average Cross (MAX), MACD, Momentum (MOM), OsMA, RSI, Parabolic SAR, William's Percentage Range (WPR). Use

Maintaining a trading log allows you to save all your market entries and exits. Perhaps, your terminal can do this for you. Order Viewer displays trades from your trading log on the chart at any moment. You can share this log with your friends to show your trading and see how others trade. The entries format in your trading log should be as follows: YEAR-MM-DD HH:MM:00.000 TICKER SIZE PRICE Below is the sample log in the Excel table ( saved as a csv file ): Date and time
Symbol Position
Price
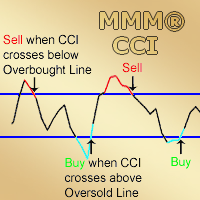
MMM Commodity Channel Index Strategy: The robot uses its two built-in improved and tested CCI indicators to determine the prices trends and calculates the signal for buying or selling. It sends an order, closes or moves the Trailing Stop loss position as the indicator works. Perfect for scalping. It will not send an order unless the calculations determine a good trend of profit. Like all MMM products, it is also programmed to minimize your losses and protect your money from the hostile market. W

When using CCI (Commodity Channel Index) oscillator, the waiting time till the next signal can be long enough depending on a timeframe. CCI Alerts indicator prevents you from missing the indicator signals. It is a good alternative for the standard CCI indicator. Once there appears a CCI signal on the required level, the indicator will notify you with a sound or push, so you will never miss an entry. This is especially significant if you follow the indicator in different timeframes and currency p
The EA is recommended for trading AUDUSD timeframe M5 or M15. It is based on the strategy of "waiting out", the market entry (and exit) points are determined on the basis of correlation of a number of indicators. The trading volume for opening a position depends on results of previous trades. It is possible to limit the amount of risk (the AutoMM parameter). It is also possible to set the maximum spread, above which the EA will automatically suspend trading (the MaxSpread parameter). It also hav

Operation principles For the Expert Advisor operation, it is necessary to configure three parameters in accordance with recommendations. The EA works on any timeframe and symbol. The EA analyzes the movement of price beyond a set formed price range, the movement speed and the trend. A position is opened when necessary conditions occur.
Parameters Сurrency pair . Recommended values for symbols: five-digit EURUSD in the format 1.00001 – 1, four-digit EURUSD in the format 1.0001 – 2; five-digit G
The EA is recommended for trading USDJPY M5. It is based on the strategy of "waiting out", the market entry (and exit) points are determined on the basis of correlation of a number of indicators. The trading volume for opening a position depends on results of previous trades. It is possible to limit the amount of risk (the AutoMM parameter). It is also possible to set the maximum spread, above which the EA will automatically suspend trading (the MaxSpread parameter). It also has advanced feature

ReviewCandleChart is a unique product that can verify past price fluctuations using candlestick charts. This indicator accurately reproduces market price fluctuations in the past and can make trading decisions (entries, profits, loss cut) many times so that you can learn the trading faster. ReviewCandleCahrt is the best indicator to improve trading skills. ReviewCandleCahrt caters to both beginners and advanced traders.
Advantages of the indicator This Indicator for verifying price fluctuation

The Expert Advisor has been created for trading on accounts with the deposit of more than $1,000. Uses M1 timeframe. Simultaneously on the recommended pairs: EURUSD, USDJPY, GBPUSD, USDCHF, AUDUSD, USDCAD, NZDUSD, EURAUD, CHFJPY, EURGBP, EURJPY, GBPJPY. Check if your broker supports hedging, since the EA uses hedging based on MACD and RSI. The Expert Advisor enters a position based on MACD and RSI signals. If the price goes in the opposite direction, the EA will open a hedging order and will clo
This utility calculates and draws lines over the chart. There are two types of channels: Channel A: the mainline is drawn using local lows for uptrends and local highs for downtrends Channel B: the mainline is drawn using local highs for uptrends and local lows for downtrends The parallel lines of both types are built using the max. fractal between the base points of the mainline. There are a few conditions, which have to be fullfilled and can be changed by the parameters (see also picture 3):
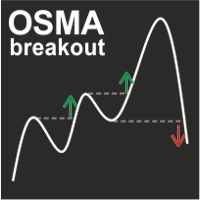
The OSMA Breakout indicator displays the signals that are generated when the previous OSMA extremum is overpassed, while simultaneously creating an extremum point on the price chart. If the extremum of the previous wave was punched, but the price remained in the flat (in the narrow range), then the signal will not be displayed. This approach allows you to reduce the number of false signals in the event of a prolonged trend and the divergence of the indicator. The indicator works on any trading i

The indicator shows the trend of 3 timeframes: higher timeframe; medium timeframe; smaller (current) timeframe, where the indicator is running. The indicator should be launched on a chart with a timeframe smaller than the higher and medium ones. The idea is to use the trend strength when opening positions. Combination of 3 timeframes (smaller, medium, higher) allows the trend to be followed at all levels of the instrument. The higher timeframes are used for calculations. Therefore, sudden change
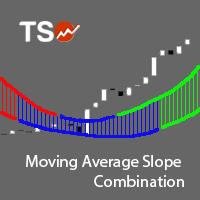
The Moving Average Slope (MAS) is calculated by detecting the moving average level n-periods ago and comparing it with the current moving average level. This way, the trend of the moving average can be drawn on the moving average line. This indicator allows to compare the slopes of two moving averages (fast and slow) to cancel out noise and provide better quality entry and exit signals SCANNER is included . Now with Scanner you can find trading opportunities and setups easily and faster.
Featu

The indicator measures the frequency of incoming ticks to analyze the market activity. Bullish and bearish ticks are analyzed separately, informing about the currently predominant market sentiment. According to observations, an increase in the frequency of ticks (panic) indicates the beginning of strong price changes, and an increase in the frequency of ticks in a particular direction not only accompanies a price change in this direction, but also often anticipates it. The indicator is indispens

This indicator is a multitimeframe trading strategy. It has the levels for stop loss, take profit and entry point. The order level can also be set manually. The indicator uses the regularity of the market, which manifests itself on all instruments, and does not require adjustment of the parameters. The strategy uses a proprietary approach to determining: trend, volatility, hierarchy of timeframe significance, the size of the history period (the number of candles), which is important for making a
Utilidad diseñada para cambiar el instrumento de negociación para los gráficos actuales, todos o seleccionados, el cambio de marco de tiempo y para el movimiento simultáneo en el historial (automáticamente o al hacer clic) en todos los gráficos. La lista de símbolos se lee en el "Resumen del mercado". Puede cambiar el color, el tamaño y la posición de los botones. La sincronización de los gráficos se produce en el momento de la primera barra visible en el gráfico activo cuando hace clic en el b

HeatMap MT5 allows traders to see inside the charts. This indicator plots congestion zones over a certain period of time, known as "Lookback", by analyzing thousand of variables simultaneously. These spots act like strong supports and resistances and now are easy to see. HeatMap MT5 works with all timeframes and all instruments.
Settings Computations - define whether the algorithm works continuously or only at the opening of each candle (default: New Candle). Lookback in Bars - define the peri

ScalperMultiMT5 is a multicurrency indicator for professional traders. The indicator shows the complete market situation for the trader. The main advantage of this indicator is that it simultaneously analyzes six major currency pairs on all timeframes from M1 to MN. The indicator analyzes the trend strength. The indicator generates color-coded signals to visualize the market situation: Green - ascending trend. Red - descending trend. Yellow - trend is not defined. The indicator is excellent for

The indicator trades during horizontal channel breakthroughs. It searches for prices exceeding extreme points or bouncing back and defines targets using customizable Fibo levels with a sound alert, which can be disabled if necessary. The indicator allows you to create a horizontal channel between the necessary extreme points in visual mode quickly and easily. It automatically applies your selected Fibo levels to these extreme points (if the appropriate option is enabled in the settings). Besides

If you would like to trade reversals and retracements, this indicator is for you. The huge advantage is that the indicator does not have input parameters. So, you will not waste your time and will not struggle to change them for different timeframes and symbols. This indicator is universal. The green triangle represents a possibility to go long. The red triangle represents a possibility to go short. The yellow dash represents a "no-trading" situation. This indicator could be used on M1, M2, M3,

This script will show you information about the execution speed of market orders. Instruction 1. Press " File/Open Data Folder " 2. Open the " Logs " folder. 3. Copy the log-files to " MQL5\Files " 4. Run the CheckExec script on EURUSD chart, for example 5. Select parameters: AllOrders - check execution time of all market orders for EURUSD, OpenOrders - check execution time of market orders which where used to open positions on EURUSD, CloseOrders - check execution time of market orders which wh

A must-have tool for any strategy based on divergence detection. 10 different oscillators can be used to detect divergences and can be combined with Double Top/Bottom patterns to confirm reversal signals. SCANNER is included . Now with Scanner you can find trading opportunities and setups easily and faster.
Features Easily detect strong reversal signals. 10 different oscillators are available for divergence detection. Divergence & Top/Bottom detection can operate independently or combined. Get
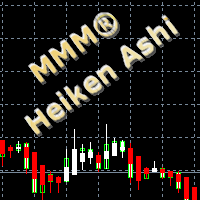
MMM Heiken Ashi strategy: The robot uses its built-in Heiken Ashi improved and tested indicator all the time and does a calculation to determine the prices trends. It sends an order, closes or moves the Trailing Stop loss position as the indicator works. Perfect for Scalping; It will not send an order unless the calculations determine a good trend of profit; Like all MMM products, it is also programmed to minimize your losses and protect your money from the hostile market. We have protections li
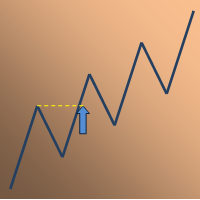
This is a functional extension of the ZigZagLW indicator. It detects the beginning of a new trend signaling of a new indicator line shoulder of a specified level. This is a stand-alone indicator, which means you do not need the activated ZigZagLW indicator for correct operation.
Algorithm logic To understand the logic of the indicator, let's take a look at the screenshots consistently displaying the conditions for the signals formation. The chart has ZigZagLW indicator with the Short_term and

This Expert Advisor has been developed for autonomous automatic trading on EURUSD M15 around the clock. It provides protection of the deposit from significant drawdown and the profitable trade saving mode. Trades using a single deal. With the default settings, it opens one deal per day on average.
How it works It uses a proprietary algorithm that analyzes three indicators and the market direction to make a decision on opening a deal. RSI Stochastic Bands market movement direction It opens an o

The LordRings indicator is a standalone trading system. It is excellent for scalping, short and medium term trading. A distinct feature of this indicator is that is analyzes three currency pairs simultaneously (forming a trading ring) on all timeframes - M1...MN . For each currency pair, it calculates the trend strength - for both ascending and descending trends at the same time. As soon as the trend strength value on all three pairs exceeds the 'signal' value (75 by default), a buy or sell sign

A comprehensive tool for determining the levels of support, resistance, reversals in relation to trading sessions. The indicator's thesis can be expressed as follows: "Support and resistance levels are undoubtedly formed by the psychological barriers of market participants, and influence the further behavior of the price. But these barriers are different for different groups of traders ( One man's meat is another man's poison ) and can be grouped by territory or by the trading time ". Follo

HLC Bar indicator is a market analysis tool. Unlike standard bar chart (Open-High-Low-Close), this indicator shows High-Low-Close prices only. Therefore, trader would focus on key elements of price action. It's very easy to use, no complicated setting, apply to any financial instrument, like Forex, CFD etc. Just open symbol chart, load indicator then enjoy.
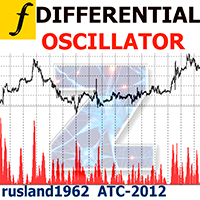
The dream of any trader is to predict the trend reversal point. The Differntial oscillator calculates the differential of the chart of currency pair rates in real time. Thus, it becomes possible to predict the extremes of the live chart and predict the trend reversal points. Using differentiation of the chart in real time significantly facilitates trading, and when used in experts, makes them more efficient and reduces the drawdown. It is very important that the minimum indicator values are used

Are you tired of plotting Fibonacci retracements or extensions manually? This indicator displays Fibo retracements or extensions automatically, calculated from two different price points, without human intervention or manual object anchoring. [ Installation Guide | Update Guide | Troubleshooting | FAQ | All Products ] Easy to use Manual anchoring is not needed Perfect for price confluence studies The indicator evaluates if retracements or extensions are needed Once drawn, you can manually edit t

For any trader, the result of market analysis is the correct identification of the market entry and exit points. The more correctly they are selected, the more profitable the trading. The SmartArrows indicator does not display any excessive information that may distract or confuse the trader, but only the mot important things. The indicator is very simple to use. When a down arrow appears, open a SELL trade, with an up arrow open BUY. Despite its seeming simplicity, the SmartArrows indicator con

FFF Forts is a fully automated trading robot designed to trade on futures on the Russian derivatives market FORTS (RTS, Sberbank, Gazprom, the Ruble, etc.). The robot trades only with the trend. Trade entry occurs on roll-backs. The size of the roll-back is determined manually (in points) or automatically based on the volatility of the instrument.
Settings Type of trade - trade direction Topping up on a trend - enable/disable adding a trend Use Times Filters - enable/disable time limit for tra
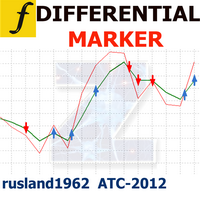
The dream of any trader is to predict the trend reversal point. The Differential Marker indicator calculates the differential of the chart of currency pair rates in real time. Thus, it becomes possible to predict the extremes of the live chart and predict the trend reversal points. Using differentiation of the chart in real time significantly facilitates trading, and when used in experts, makes them more efficient and reduces the drawdown. For a more accurate forecast, it is necessary to optimiz

This indicator combines double bottom and double top reversal chart patterns together with detection of divergences between the price chart and the MACD oscillator.
Features Easily detect strong reversal signals Allows to use double top/bottom and MACD divergence signals combined or independently Get email and/or push notification alerts when a signal is detected Custom colors can be used The indicator is not repainting Can easily be used in an EA (see below)
Inputs ENABLE Double Top - Botto

This indicator combines double bottom and double top reversal chart patterns together with detection of divergences between the price chart and the Momentum oscillator.
Features Easily detect strong reversal signals Allows to use double top/bottom and Momentum divergence signals combined or independently Get email and/or push notification alerts when a signal is detected Custom colors can be used The indicator is not repainting Can easily be used in an EA (see below)
Inputs ENABLE Double Top

Call/Put Ratio is one of the most well-known indicators of the market sentiment. The indicator has been developed by Martin Zweig. It is based on real volumes of the CBOE option market. As we know, a Call option gives its owner the right to buy the underlying asset at a predetermined price. A Put option gives the right to sell it. Thus, increasing volumes for Call options indicate the increasing demand. The growth of Put option volumes shows that supply starts exceeding demand. If we divide the

MetaTrader 4 version available here: https://www.mql5.com/en/market/product/25793 FFx Pivot SR Suite PRO is a complete suite for support and resistance levels. Support and Resistance are the most used levels in all kinds of trading. Can be used to find reversal trend, to set targets and stop, etc.
The indicator is fully flexible directly from the chart 4 periods to choose for the calculation: 4Hours, Daily, Weekly and Monthly 4 formulas to choose for the calculation: Classic, Camarilla, Fibona

If you are using horizontal levels, trend lines or equidistant channels, then this indicator will help you. You do not have to watch charts all the time. Just draw channels and lines and when the price will come close to it, the alert will notify you. You can use as many horizontal levels, trend lines, equidistant channels as you need. There is an option to alert only certain levels on the chart. The indicator is really easy to use. It has a switch button to turn it on and off any time. For bett

What is KTrend indicator ? KTrend is a powerful indicator for trading medium-term binary options that identify the trend of price by candlesticks. Sell signal is formed when the value is below the zero line. Similarly, buy signal is formed when the value is above the zero line. It is separated from KTrend trading system and you can get the backtest result from the pictures below.
TSO Signal Builder MT5 is a MetaTrader 5 Expert Advisor that provides a solid platform to quickly build test and develop automated trading strategies based on indicator signals. Contains 29 indicators, including trend and volume indicators, oscillators as well as many indicators described by Bill Williams. Basic as well as advanced order management features. All indicators are configurable and can be combined to create strategies with different entry and exit signals as well as reverse orders.

Alpha Trend MT5 is a trend indicator for the MetaTrader 5 platform; it has been developed by a group of professional traders. The Alpha Trend MT5 indicator finds the most probable tendency reversal points, which allows making trades at the very beginning of a trend. This indicator features notifications, which are generated whenever a new signal appears (alert, email, push-notification). This allows you to open a position in a timely manner. Alpha Trend does not redraw, which makes it possible t

MArketwave is a multicurrency, trend following indicator which combines three of the most commonly used parameters. Parameters Moving Averages Bollinger Bands Stochastic Oscillator The parameters have been customized to provide accurate signals. Signals Thick dark green up arrows - Uptrend Thin light green up arrows - Buy Thick red down arrow - Downtrend Thin red down arrow - Sell Trading tips Check the trend with thick arrows Buy or sell with thin arrows only in the direction of the main trend

Este indicador encuentra cuñas , que son patrones de continuación identificados por líneas de tendencia convergentes que rodean un período de consolidación de precios. Señala intercambios utilizando una ruptura de donchian junto con la ruptura de formación. [ Guía de instalación | Guía de actualización | Solución de problemas | FAQ | Todos los productos ] Fácil de usar Colores y tamaños personalizables. Implementa señales de arranque Implementa alertas de todo tipo.
Uso óptimo Para ver cuñas

What is OptimizedAO indicator ? OptimizedAO is a powerful indicator for trading short-term binary options that derived from Awesome Oscillator to calculate the momentum of trend. Sell signal is formed when the value is increasing. Similarly, buy signal is formed when the value is diminishing. It is separated from OptimizedAO trading system and you can get the backtest results from pictures below. (You send me a message to get OptimizedAO trading system for free after buying this indicator.)
Ba
How it works? This EA trades with Stochastic signal and base line crossovers. Only allows one open trade at a time on the currency you have attached this EA. Opens a Buy position if the signal line crosses below base line below the value you set in BuyBelow parameter. Opens a Sell position if the signal line crosses above base line above the value you set in SellAbove parameter. This EA will work in any time frame and in any pair, Stochastic oscillator will base its data on the current time fram

This indicator sends a message (notification), an email, and plays a custom sound when a Limit (Buy/Sell) or Limit Stop (Buy/Sell) or Take Profit, Stop Loss, Stop Out is executed. A user can change the sound file name, and select if they receive notifications/emails. It runs as an indicator, and only one indicator is locked (used) by a user account/login.
Parameters soundFile - sound file
Save your file at the terminal folder, for example: " C:\Program Files\MetaTrader 5\Sounds\Order Execute

FutureForecast is one of the few indicators looking into the future, or rather calculating the current candle's High and Low price values.
Advantages no re-painting works on any timeframes works with any trading instruments perfectly suitable for scalping and trading binary options
Parameters (Colors) FutureHigh - calculated maximum price line color; FutureLow - calculated minimum price line color.
Recommendations The indicator forms two lines. By default, they are of the same color but it

Este indicador implementa un proceso de suavizado lineal simple.
Una de las desventajas del suavizado exponencial es el rápido decaimiento de la señal. Esto hace que sea imposible realizar un seguimiento completo de las tendencias a largo plazo en el rango de precios. El suavizado lineal le permite ajustar con mayor precisión y precisión el filtrado de la señal.
El indicador se configura seleccionando parámetros:
LP: este parámetro le permite seleccionar el período de suavizado. Cuanto ma

A ticker that shows the average bitcoin price of the selected currency and keeps updating it at regular intervals. PRO version updates more often and displays details about the price change! Make sure you have added the API address http://metakod.com/mk/api in the list of allowed URLs on tab Tools → Options → Expert Advisors. All of the supported currencies and the API address are listed in the screenshots below.
Inputs Logging level - Controls the amount of details written to the log (default

Think of the rarest pair you can think of. And I assure you that this indicator can compute it is strength. This Currency Meter will literally calculate any currency pairs, either it is a major pair, metal, CFD, commodity, cryptocurrency like Bitcoin/BTC or Ethereum/ETH and even stocks. Just name it and you will get it! There is no currency pair this Currency Meter cannot solve. No matter how rare or exotic is that currency, it will always be solved by this Currency meter on a real-time basis. S

Exclusive Bollinger is a professional indicator based on the popular Bollinger Bands indicator and provided with an advanced algorithm. Unlike the standard Bollinger , my Exclusive Bollinger provides better signals and is equipped with flexible settings allowing traders to adjust this indicator to their trading style. In the indicator, you can set up alerts (alert, email, push), so that you won't miss a single trading signal. Exclusive Bollinger for the MetaTrader 4 terminal : https://www.mql5.

The Predicting Donchian Channel MT5 indicator allows predicting the future changes in the levels of the Donchian channel based on the channel position of the price. The standard ZigZag indicator starts drawing its ray in 99% of the time the opposite Donchian channel is touched. The forecast of the channel boundary levels will help in finding the points, where the correction ends or the trend changes, an also to estimate how soon those events can occur.
Configurations Period - Donchian channel
The EA identifies divergences in two correlated currency pairs and trades in the direction where they converge back. Working timeframe: M30
Input parameters MagicNumber - identification number for the EA. OrdersComment - comment to order, automatic if an empty value is set. Lots - lot size. DepoPer001Lot - automatic lot calculation (specify the balance per 0.01 lot) (if 0, the value from 'Lots' parameter is used). TimeFrame - working timeframe. Symbol #2 - correlated currency. Symbol #2 revers

The indicator displays useful trading information on the chart for futures contracts such as: Average daily volatility with adjustable period of time. Optimal volume to trade depending on percentage of account balance you use. The percentage can be adjusted. Optimal stop loss depending on your maximum risk per trade considering percentage of account balance you use. Initial margin for the contract. Tick value for the contract. The indicator has an ability to display dynamic daily volatility leve
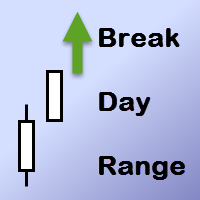
A signal indicator. It implements the tactics described in Larry Williams' book "Long-Term Secrets to Short-Term Trading", Chapter 4, "Volatility Breakouts - The Momentum Breakthrough". The indicator displays entry points on the chart using arrows. Input parameters are not used.
Example of use in a working trading system It is used on a live account as part of the portfolio of strategies on the GMKN futures. Signal monitoring: https://www.mql5.com/en/signals/204344 . Screenshots were created b

The indicator shows and highlights the chart candles, which are formed as a result of large players entering the market in large volumes. Such candles can also be formed after achieving a certainty on the market, when most of the participants hold positions in the same direction. The movement is likely to continue in that direction after such candles. The indicator highlights the significant candles from the existing ones on the chart; The indicator allows identifying the trends based on candles

Instrumento: funciona con pares de monedas, futuros y acciones. Tipo: Scalper, Short Trade, Swing Trade, Day Trade, Buy and Hold.
Descripción Las series de Expert Advisors Gekko Jade son EA’s diseñados para ser versátiles y que permitan combinar más de 50 parámetros de entrada de diferentes maneras; Permite la negociación intradiario y de posición; Permite el control de ventanas de tiempo de negociación; Permite diferentes tipos de parámetros y estrategias para entrar y salir del mercado; Adec
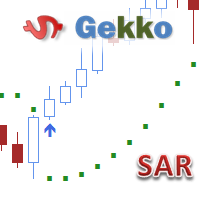
Tipo: Tendencia Este es el SAR parabólico personalizado de Gekko, una versión personalizada del famoso indicador de SAR parabólico. Use el SAR regular y aproveche las diferentes formas de recibir alertas cada vez que haya un posible punto de entrada o salida.
Entradas Step: Factor de aceleración (AF), por defecto es 0.02. Significa que aumenta en 0.02 cada vez que el punto extremo hace una nueva alta o baja. AF puede alcanzar un máximo de "x" en función del segundo parámetro a continuación, si
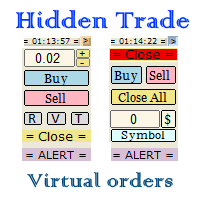
Small trading panel for managing orders and positions in 1 click for MetaTrader 5 The version for MetaTrader 4 is here , you can check it in the tester without restrictions Set hidden TakeProfit, StopLoss and pending orders at lines placed on the chart. Virtual breakeven. Virtual trailing stop. Close all positions. Close only Buy positions. Close only Sell positions. Work in the back testing mode (working in the tester is limited). Place up to 20 virtual orders. News trading and operation by tim

Este es el índice direccional medio personalizado de Gekko (ADX), una versión personalizada del famoso indicador ADX. Use el ADX regular y aproveche tres cálculos de señales de entrada y diferentes formas de recibir alertas cada vez que haya un posible punto de entrada o salida.
Entradas Period: Periodo para el cálculo del ADX; PlotSignalType: Cómo el indicador calculará las señales de entrada (oscilación): 1- ShowSwingsOnTrendLevel : Mostrar señales para los cambios de confirmación de tendenc

Este es el Índice de Fuerza Relativa (RSI) personalizado de Gekko, una versión personalizada del famoso indicador RSI. Use el RSI normal y aproveche dos cálculos de señales de entrada y diferentes formas de recibir alertas cada vez que haya un posible punto de entrada o salida.
Entradas Period: Periodo para el cálculo de RSI (cantidad de barras); Cómo el indicador calculará las señales de entrada (oscilación): 1- Produce señales de salida para oscilaciones basadas en el RSI entrando o saliendo

The indicator displays the price lines calculated based on the prices for the previous period. The lines can be used by traders as the support and resistance levels, as well as for determining the market entry or exit points, partial profit taking points. A distinct feature of the indicator is the ability to display up to six different price levels, which allows showing the support and resistance lines based on different periods on the same chart. For example, it is possible to show the Highs an

It is an analogue of the indicator of levels at https://www.mql5.com/en/market/product/24273 for the MetaTrader 5 platform. The indicator shows the levels of the past month, week and day. In addition, it draws a level in percentage relative to the difference between the High and Low of the past month and week. For the daily levels of the past day, the Close levels are additionally displayed. All you need to do is to configure the display parameters of the levels to your liking. In some cases, af
MetaTrader Market es el mejor lugar para vender los robots comerciales e indicadores técnicos.
Sólo necesita escribir un programa demandado para la plataforma MetaTrader, presentarlo de forma bonita y poner una buena descripción. Le ayudaremos publicar su producto en el Servicio Market donde millones de usuarios de MetaTrader podrán comprarlo. Así que, encárguese sólo de sus asuntos profesionales- escribir los programas para el trading automático.
Está perdiendo oportunidades comerciales:
- Aplicaciones de trading gratuitas
- 8 000+ señales para copiar
- Noticias económicas para analizar los mercados financieros
Registro
Entrada
Si no tiene cuenta de usuario, regístrese
Para iniciar sesión y usar el sitio web MQL5.com es necesario permitir el uso de Сookies.
Por favor, active este ajuste en su navegador, de lo contrario, no podrá iniciar sesión.