YouTubeにあるマーケットチュートリアルビデオをご覧ください
ロボットや指標を購入する
仮想ホスティングで
EAを実行
EAを実行
ロボットや指標を購入前にテストする
マーケットで収入を得る
販売のためにプロダクトをプレゼンテーションする方法
MetaTrader 5のための有料のエキスパートアドバイザーとインディケータ - 164
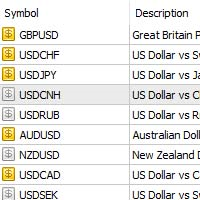
This product is design to export all pairs that you have it in your meta trade if you have too many pairs , shares , indicators , CFDs etc you just need 1 click to export all or them to txt file Works as an Script, reading all pairs . There's no option to change. There's no Web Request. There's no DLL use. File location: MQL5\Files . with name broker name._Symbols.txt
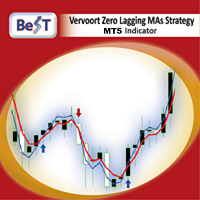
All those involved in trading do certainly know that Moving Average Crossovers for being tradable should be reliable and also they need to have minimal lag.
BeST_Vervoort Zero Lagging MAs Strategy is an outstanding indicator that can help you to achieve it and is based on S.Vervoort's work about Reliable and of Zero Lag MAs Crossovers as described in his TASC_05/2008 article " The Quest For Reliable Crossovers ". It's a Multipotentiality Indicator as it can display of either simply the Zero Lagg

Niubility Scalping The Niubility Scalping indicator detects trend, give sell point and buy point. this indicator can use for scalping technique, and also use for trend technique.
Attention
Chart statistics will help you to optimize your trading, statistical accuracy to the hour.
It can works on every timeframe.
The indicator analyzes its own quality and performance.
Losing signals are highlighted and accounted.
The indicator is non-repainting.
It implements sound alerts.
Parameters
Pr

この指標の独自性は、ボリュームアカウンティングアルゴリズムにあります。累積は、1日の始まりを参照せずに、選択した期間に直接発生します。最後のバーは計算から除外できます。そうすると、現在のデータが以前に形成された重要なレベル(ボリューム)に与える影響が少なくなります。 より正確な計算のために、M1グラフのデータがデフォルトで使用されます。価格ボリュームの分配のステップは規制されています。デフォルトでは、ディスプレイの右の境界線は、分析に使用されるデータの先頭に対応するバーに設定されていますが、必要に応じて、必要なバーに設定できます。表示されているボリュームバンドの長さ(右の境界線)は係数によって調整され、0(現在の)バーに左または右にシフトしたり、現在のバーを参照してミラーリングしたりすることもできます。 パラメーター: Accumulation period - ボリューム累積の計算期間 Number of excluded last bars - 計算から除外された最後のバーの数 Accumulation price step - 価格パラメータによるボリューム合計のステップ Gra

Very simple work on the principle of work. The elementary neural network is used, with the help of which the normalized RSI indicator is analyzed, the neural network has three outputs. One is responsible for the direction of trade, the other two for stop loss and take profit. Thus, by optimizing the coefficients of the neural network (this is the usual optimization using a genetic algorithm), we get a well-adapted network to work in the future. Sampling according to the results of optimization m

Оптимизируемый, автоматический торговый советник. Основан на техническом анализе, за основу взята стратегия отскока от уровней. В стратегии НЕ используется "Сетка", "Реверс позиций" и "Мультипликатор последующего лота". Торгует одним ордером. Сделки держит от нескольких часов до нескольких дней. Закрытие позиций происходит по сигналу и по Стоп Лосс, Тейк Профит.
Базовые параметры настроены под EURUSD M5 .
Общие рекомендации: Пинг до сервера ДЦ не больше 300 ms. Тайм фрейм M5. Минимальный депоз

Технический индикатор "Reversal patterns" является математической интерпретацией классических разворотных паттернов: Pin Bar, Harami и Engulfing. То есть «Разворотного бара», «Харами» и «Поглощения». Данный индикатор позволяет определить момент разворота котировок на основе рыночной динамики и победителя между «быками» и «медведями». Индикатор отображает момент разворота на локальных максимумах и минимумах графика любого таймфрейма, что позволяет повысить точность сигнала. Также индикатор имеет

FX Market Correlation indicator calculates the weakness/strength from all 28 currency pairs in the market. This is unique and powerful way of watching the market. It works on all timeframes. You can use it for scalping, or you can use it for long term trading. FX Market Correlation indicator is NOT repainting.
Features: --------- -easy determine which currency is strengthening and which is weakening -choose best currency pairs to trade and times to trade them -find correlation between pairs -NO


Coulter 指標取引システムはありません。この作業では、保留中の注文であるBUYSTOPとSELLSTOPを使用します。 アドバイザ設定の説明: ロット-注文の開始ボリューム StartDist-保留中の注文を開始する距離 OrdersDist-注文間の距離 Countlimitorders-同時に開いている注文の数 ProfPercent-パーセンテージとしての利益レベル MagicNumber-アドバイザー注文識別子 lot_ratio-注文ロットの乗数 Coulter 指標取引システムはありません。この作業では、保留中の注文であるBUYSTOPとSELLSTOPを使用します。 アドバイザ設定の説明: ロット-注文の開始ボリューム StartDist-保留中の注文を開始する距離 OrdersDist-注文間の距離 Countlimitorders-同時に開いている注文の数 ProfPercent-パーセンテージとしての利益レベル MagicNumber-アドバイザー注文識別子 lot_ratio-注文ロットの乗数

this is an indicator to clarify seeing Low and High in the market and is very useful for facilitating those who are studying technical price action
this is a type of indicator that gives color to the candlestick where the indicator is divided into 3 colors red = bearish green = Bullish
Gray = base
this indicator can be used on the forex market or the mt5 binary market. https://t.me/SBA_FOREX_SIGNAL

This script use DIDI+BB indicators and display alerts, send mail, send notifications, and play sounds. Scanner can monitor market watch using ***MARKET*** as symbol name, with all timeframes Inputs: media_lenta=3 media_base=8 media_longa=20 bb_periodo=20 bb_shift=0 bb_deviation=1.96 symbols - Symbol list, separated by ; when using ***MARKET*** symbols from marketwatch will be included wait_interval_between_signals - Seconds between signals, default =60, but high frequency signals should red

ADX CROSS Trend Filter Alert
The average directional index (ADX) is used to determine when the price is trending strongly. In many cases, it is the ultimate trend indicator. We added many types of alerts plus the TrendDI Filter Level to aid in your search for better opportunities in the market.
Product Features Sound alert Push Notification (Alerts can be sent to your mobile phone) Signs on chart Alert box Trend Filter Delay Cross Filter Indicator Parameters ADXPeriod - Set the ADX indicator p

外国為替市場における価格変動の性質を見てみましょう。これらの変動が起こる理由に注意を払わないでください。このアプローチにより、価格変動に影響を与える主な要因を特定することができます。 たとえば、EUR-USD通貨ペアのバーの始値とH1タイムフレームを考えてみましょう。これらの価格について、Lameray図(図1)を構築します。 この図では、価格変動は基本的に線形方程式に従って発生することがわかります。この方程式のパラメータを決定するために、最小二乗法を使用できます。この特定の例では、始値を変更するための方程式は次の形式を取りました。 Open [i] = 0.99989 * Open [i + 1] + 0.00013。 この式が価格変動をどの程度適切に表しているかを確認しましょう。これを行うために、線形成分を取り除き、残差を分析します(図2)。 図から明らかになるように、これらの剰余はかなり混沌としており、それらをノイズと見なすと、次の小節の始値を予測するためのかなり簡単なシステムが得られます。

BeST_Trend Exploiter is a Metatrader Indicator based on a smart proprietary algorithm which can detect the market Median Trend while it filters out the noise providing Buy and Sell Signals and also wherever it is applicable it provides us with TP Levels of High Probability. Additionally as it has Built Inside all the necessary features it can be used as a Complete Strategy of very Impressive Results. Essential Advantages of the Indicator
Clear and Easily Understandable trading rules. Real Ti

PLEASE MAKE SURE TO GO THROUGH THE UDEMY COURSE TO UNDERSTAND THE FUNCTIONALITY OF THIS EA (COMING SOON)
UTOPIA - THE ALL IN ONE EXPERT ADVISER
Utopia is all in one Expert Adviser and gives the trader multiple options to trade. There are thousands of options you can trade with this EA.
- Custom Manual Trading
- Multiple Time frame entries
- Multiple Currencies Trading
- Hedging in multiple currencies option
- Trend Trading option
- Basket of Grid Option
- Averaging Option
- Martingale Opti
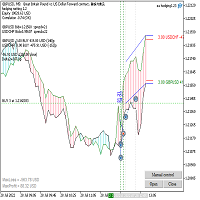
EAはMT5ネッティングアカウント端末で動作します。 (あなたはテスターでEAをテストし、履歴のパラメータを最適化することができます!) EA戦略: この相関が高い通貨のほとんど行動をとれるミラーファッションです。 しかし、通常の値からの逸脱(通貨の発散)の瞬間があります。 EAは通貨の収束の方向に注文を開きます。 不一致が長時間起こると、補充システムが使用されます。 さらに、総利益がCloseProfit(すべてのポジションがクローズされる預金通貨の価値)に達すると、EAは取引を終了します。
トレーディングでは、相関の高い通貨を選択します。: EURUSD-GBPUSD AUDUSD-NZDUSD ウェブサイトのタイトル
パラメータには次の点があります Instrument_2 これは、第二の楽器(第二の通貨ペア)の名前です。 最初の楽器は、EAがインストールされているものです。 Instrument_2を空のままにして、EAを上記のいずれかのペアに設定すると、EAは第二のインストゥルメント自体を決定します。 他のオプションが必要な場合は、Instrument_2に任

If you trade Forex, having detailed information about the currency strength and currency pairs correlation can take your trading to new heights. The correlation will help to cut your risk in half, and strength analysis will help to maximize the profits. This indicator provides a hybrid approach for selecting the most appropriate currency pairs using the strength analysis and currency pairs correlation.
How to use the Currency Strength Analysis
Suppose your trading strategy provides a buying opp
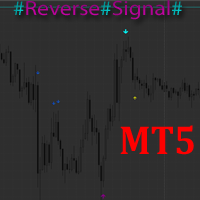
Версия индикатора MT4 - https://www.mql5.com/ru/market/product/16415 Индикатор обозначает предполагаемые развороты рынка в виде стрелок. В индикатор встроены 3 вида разворота. Основной сигнал на разворот. Это более сильный и важный разворот. Обозначается самой крупной стрелкой. Альтернативный сигнал - это дополнительный сигнал без использования дополнительных фильтров в отличие от основного. Подойдет для скальпирования на малых таймфреймах. Смесь основного разворота и альтернативного, но с доба

Features Value area lines (POC, VAH and VAL) of the present and the past separately customizable, making it easier for the trader to read on the most important levels. Value areas and volume profile work in any time period and in any market such as: stocks, futures, forex. commodities, etc. Customizable volume profiles color in single color or gradient. The gradient offers the view of how the volume behaved over time. Customizable performance setup. Allowed to set the number of sessions in whic

Xtreme TrendLine is an advanced powerful trend indicator. This indicator is based on candles analysis and trend channels. It can be used on any trading pair or instrument on any time-frame. This indicator is accessible in EA via iCustom functions and is fully customizable by user.
Features Any trading instrument Any timeframe Fully customizable by user More Trendlines on one chart Can be used in EA via iCustom function Can be use on more timeframe at once to catch best moment for the trade entr
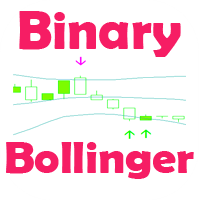
Стрелочный индикатор, выдающий сигнал при пересечении канала боллинждера. Сигналы выдаются в виде стрелок и подходят для торговли бинарными опционами.
Входные параметры Period of BB - период боллинджера Shift of BB - смещение боллинджера Deviation of BB - отклонение боллинджера Type of BB Signals - тип поиска сигналов Invert signals - Возможность давать инвертированные сигналы (для работы по тренду) Inform about finding the signal - параметр, отвечающий за получение уведомлений (Alert) о най

Trading signals are calculated using sma moving averages and last candle - the H1 period. Options: Lots - Lot size (if useCalcLot is false 1 lot used); useCalcLot = true riskpercentage =5 shortSmaPeriods = 50 longSmaPeriods = 200 useStopLoss = true stopLossPips = 100 useTakeProfit = true takeProfitPips = 300 useTrailingStop = true trailingStopPips = 120 Recommended currency pairs EURUSD - H1 period .

Приветствую тебя, мой контрагент на FORTS))) За 8 лет работы в офисе брокерской компании и 12 лет активного трейдинга я реализовал стабильную стратегию в робота. Если техническим языком, то этот робот торгует ретест уровня/двойное дно/вершину и прочие фигуры тех.анализа. Настройки советника позволяют ему определить экстремум перед разворотом движения и войти в сделку в самой выгодной точке.
Посмотри, Друг мой, внимательно параметры и сразу сможешь его настроить. Удачи тебе и профита! (ОБРАТИ В

Read Elliott wave principle automatically. With the Swing Reader, you can easily read the Elliott Wave Principle through an automatic system. With swing, we mean a ZigZag market that is created by a breakout of its standard deviation. You can set the deviation manually, or you can let the indicator do it automatically (setting the deviation to zero).
Advantages you get Never repaints. Points showing a horizontal line, in which statistically a long wave ends. Candles showing a vertical line in w

ZhiBiTMGは、すべての市場セグメントとすべてのチャートサイクルに関する傾向とマーチンゲール指標の集まりです。 市場の多くの指標はトレンドに反していますが正確であると主張していますが、それは本当に正確なのでしょうか。実際、それは正確ではありません。市場はトレンドに対応しなければならないからです。 このZhiBiTMG指標は、トレンドの前提としてMartingaleの信号を与えます。これは市場の規則と一致するでしょう。 使用のための指示: 赤い線は下降トレンド線(売り)で、合計3本の線で、デフォルトでは2本の線の注文信号のみがオンになり、パラメータで任意の線の注文信号をオンまたはオフにすることができます。 青い線は上昇傾向線(Buy)、合計3行です;デフォルトでは、2行の注文信号のみがオンになり、パラメータで任意の行の注文信号がオンまたはオフになります。 パラメータの説明 [Arrow_Sell_Down_1]:下降トレンドラインの次の単一信号がオンまたはオフになり、デフォルトはオープン状態です。 [Arrow_Buy_UP_1]:上昇トレンドラインの最初の単一信号がオンまたはオフに

Features Start point of VWAP movable. 7 types of VWAP calculation methods: close, open, high, low, average price, typical price and weighted close. 2 types of volume calculation: ticks or real volume. Thus, the indicator works in any market, for example: stocks, futures, forex, commodities, etc. Color, line style, and line width of the customizable VWAP. Label that show the current VWAP price. VWAP breakout alert that can be enabled or disabled. 2 types of methods to trigger the breakout alert:

Features 3 types of boxes: bullish, bass and unknown. The unknown box arises when prices move in the opposite direction of the current box. Allows you to set the required points for the box change. Lets you set both the box border types and colors or background color. Label that shows the box reversal points. Lets you set the size, color, corner position, and vertical label margin. Input Parameters Tab Reversal Points. Limit in points in the opposite direction to change boxes. Bulls Box Color -

Indicador en base a la pendiente de la linea de precio, dibuja una línea de color cuando sube a base de los precios que previamente has sido procesados o linealizados, y cuando baja la pendiente la linea linealizada toma otro color. En este caso se a considerado 6 lineas de diferentes procesos desde pendientes largas hacia las cortas, observándose que cuando coincidan las pendientes se produce un máximo o mínimo, lo que a simple vista nos permitirá hacer una COMPRA O VENTA.
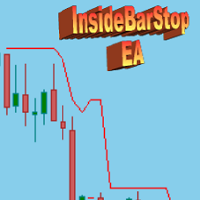
This Export Advisor implements the trailing stop algorithm "Trailing Stop with Inside Bars" that was suggested by the famous German trader and author Michael Voigt ("Das grosse Buch der Markttechnik") to capture robust gains when trading strong price moves. It is used for semiautomatic trading. You open a position manually and apply the expert to the chart. It modifies your order by setting a stop loss according to the trailing stop algorithm. Your trade direction (Long/Short) is detected automa

Features 3 types of waves: bullish, bearish and unknown. The unknown tower comes when prices move in opposite the direction of the current tower. Label that shows the percentage remaining for the next tower. Allows you set the type of volume that will be accumulated in the towers, either real or tick volumes. Thus, the indicator works in any market, for example: stocks, futures, forex, commodities, etc. Allows you to set the required score for the tower exchange. Allows you to set the font size

****************************************************** SIGNAL: https://www.mql5.com/zh/signals/586055 this is an Arbitrage system which base on EURUSD EURGBP GBPUSD you need a smallest spread and lowest ping account like ECN. I run it on icmarket and tester in icmarket history data run it on any chart then it will trade on EURUSD EURGBP GBPUSD when sign has checked ****************************************************** attention:it is cannot run on GBPUSD M30 chart.

Индикатор показывает развороты рынка в виде стрелок. Разворотные сигналы основаны на моих личных наблюдениях за поведением рынка. В основу взяты такие принципы как поиск экстремумов, объемы и Price Action. Индикатор дает сигналы на следующих принципах: Поиск окончания тенденции на рост/снижение рынка Поиск модели разворота на основе Price Action Подтверждение разворота объемом контракта. Также в индикатор встроен сигнал при появлении стрелки. Индикатор не перерисовывается. Индикатор не перерисов
SymbolAutoChanger PRO MT5 There is also version for MetaTreader4 This tool allows you to automatically change the chart symbols in a row. Example: EUR → GBP → JPY → CHF → CAD → AUD → NZD You need only to set up interval in seconds between auto switch. Also, you can choose whether to switch between all symbols provided by your broker or only between symbols available in the Market Watch window.
PRO version has following featuters: Next button Previous button Pause/Continue botton With this ex

References: "A Modern Adaptation of the Wyckoff Method" "The Secret Science of Price and Volume" "Trades About to Happen" To know more, search on the internet: "The Wyckoff Method", "Weis Wave" and "Volume Spread Analysis"; Features 3 types of waves: bullish, bearish and unknown. The unknown wave comes when prices move in opposite the direction of the current wave. Label that shows the percentage remaining for the next wave. Allows you set the type of volume that will be accumulated in the wave

Scalper Private Expert Advisorは、スキャルピングから始まる任意の取引モードで動作できます。また、中長期の動作モードでも動作します。すべてExpertAdvisorの設定によって異なります。 アドバイザ設定の説明: Time_next_order-次の注文が開始されるまでの秒単位の時間 たくさん-たくさんの注文 TakeProfit-利益レベル StopLoss-損失レベル Time_close_order-収益性の高い注文がクローズされるまでの秒単位の時間 MagicNumber-アドバイザー注文識別子 TrailingStop-トロールを開始するためのパラメーター(ポイント単位) TrailingStep-ポイント単位のトロールステップ すべり-最大許容すべり countPOS-同時に開いている注文の数を制限します Trigger_threshold-注文開始パラメーター(ポイント単位)

This long-term trading system works on 12 pairs and 4 timeframes . The Expert Advisor uses various trading systems, such as trend trading, counter-trend trading and others. This increases the chances of sustained growth and reduces exposure to a single pair or individual operations. The risk is tightly controlled.
/>
The EA has the built-in smart adaptive profit taking filter. The robot has been optimized for each currency and timeframe simultaneously. It does not need arrival of every tick an

Estratégia Bandas de Bollinger (“Estratégia da Paula”)
Estratégia A estratégia desse robô é baseada no retorno as médias, operando o indicador Bandas de Bollinger. Essa estratégia é popularmente conhecida como “Estratégia da Paula”. Basicamente o robô fica monitorando barras que rompam a Banda de Bollinger (tanto a superior quanto a inferior) para depois voltar para dentro da Banda na próxima barra. Se a condição acima for satisfeita, considerando também os demais parâmetros do robô, o mesmo e

What is this: Violent trading: means sending a large number of orders to your brokerage server, it can conduct a stress test of the trading. In this program you can run a variety of trading tests. Now you can trade at high speed, For example 1000 orders in an instant. The Demo version's link: https://www.mql5.com/en/market/product/38431/ Why to use: Whether manual trading or EA trading, the status of the broker server is very important. So it is beneficial to conduct a trading stress test on

Funciona identificando picos de máximos y mínimos, para luego eliminarlos haciendo una linea o curva, pudiendo el usuario ingresar el valor de que tanto puede suavizar. Nos facilita poder ver la tendencia así como ver el cruce que puede hacer con otros indicadores, mostrando a simple vista los inicios y salidas de una tendencia u operación. Así también facilita la visualización de subidas y bajadas.
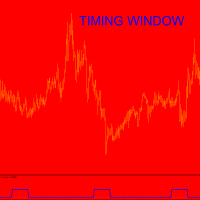
As for the cycle discussion, I invite you to read the TimingCycleWithLLV indicator presentation ...please ask me if something is not clear. I think that time is much more important than price;this is the reason for wich I trade only when one cycle finishes and the new one start. WHAT is Timing Window? It is a certain number of bars within which inversion is probable I do not know how much inversion will be....how many pips,BUT market will inverts with high probability.Time for inversion is ok. S
- あなたのロボットを動かして仕事に行かせて! - 先物市場のデイトレード - インデックスとドル契約 - ロボットは他のBM&F資産(PETR4、VALE3など)でも動作します。 - Metatrader 5(Free Platform)で走るロボット - トレンドに有利に働く。市場が上昇し続けると、ロボットはより多くの契約を購入し、下落するとより多くの契約を販売します。目標は、一日の早い時間によく打たれます - 毎日の目標をお金で設定できるロボットです(reais R $) - ろうそくの数に基づく戦 - 同時に複数のアカウントで使用できます - ロボットは、同時に複数のグラフで異なる時間枠で使用できます。 - ヒント:ロボットの使用経験を積むために、実際のアカウントを使用する前にデモアカウントで使用してください。
入力パラメータ
- グラフィックタイム - エントリースケジュール - クロージングクロージングアワー - オペレーション終了時刻 - ろうそくの数 - 契約数または株式数 - 滑り - お金での毎日の利益 - 毎日のお金の損失
The SemiScalpel Expert Advisor is a semi-scalping system which analyzes the market using an oscillator. During tests use the "Every tick" mode. The expert works only with accounts like "Netting" Adjust StopLoss , TakeProfit , TrailingStart , TrailingBreakeven and TrailingStop to set the system operation mode: scalping or standard. Simple overbought/oversold levels are used. You can use one of the indicators (select the value of the Signal parameter): RSI CCI WPR DEM MOM RVI
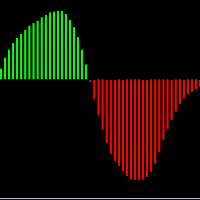
É um indicador oscilador baseado no "MACD" convencional porém com suavização . Através desse indicador você será capaz de operar sem os ruídos produzidos pelo indicador "MACD" convencional. Em quais ativos o indicador funciona: Em qualquer ativo do mercado, tanto em forex, como B3 ou binárias. Qual é o novo parâmetro: Smooth Period ou período de suavização, que representa o período que será suavizado no "MACD".

Use of support and resistance in systematic trading is very subjective. Every trader has their own idea and way to plotting the support and resistance levels on the chart. KT Support and Resistance indicator take out this ambiguity out of the situation and automatically draws support and resistance levels following an algorithmic approach using a unique multi-timeframe analysis.
When launched on the chart, It immediately scan the most significant extreme points across all the available timefra
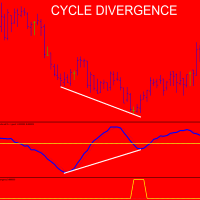
Please,put CycleDivergence in the same folder of TimingCycleWithLLV otherwise it does not run. As for the cycle discussion, I invite you to read the TimingCycleWithLLV indicator presentation ...please ask me if something is not clear. I think tha time is much more important than price;this is the reason for wich I trade only when one cycle finishes and the new one start. In order to use the CycleDivergence indicator follow these steps: 1) for example (see imagine number four) 1 minute chart,in t

Indicador multi-nivel y multi-timeframe que permite seguir la tendencia del precio de cualquier par de divisas, metales, acciones, CFD's, etc. Intuitivo y fácil de aplicar sobre cualquier gráfico.
Parámetros: Timeframe : Marco de tiempo que se le aplicará al nivel Period : Periodo que se aplicará Applied Price : Precio a aplicar
Aplicaciones: Se puede usar aplicando diferentes niveles sobre el mismo gráfico, por ejemplo, in nivel de 8, 14, 20, etc.

The Expert Advisor works with ticks, calculates volatility and operates in the volatility working range. After that, the EA defines price deviation from the price balance level and starts working in the direction set in the input parameters and on the appropriate levels that are also specified in the inputs. Setting (by default) is displayed in the screenshot. Before working in real time, optimize a month on every tick ! The optimization setting is provided. It is enough to optimize the EA once

İlk süreç, pazarın yorgunluk semptomlarını bolinger bandı ve hareketli ortalama göstergeleri ile tespit etmekle başlar. İşlem beklendiği gibi gitmezse, ikinci işlem başlar. İşlemi Avrupa ve ABD oturumları için makul bir kar veya zararla kapatır. eurusd 1 saat kullanılır. Ayda 3 veya 4
Sihirli numara = sihirli sayı inp1_TimeStart = Zaman Başlangıcı inp1_TimeEnd = Zaman Sonu inp5_VolumePercent = Birim Yüzde Satın Al inp11_mmMgInitialLots = mm MgInitia lLots satın al inp11_mmMgMultiplyOnLoss

Using the basic principles that allow scientists to report a tsunami a few minutes before it happens (tested during a period of almost 10 years), we have designed an algorithm able to perceive its wave length, amplitude, height, rate, period and acceleration.
This allows our Expert Advisor (EA) to make transactions or to send automatic signals for up to 5 currency pairs (EUR/USD, USD/CHF, AUD/USD, USD/CAD, USD/MXN). In other words, our algorithm identifies the main trend through the result o
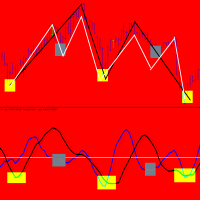
TimingCycleWithLLV is an excellent tool to determine the timing of your entry point! Everyone knows that cycles exist both in nature and in financial markets.Cycles are present in all time frames,from 1 minute to 1 year.Sometimes they are very clear to identify,others there is overlap between cycles of varyng duration. I can say this:the one-day cycle corresponds to the duration of a trading day( for example the one-day cycle for GERMAN DAX index is 14 hours as the trading day is 14 hours). Obvi

In spite of a very simple indicator, it assists the trader who is eventually positioned several days in an operation if the asset swap is for or against its operation.
It is the ideal indicator for long-term operators.
The Swap is the rate that the operator pays for being positioned from one day to another or sometimes from week to week.
There are strategies that, besides a setup and risk management, also contemplate operating in favor of the Swap.
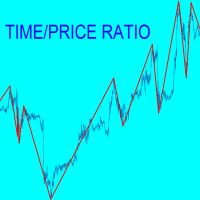
A chart is made by price and time but many traders consider only price.For each swing TIME-PRICE RATIO indicator shows in real time ratio between price/time and time/price. Moreover in the past you can read for each swing :number of pips;number of bars;ratio P/T and ratioT/P. Why it is usefull? because when P/T or T/P is a fibonacci ratio,the probabilities increase for inversion near support/resistance lines.During swing formation an audible alarm and a warning window advise you that a fibonac

Better Scrollは、スクロール時にMT5のAutoScroll機能を有効または無効にし、機能をより直感的で便利に感じさせます。 オートスクロールを手動で有効または無効にしたり、バックテストや過去の価格データを確認しているときにオフにするのを忘れたためにチャートの最後に移動する必要がなくなりました。 概要
AutoScrollは、次の場合に無効になります。
マウスクリック+左ドラッグ(現在開いているキャンドルを過ぎた) マウスホイールを左にスクロール(現在開いているキャンドルを過ぎた) PageUpキーが押されました ホームキーが押されました 左矢印キーが押されました(現在開いているキャンドルを過ぎて) 市場は閉鎖されています
AutoScrollは、次の場合に有効になります。 マウスクリック+右ドラッグ(現在キャンドルを開くには) マウスホイール右にスクロール(現在キャンドルを開く) ページダウンキーが押されました(現在キャンドルを開くため) エンドキーが押されました 右矢印キーが押されました(現在キャンドルを開くため) Metatrader 5の生活の質を向上させる他のユ

First thirty minutes are essential for a trading session. The early reaction of traders and market players sets a path for the rest of the day. KT London Breakout EA takes advantage of this phenomenon, and after analyzing the first thirty minutes of London session, it places two bidirectional pending orders. One of pending order is eventually canceled after realizing the market direction with certainty.
It has been strictly tested and developed for EUR/JPY using 30-Min Time Frame. You can expe

Это полностью автоматизированный советник. Данный советник использует данные индикаторов SAR, ADX, EMA, SMA c некоторыми дополнениями. Не использует Мартингейл. Убыточные сделки пытается закрыть за счет прибыли прошлых сделок. При наличии на счете других открытых сделок или при ручном открытии сделок - сам закроет их при достижении прибыли. Советник использует виртуальные stoploss и takeprofit. Рекомендуется работа на нескольких валютных парах одновременно (не менее 5) Торговое плечо: от 100 д
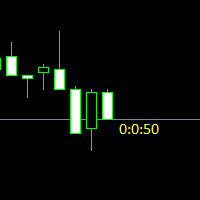
Простая утилита показывающая время до формирования свечи. Может быть очень полезна, если вход в сделку завязан на начале/завершении свечи.
Входные параметры FontColor - Цвет текста. FontSize - Размер текста. FontName - Шрифт текста. TimeOnly - Указывать только время, без дополнительного текста. TypeOfDrawing - Тип отображения информации Важно : в работе программы возможна задержка в 1 секунду.
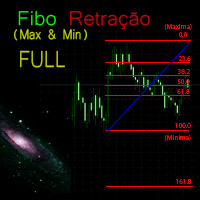
Functional in the Forex market. Functional in the B3 market - Bolsa Brasil Balcão.
Motivation The technical indicator of Fibonacci retraction for many is essential and the basis for all forecasts of market movements. The name of the tool comes from the Italian mathematician Leonardo de Pisa (13th century). This FULL version will work in Meta Trader 5 on any type of account.
This FULL version will work in Meta Trader 5 on any type of account.
To test on the DEMO account, download the free ver
Sessions PRO is a perfect tool which divide your chart screen by 3 main market sessions: 1> asian 2> european (with division for Frankfurt and London start) 3> american
Sessions PRO is perfect especially for trading indices, where main pivot points often occurs along with new market center enters the market. With Sessions PRO you see what events happened at their exact corresponding time - European and American moves and pivot points are much more important than asian. Stop analyzing your c

this indicator very simple and easy if you understand and agree with setup and rule basic teknical sba you can cek in link : please cek my youtube channel for detail chanel :
an for detail info contact me basicly setup buy (long) for this indicator is Magenta- blue and green candle or magenta - green and green candlestik and for setup sell (short) is Black - yellow - and red candle or black - red and red candlestik

iVolX indicator horizontal volumes for all time periods
Main settings of the indicator: VolumeSource - select data for volumes (tick or real) PeriodMinutes - selection period for rendering of volumes PeriodsNumber - number of periods to show on the chart StartDate - the start date of the calculations ClusterPoints - cluster width Color - color MaxVolColor - maximum volume color ValueArea - the value of the zone of balance ValueAreaColor - color of the balance zone MaxVolFontSize - font size Mav

Индикатор, показывающий момент преодоления нулевой отметки индикатора MACD. Подходит для бинарной торговли, т.к. имеется возможность посчитать точность сигналов, в зависимости от времени экспирации.
Входные параметры Period of SMA1 - Период 1 скользящей средней Period of SMA2 - Период 2 скользящей средней Period of SMA3 - Период 3 скользящей средней Price Type - Тип цены, используемый индикатором MACD Invert signals - Возможность давать инвертированные сигналы (для работы по тренду) Inform

The Levels indicator has been created to simplify the process of plotting support and resistance levels and zones on selected timeframes. The indicator plots the nearest levels of the selected timeframes, which are highlighted in different colors. It significantly reduces the time needed to plot them on the chart and simplifies the market analysis process. Horizontal support and resistance levels are used to identify price zones where the market movement can slow down or a price reversal is like
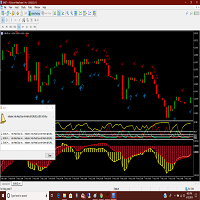
Adx and Macd are powerful indicators which can warn you of a change of direction. Put them together with this great indicator that will warn you of impending changes long before any ma lines cross. More screen shots on the MT4 version. Arrow indicates a solid macd cross and the check marks show the adx movements. You can trade the long term with the macd crosse and scalp the adx changes while you hold the main trend. Thanks for checking out my indicators.

The EA uses a reverse strategy. To detect trading signals, the following indicators are used: Moving Average, Relative Vigor Index, Average True Range, Alligator and other custom indicators . Each pair has a stop loss, take profit, breakeven and trailing stop. The EA trades on many major currency pairs and timeframes. The EA uses timeframes: MetaTrader 4 MetaTrader 5 M1, M5, M15, M30, H1 M1, M2, M3, M4, M5, M10, M12 , M15, M20, M30, H1 , H2 Real monitoring 1 : https://www

Trend Scanner is a trend indicator that helps to determine the current and forecast market direction using an advanced algorithm. Thanks to flexible alert settings, the indicator will promptly warn you about a trend reversal. The indicator is intuitive and easy to use, and will be an excellent filter in your trending trading strategies. The lines of this indicator are also an excellent dynamic level for stop loss, and is used as one of the types of trailing stop in Trading Panel . To fine-tune t

ZigZag with backlight Fibonacci levels. The indicator has the ability to set any number of levels, the signals of the intersection of which can be sent to your mobile device email, as well as viewed via alerts. The indicator is designed to perform wave analysis, search for harmonic petterns, as well as search for other technical analysis figures. This Zigzag uses the principle of constructing extrema in which any trader will understand very easily. First, the indicator finds the upper and lower

Crypto Trend Finder follow trend. Color change trend changed. Works in BTCUSD/BABUSD/BSVUSD/ETHUSD/ETCUSD/BTGUSD/DSHUSD/ZECUSD/IOTUSD/XRPUSD and all crypto pairs
Best timeframes 15M/30M/1H/4H/DAILY Note : Not use 1M/5M
Signal on close of a bar. DOES NOT repaint. DOES NOT repaint. DOES NOT repaint. DOES NOT repaint.
DOES NOT recalculate. DOES NOT recalculate. DOES NOT recalculate. DOES NOT recalculate Settings : No Settings, change color

ZhiBiSmartは、あらゆる市場のあらゆるチャートサイクルに適しています。トレンドバックコールを使用してバウンスバンドを作成します。これにより、バンドとトレンドの予測が向上します。 注文を購入する:緑色の上向き矢印の付いたマーク。 閉じるを購入する:緑色の十字マークが表示されます。 注文を売る:黄色い下向き矢印のついた印。 クローズを売る:黄色の十字マーク。 パラメータ設定: [TrendPeriod]:トレンドラインの期間。 [SignalPeriod]:信号線の周期。 [TrendSpread]:最終的に決定されたトレンドラインの広がり。 [Alert_No_Off]:ポップアップメッセージを開くか閉じる。 true =オン、false =オフ。 [SendMail_No_Off]:メールを送信するかどうか。 true =オン、false =オフ。 [SendNotification_No_Off]:メッセージは携帯端末にオンまたはオフにプッシュされる。 true =オン、false =オフ。 [UpArrowMessage]:上向き矢印が表示されたときに送信されるメッセージの

Sniper Trend Finder follow trend. Color change trend changed.
Works in EURUSD/GBPUSD/XAUUSD/USOIL/US500/USDJPY/USDCAD/JP225/USDTRY/USDMXN and all pairs
Best timeframes 5M/15M/1H/4H/DAILY
Signal on close of a bar.
DOES NOT repaint. DOES NOT repaint. DOES NOT repaint. DOES NOT repaint.
DOES NOT recalculate. DOES NOT recalculate. DOES NOT recalculate. DOES NOT recalculate Settings No Settings, change color
MetaTraderマーケットはMetaTraderプラットフォームのためのアプリを購入するための便利で安全な場所を提供します。エキスパートアドバイザーとインディケータをストラテジーテスターの中でテストするためにターミナルから無料のデモバージョンをダウンロードしてください。
パフォーマンスをモニターするためにいろいろなモードでアプリをテストし、MQL5.community支払いシステムを使ってお望みのプロダクトの支払いをしてください。
取引の機会を逃しています。
- 無料取引アプリ
- 8千を超えるシグナルをコピー
- 金融ニュースで金融マーケットを探索
新規登録
ログイン