YouTubeにあるマーケットチュートリアルビデオをご覧ください
ロボットや指標を購入する
仮想ホスティングで
EAを実行
EAを実行
ロボットや指標を購入前にテストする
マーケットで収入を得る
販売のためにプロダクトをプレゼンテーションする方法
MetaTrader 5のための有料のエキスパートアドバイザーとインディケータ - 160

A trend trading expert uses a breakout strategy in the direction of the main trend. The EA has a unique deposit protection system that allows you to safely exit the drawdown in the event of a trend reversal. The Expert Advisor uses an indicator (built into the Expert Advisor): https://www.mql5.com/en/market/product/64252 Trading instruments (TF 5m): GBPUSD. Torn for MT4: https://www.mql5.com/ru/market/product/64432/ The Expert Advisor has been successfully tested with 99% quality quotes, floati

Grid EA Pro RSI is an professional Grid advisor works according to RSI ( Relative Strength Index ) indicators. And has the function of Reducing the Drawdown on the account by overlapping unprofitable orders. The chart displays information about the profit. - Use default setting for GBPUSD, GBPJPY timeframe H1/M5 - Recommend ECN broker with LOW SPREAD: IC Market , Exness, NordFX , FXPRIMUS , Alpari , FXTM - It good to combo with Buy Sell Signals to follow Trend and Sellect Buy Only/Sell Only f

Order Entry Tool with several additional features. Money management feature - As in the free version but in this pro version the lot & risk calculations are updated as you drag the lines making it much easier to setup the order. Close all - Will close all orders opened with the tool in one click. Intelligent trailing stop loss - Attempts to maintain a trailing stop loss just behind the last identified structure in the 1H chart in order to try and avoid unwanted stop-outs. Adjustments are made ev

100 % PER MONTH PROFIT---- MY NEW SIGNAL HERE -------> https://www.mql5.com/en/signals/2162238?source=Site+Signals+My#
THANKS FOR TRUST IN OUR PRODUCT AND SUPPORT US !
Martina Advisor 2021 is a 100 % Automatic System . Based on severals indicators on different timeframes and a SECRET TRENDING INDICATOR BUILT IN SYSTEM CHARACTERISTICS: TAKE PROFIT AND STOP LOSS FOR EVERY POSITION SIMPLE SETTINGS PLUG AND PLAY RECOVERING SYSTEM FOR EVERY LOSS STARTING ALSO FROM 560 USD CENTS PASSED STRES

Ichimoku Map (instant look at the markets) - built on the basis of the legendary Ichimoku Kinko Hyo indicator.
The task of the Ichimoku Map is to provide information about the market strength on the selected time periods and instruments, from the point of view of the Ichimoku indicator. The indicator displays 7 degrees of buy signal strength and 7 degrees of sell signal strength.
The stronger the trend, the brighter the signal rectangle in the table. The table can be dragged with the mouse.
The

Join Deriv link on profile>>>
BOOM AND CRASH Exp is a 100% adaptive expert advisor based on price movement. It has a built-in unique Smart Recovery algorithm. Only one trade at a time. Every trade has Stop Loss and Take Profit from very beginning, and they do not change. This is for those, who are looking for stable growth over the long run. SETTINGS Lot size 0.2 Step set 0.01 Recommended TimeFrame (5m) Recommended Setup
Balance : $50 - $5000 Base Lot ;0.20 T0 1 MESSAGE ME FOR ANY KIND OF

No Nonsense Forex メソッドのための完全なトレードパネルです。このパネルには、あなた自身のNNFXアルゴリズムを実行するために必要なほとんどすべてのものが集約されており、あなたがより速く、より簡単にトレードできるようになっています。3つの部分で構成されています。 シンボルパネル
シンボル名を押すと、チャート内の任意のシンボルに素早く切り替えることができます。 パネルには、現在開いている取引、それらの取引と他のシンボルとの相関関係(ストップロスがブレークイーブンまたはプラスの場合を除く)、今後のニュース(次の日のローソク足、ローソク足の終値で取引する場合)などの追加情報を表示できます。 ニュースはForex Factoryからインポートされ、デフォルトのフィルタリングされたニュースはVPがNo Nonsense Forexで推奨しているものとなっています。ニュースを変更したい場合は、あなたの完全なカスタムニュース(大文字と小文字を区別します)を含むニュースが表示されることを考慮してください。 タイムゾーンはEET/EEST(メタトレーダーと同じ)で、表示されるニュースは

Circinus 2021 is a versatile algorithm which can use wide range of deposit. Suitable for EURUSD pair. Backtesting showed more than 220% profits in 12 months for initial deposit 100 USD and initial Lot 0.01 (TP_money =10) Backtesting showed more than 130% profits in 12 months for initial deposit 1,000 USD and initial Lot 0.1 (TP_money =10) Backtesting showed more than 130% profits in 12 months for initial deposit 10,000 USD and initial Lot 1.0 (TP_money =100) C
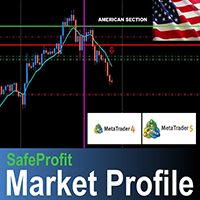
SafeProfitマーケットプロファイルは、外国為替市場で最も先進的な追跡指標です。これは、その日の各セッション(アジア、ヨーロッパ、アメリカ)の市場プロファイルを追跡するために開発されました。 このインジケーターを使用すると、日中の笑顔で操作できます...ビッグプレーヤーが配置されている場所と彼らが行く正確な瞬間を正確に知ることができます。 インジケーターはシンプル、高速、客観的で、ビッグプレーヤーのあらゆる動きを価格で追跡します。 コンピューターサイエンティスト、ソフトウェアエンジニア、金融市場スペシャリストのJonathas Rodriguesによって開発されたこのセンセーショナルなツールを失うだけの95%の統計から抜け出し、使用してください。 何も設定する必要はありません...それをチャートに追加し、ろうそくを閉じて休憩を待つだけです。 時間枠:30M。 SafeProfit mākettopurofairu wa, gaikoku kawase ichiba de mottomo senshin-tekina tsuiseki shihyōdesu. Kore wa, s
Description : Sensor EA MT5 is an advanced Expert advisor for MetaTrader 5, built using the usual signals provided by Bollinger Bands Technical Indicator . The Expert Advisor places a buy order, When price crosses above the lower band, and a sell order when price crosses below the upper band. The Expert Advisor uses a Stop Loss and a Take profit. The Expert Advisor settings are as follows :
( The parameters below can be set according to your trading rules. ) StopLoss ( Stop Loss in pips) TakePr
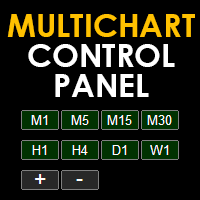
Multichart Control Panel is a small panel that can change the timeframe and zoom level of all open chart with just one click. Simple, intuitive and fast.
Inside there is a simple hidden function: the buttons have a light red color when working on a demo account and a light green color when working on a real account. This little trick helps all traders who for some reason often switch from a demo account to a real one not to get confused and not to make involuntary mistakes.

Small expert of great use. Close All by Magic Number allows you to speed up the closing of all open positions with a certain magic number. Thanks to this expert, it is possible to manage multiple strategies at the same time without the risk of making mistakes. You can close all discretionary trades, all experts, all spreads... The position of the button can be customized so as not to disturb any other indicators

We all dream of becoming a foreign exchange trading expert, making a lot of money and having a large number of trading fans who adore us. There seems to be only one thing standing in our way: actually learning how to enter and leave the foreign exchange market. Most trading strategies put their emphasis on finding out when to enter the market. Whether it’s technical or fundamental, everyone is looking for an entry signal. However, this only covers half of the trade. As any trader knows, there a

AoMA is an indicator based on analytical geometry calculations, where the average price angle of a given period is calculated.
Being a powerful indicator of reversal points and supports, supports and resistances become objective with the formation of well-defined "plateau" areas.
It can be used for trend monitoring and the anticipation of trend reversal points.
Two levels of periods are available, a short and a long one, and period crossings can be used as indicative of buying and selling as

Stabilized Funds EA is a fully automatic Expert Advisor built for the EURUSD currency pair. Stabilized Funds EA does not use Martingale and Grid, All Trades are covered by StopLoss and TakeProfit . Stabilized Funds EA only works in EURUSD currency pairs. Stabilized Funds EA has been tested for more than 5 years in Strategy Tester . ************************************************************************************************************************************************

Promotional price for the first 10 buyers! Awesone Forex performs trades based on various input indicators. Profit is dynamic and defined in percentage terms. The loss occurs when the maximum user-defined drawdown is reached. As the EA strategy is very assertive, before the maximum drawdown occurs, in general, the operation achieves profit. The EA is optimized for EURUSD, on 15 min timeframe since August 2020, a period when the market returned to semi-normality, but it works with all currency

EA for MT5 Start :300$ But recommend 500$ Cross orders technic. Money Managenet or Fixed lots can be select. EA schedule to work can set. Please Optimize before run this EA. Recommend to run 1Pair per account It can be optimized in the strategy tester It can trade on any time frame -----------------------------------------------------------------------------------------------------------------------------------------------------------------------------------------------------------------
Variabl
A dealer with simple logic of opening orders and reliable closing control for advanced.
The input signal is determined by only one indicator.
Closing occurs on target profit.
When drawdring first orders, the following appears.
Maximum number of orders - no more than three in each direction.
Settings for configuration:
----------- Trade Settings ----------- Quantity Lot 1 - the size of the first transaction Quantity Lot 2 - the size of the second transaction in the series Quantity Lot 3
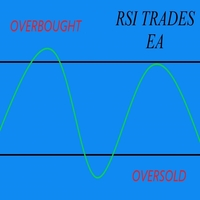
This EA trade based on RSI oversold/overbought situations, for reduce false signal it used 80 on overbought level and 20 on oversold level. The best time frame is H1 (minimum) up to D1. Higher RSI level and higher time frame will reduce false signals and also the EA will trade less frequent. Use time restrictions for best time to trade. Recommendations Initial deposit = USD 1.000;
Leverage = 1:100;
Time Frame = H1 to D1
Pair = EURUSD,GPBUSD
Trade on VPS.
Imagine a simple and powerful line that gives you everything you need: Trend and Momentum . Welcome to the Trend Momentum Moving Average ! Visually it seems like a very simple Moving average, but in fact it is a VIDYA ( Variable/Volatility Index Dynamic Average ) type of moving average - originally created by Tushar Chande - and the main purpose of this special Moving Average is to understand and interpret the current volatility of the market and apply it as a smoothing factor for a traditional

この外国為替エキスパートアドバイザーmt5自動車貿易ロボットはエーゲ海貿易グループLLCによって生産されています。 トレードロボットをより効率的に動作させるために、クリーンなコーディングで作成されました。 トレンド、ブレイクアウト/ダウン、スカルプ戦略を組み合わせて作成されたこのmetatrader5 eaロボットは、トレーリングストップ機能を追加することで最適化されました。 ロボットは5分の時間枠でのみ取引します。 ブローカーがよく使うことわざがあります:「収益は財布に値する!」 ここでは、この言葉を貿易の哲学と見なしています。 そこで、このロボットを開発しました。 皆様のご多幸をお祈り申し上げます。
時間枠:5分
サポートされている通貨ペア:*** EURUSDなど。
取引には最低$ 1000が必要です。
ノート:
1.手数料の低いブローカーを選択し、VPSを使用する必要があります。
2.すべての利益を保証するものではありません。 ある程度の損失が予想されます。 しばらくお待ちください。
3.予算に応じてロット額とレバレッジ比率を調整します。
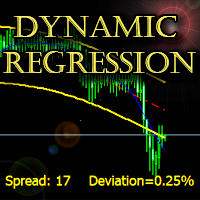
The indicator builds a dynamic regression channel with high accuracy without lagging.
Channel deviation is calculated using a unique formula and displayed on the graph.
Support: https://www.mql5.com/en/channels/TrendHunter
Can be used on any timeframe and any instrument. MT4-version: https://www.mql5.com/en/market/product/64252 Can be used as a ready-made trading system, as well as an addition to the existing one.
Settings: Fast Period - Fast smoothing period; Slow Period - Slow smoot

Эксперт - торговый помощник, созданный по одноимённой торговой стратегии Оракул в сотрудничестве с ее автором Нео. Определяет на графиках в автоматическом режиме разворотные импульсные модели и строит по ним Вилки Нео - авторский инструмент, позволяющий определять циклы движения цены и указывающий на ожидаемую цель TakeProfit . Поиск ведется на всех заданных периодах графиков одновременно с фильтрацией совпадений. Осуществляется фильтрация неверных Вилок с указанием кода ошибки. Утилита имеет

Multi-currency trading expert, trades on four currency pairs at once, EUR/USD, GBP/USD, USD/CHF, USD/JPY.
recommended initial deposit, only $ 100. It is possible to enable Martingale, and set the auto lot increase.
The aggressive trading option increases the number of open positions.
You can reduce the number of currency pairs involved.
the minimum size for calculation in paragraphs is recommended to be set from 90 to 150
if you have any questions please contact us https://www.mql5.com/ru/

VR Pivot - これは、主要なピボットポイント(pivot)の指標です。 ピボットポイントは、最強の価格帯を識別するために使用される特別なタイプのサポートレベル(support)と抵抗(resistance)です。プロのトレーダーは、価格の反転の高い確率がある価格を決定するために逆転のポイントを使用します.レベルは、特別な数式に従って計算され、終了、開口部、最大、前の期間の最小値の価格が考慮されます。最も効果的なのは、毎日の期間です。一見すると、これらのレベルに特別なものは何もないと思われるかもしれませんが、ピボットポイントのレベルの助けを借りて価格の動きを分析すると、ほとんどの場合、これらのレベルが良好で正確な結果を示していることがわかります。 テクニカルサポート、設定およびソフトウェアの体験版は、作者のプロファイルによりリクエスト できます。 逆転ポイントは、ピボットポイントとしてだけでなく、最大利益のために可能な限り効率的に使用できるレベルとして使用することができます, 損失を最小限に抑えるために損失を停止, リスクを軽減するために、損失ゾーンにポジションを転送. インジケ

Fundamental Signals Indicator is a Non-Repaint Indicator with a powerful calculation engine that can predict market movement over 3000 pips (30000 points). The indicator does not analyze the market fundamentally, it is named fundamental because it can predict trends with large movements, no complicated inputs and low risk. Also Indicator can alert on market trend changes.
Using Indicator :
The Indicator is very simple and without complicated input parameters. (No need to optimize anything.)T

Binary Trader EA This EA is designed to trade synthetic indices Boom 1000 index & Crash 1000 index. Boom1000 index & Crash1000 index from volatility 75 index Please don't use the default settings, ask for proper settings and I will send you. This EA follows the trend. Can set risk as a percentage. Only tested on binary deriv broker indices. Crash 1000 index spikes down, so to avoid that, we trade on a bigger timeframes, 1hr timeframe is perfect. Contact me if you have any questions.
Recommen

Dragonfly EA is a trend or reversal expert advisor that uses indicators Ichimoku Kinko Hyo , Bollinger Bands , Parabolic SAR , Stochastic Oscillator , Relative Strength Index RSI and On Balance Volume . Dragonfly can be configured to trade on trend or reversal behavior.
Ichimoku Kinko Hyo, Bollinger Bands, Parabolic SAR and Stochastic Oscillator works together to recognize a bull or bear trend, while the indicator RSI filter entry signals according to its configuration and optimization. Dragonfl

MEF Algosoftbot
Soft MT5 Single Order Expert Advisors
No Grid Hedging Averaging Martingale Switching
Parameter Input :
1. Broker Option Features for Forex & Synthetic Indices
Broker options MEF Algosoftbot parameter input are adjusted as follows
Brokers that only provide Immediate or Cancel options , choose ICMARKET
Brokers that only provide Fill or Kill options , choose Binary
The broker that provides both options , choose ICMARKET
This Broker Option is to ensure MEF Algosoftbot can make tra
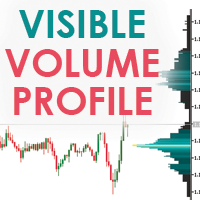
Visible Market Profile graphically represents the amount of trades made on each price level. This indicator in particular, unlike the daily market profile , is calculated on the visible area of the chart.
Visible Market Profile cannot be considered an indicator of operational signals, but it can be a good support for reading the market, in addition to what is already used by every trader in his work process. The Visible Market Profile is able to determine with a good approximation the price
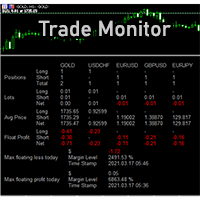
DSProFx Trade Monitor (iExposure) gives you detail information of all trades in your account including total positions, lot size, average price level (Breakeven Level), floating profit, and today's maximum profit/loss. The display is simple. Each data will be separated for every symbol/chart. This indicator will help you monitoring your trades especially if you are working with multiple symbols/charts and open many orders. Just attach DSProFx Trade Monitor in one chart, and it will show all deta

The expert is based on two moving averages , one of them is used for opening orders and the other one is used for closing , each of them having separate settings . The "Twist" comes from the fact that for closing the orders , the classic condition is not used , if a closing signal appears , the EA has the capability to skip the first or several closing conditions and so the chances for increased profit rises . The expert also has a buit-in recovery mode with a maximum of ten steps , in which , l

The Trend Complete indicator is a signal indicator and has interesting properties. It should be taken into account that this indicator reflects extremes and should be used as an additional one, and another instrument should be used for the entry point. Searches for and displays pivot points on the price chart. Trend indicators are one of the main tools for analyzing trends in the Forex market. The indicator is able to transmit all types of signals to the user: messages, E-mail and Push!
The go

The Interesting Thing indicator visually unloads the price chart and saves analysis time: if there is no signal, there is no deal, if an opposite signal appears, then the current deal should be closed. This is an arrow indicator for determining the trend.
The indicator implements a trend trading strategy, filtering and all the necessary functions built into one tool! The principle of operation of the indicator is to automatically determine the current state of the market when placed on a chart

The Checkpoints indicator implements an advanced algorithm for visualizing the market trend. The main application of the indicator is to generate buy and sell signals.
Determining the market trend is an important task for traders. Probably, almost every trader has dreamed of non-lagging MAs at least once. I have embodied this dream in my indicator. With this indicator, you can predict future values.
The indicator is designed to determine either a trend or short-term buy or sell signals. The

Our Trend entry points should be used as potential market reversal points. The indicator works using the cyclic-wave dependence function. Thus, all entry points will be optimal points at which movement changes.
The simplest use case for the indicator is to open a trade in the direction of an existing trend. The best result is obtained by combining the indicator with fundamental news; it can act as a news filter, that is, show how the market reacts to this or that news.
The default indicator s

This multicurrency Expert Advisor uses 28 currency pairs. For predictions, the advisor uses models trained by the machine learning algorithm in the Python language environment. All signals of this advisor in real time and settings for it can be downloaded from my website forexvisible.com - copy and paste into the browser
The Expert Advisor can work with two time intervals H1 and H2 together or separately parameters in the Use Time Intervals group The profitability of currency pairs can be view

インジケータSupplyDemand RSJ PROは、グラフ上に「Supply」ゾーンと「Demand」ゾーンを計算してプロットし、ゾーンのタイプ(弱い、強い、検証済み、証明済み)を識別し、ゾーンの再テストの場合は、その回数を示します。再テストされました。 「供給」ゾーンは、需要よりも供給が多く発生し、価格が下がる価格ゾーンです。 「需要」ゾーンは、供給よりも多くの需要が発生し、価格を押し上げる価格ゾーンです。
構成可能な機能とアラートを備えたプロフェッショナルバージョンをぜひお試しください: Suppy Demand RSJ PRO
ゾーンの分類 弱い:再テストされた場合、違反される可能性が高い価格地域。 強い:トレンドの方向を変えており、すぐに再テストされる可能性が低い価格地域。 検証済み:価格が高い地域。最大で1〜3回の再テストがありましたが、価格が地域を破ることはできませんでした。 実証済み:3回以上の再テストがあったが、価格がこの地域を突破できなかった、価格の高い地域。 壊れた/ターンコート:壊れた価格領域。サポートの場合は抵抗になり、抵抗の場合はサポートになりま

テイクプロフィット、ストップロス、トレーリングストップのレベルをブローカーに見えないようにします! 主なオプション: ステルスモード バーチャルトレーリングストップ バーチャルテイクプロフィット バーチャルブレイクイーブン 仮想ストップロス 仮想注文の有効期間 警告: エキスパートアドバイザーは、それ自体では注文を行いません。 自分で注文を開くか(エキスパートパネルを介して含む)、同じ通貨ペアの別のチャートでサードパーティのエキスパートを使用する必要があります。 エキスパートがこれらの注文を処理するには、エキスパート設定でマジックナンバー「-1」を指定してください。 テストにはビジュアルモードを使用してください!!!
作業アルゴリズム あなた(または別のエキスパートアドバイザー)が買い/売り注文を開くか、保留中の注文がトリガーされるか、チャートにすでに開いているポジション/注文がある場合、エキスパートはコントロールパネルをインストールしてv-StopLossの追跡を開始します。 v-BreakEven、v-TakeProfitパラメーター。 注意: 「-1」以外のマジ

/ ********** ********** ********** ********** ********** ********** ********** ********** ********** ********** / Big Sales for Easter! Price is reduced > 50 % already! Grasp the chance and Enjoy it! / ********** ********** ********** ********** ********** ********** ********** ********** ********** ********** /
This is a powerful EA that support single order strategy, martingale strategy, multiple timeframes strategy, etc with lots of useful indicators and self defined

URバスケット
あなたができる最善のことは、注文が損失にならないようにすることです。 あとはUR Basketにお任せください。
UR バスケットを使用する利点:
すべてのパラメータは、チャートのグラフィック パネルで動的に変更可能です - パラメータを変更したり、使用した設定を思い出したりするために EA を再起動する必要はありません! 次の方法で注文を追跡できます。 - マジックナンバー - EAコメント - 上記の両方 - 一度にすべての取引 UR Basket は、CURRENCY 値、PIPS、または BALANCE または EQUITY の % を通じて利益を追跡できます。 グラフィック パネルは、これら 3 つの方法での利益を常に表示し、彼に指示する頻度を更新します。 最大の利点: 利益を確保できるため、損失を被ることはありません! 詳細については、以下をご覧ください。 ツールの最新情報を入手できる特別な電報チャットがあり、何か不足していると感じた場合はリクエストを送信することもできます!
なぜURバスケット?
単独で取引できる EA や

このマルチシンボル ダッシュボード インジケーターは、強いトレンドが特定されたときにアラートを送信できます。これは、次のインジケーター/オシレーター (以下、インジケーターとしてのみ言及します) を使用してダッシュボードを構築することで実現できます: RSI、ストキャスティクス、ADX、CCI、MACD、WPR (ウィリアムズ パーセント レンジ、ウィリアムズ %R とも呼ばれます)、ROC (価格)変化率)と究極のオシレーター。 M1 から MN までのすべてのタイムフレームで使用できます (一度に 1 つのタイムフレームのみを表示できます)。勢い、ボラティリティ、買われすぎ/売られすぎなどについての視点が得られます。このインジケーターを独自のルールやテクニックと組み合わせることで、独自の強力なシステムを作成 (または強化) することができます。 特徴
ボタンをクリックすることで時間枠を切り替えることができます。 ダッシュボード内でトレンド強度ランクのソートを継続的に実行します。ただし、特定のシンボルを見つけやすくするために並べ替えを無効にすることもできます。シンボルは、[シンボル
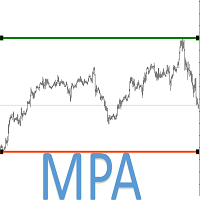
M P A (Multipair Price Action ) It is a multipair system, which uses the value of the support and resistance in the majors to detect the entry points in the EURUSD.
!!!!!IMPORTANT!!!!! THIS EA IS FOR USED IN EURUSD ONLY. !!!!!IMPORTANT!!!!!
This system uses only one operation at a time. It does not use hedging or marging systems, all operations have Stoplost, Take Profit and trailing stop, configurable. The system also allows you to configure the parameters of the value of the pairs in you

Find out in real time which side, buy or sell, is putting the most pressure through a simple and efficient visualization of Depth of Market. The indicator calculates the amount of offers at the specified depths and displays the percentage on each side in relation to the total. PressureBook Indicator is fully customizable, in which you can: Select which symbol you want to track. By default, the selected symbol is the same as the graph in which the indicator was inserted; Define the amount of pri

Pivot Point Multi Method MT5 Pivot Point Multi Method MT5 is a fully automatic pivot point indicator and indicate support and resistances (S1,S2,S3,S4,R1,R2,R3,R4) based on four Methods that you can select on of them Pivot point detection and drawing support resistances Methods( Classic ,Camarilla ,Woodie ,Fibonacci)
Pivot Point Multi Method Mt5 is working on all time frames and all currency pairs and gold silver and crypto currencies .
Recommended Setting : Pivot_Method select one of t
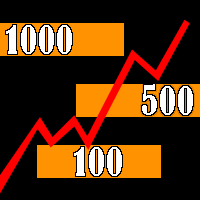
The indicator builds "psychological levels": levels of round numbers and intermediate levels of round numbers.
Round numbers play an important role in forming support and resistance levels. There is a pattern in which the decline or growth of the price can stop at round numbers.
The level whose price ends at 0 is the level of a round number of the first order. Intermediate level, this is the level between two round levels, for example, between 10 and 20 this is level 15.
In the " Num_Zeros "

Description: TrendAccess can optimize your trading time by showing you the trend via two different calculation modes quick and easy.
No more searching for Trends. Just open the chart and look at the trend display.
Features: Shows Uptrend, Downtrend and "No Trend" indicator
Shows the calculated ZigZag Profile
Works on all timeframes Two different calculation Modes (MACD and Candle-based calculation)
Settings: Variable
Standard Value Description
Calculation Mode
Candle based
Choose betwe
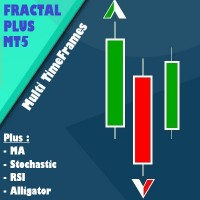
Fractal Plus is a trading tool in the form of an expert advisor. I n it there are 1 indicators that are position execution and 4 indicators that function as filters. You can choose whether each indicator is active or not, it can even be combined according to your trading needs. All filter indicators have multi timeframes options.
Indicators as execution position: 1. Fractal
4 Indicators as Filter: 1. Moving Averages 2. Stochastic Oscillator 3. RSI 4. Alligator
Parameter Information: - Lot Mo

Description. This EA base on Accelerator oscillator indicator and Parabolic sar indicator. Accelerator oscillator details. set = iAC(_Symbol,_Period); Parabolic sar details. set = iSAR(_Symbol,_Period,0.02,0.2); This is only Buy EA. This EA fixed details in side. Only input is volume. Because i need to keep it simple. Buy order when Accelerator oscillator indicator and Parabolic sar indicator had a signal for buy. Close order when Accelerator oscillator indicator and Parabolic sar indicator had

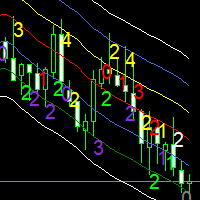
Moving averages are a simple and serious indicator for evaluating the development of a price. But which configuration to choose? 12 periods ? 20 periods? There is not a single moving average setup for all instruments, at all times, for all time periods, simply because not all instruments have the same volatility, they are all very different. They have a signature. The Signature App is a powerful decision support tool. It is based on the use of moving average envelopes. The program calculates th
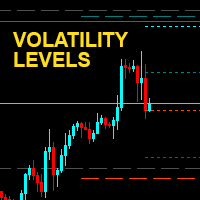
Transfer volatility levels to the chart to understand the nature of the ongoing movements. The levels are calculated based on the volatility recorded in the last few sessions. Easily identify possible targets or swing points for intraday , daily and weekly trading. In addition, the round price levels considered most important are also visible, here the highest trading volumes are usually concentrated. NO REPAINT
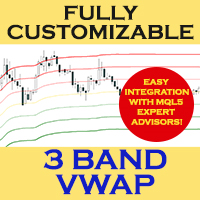
3-BAND VWAP (Volume Weighted Average Price)
Fully customized and EA-friendly VWAP Bands Indicator
MAIN FEATURES:
Choose the period of the VWAP calculation reset (Daily, Weekly or Monthly): For day trading use the Daily VWAP, and for longer term analysis use the Weekly or Monthly calculations.
Fine adjustment of the deviation of the bands: Find the best band’s deviation for the instruments you trade and adjust accordingly.
Customize line colors, style and width according to your chart p

Capital protector MT5 is an Expert Advisor who works based on the profit and loss of your account. Its functions include: Closing of all orders when a certain profit or loss is reached. Remove any other Expert Advisor installed on a secondary chart when a certain profit or loss is reached. Send a notification to the mobile when a certain loss or profit is reached. To configure the Expert Advisor you will only have to program the loss limit that you are willing to lose or the profit limit that

This MT5 indicator, Bull Bear Visual MTF V2, summarize the strength color graphic and percentages of power for both Bull and Bear in current market emotion stage which will show you in multi timeframes (21) and sum of the total Bull and Bear power strength which is an important information for traders especially you can see all Bull and Bear power in visualized graphic easily, Hope it will be helpful tool for you for making a good decision in trading.

ADX is one of the most versatile indicators, understanding it can help you understand the true nature of movements. It is often used within automatic experts to filter input signals. Unfortunately in its original form it is not immediately understandable. This version aims to simplify its reading by transferring the burden of interpreting its values to the code. The result is a clear graph where it is easy to identify the accumulation and distribution phases, trend phases and excesses. The color
Сообщения в Telegram из MT5 о торговых событиях: Открытие/закрытие сделок; Выставление/удаление отложенных ордеров. Версия утилиты для MT4 здесь: https://mql5.com/8bjjy Настройки Telegram:
Создайте своего бота. Для этого напишите для пользователя @BotFather команду /newbot , и следуйте инструкциям. В результате вы получите Token бота, примерно такой: 1245680170:BBGuDFVkTYIPtjSaXMgQEhdfg7BOQ6rl8xI. Узнайте свой ID в Telegram, для этого напишите пользователю @userinfobot любое сообщение.

This MT5 indicator, Bull Bear Visual MTF (21 Time Frames), summarize the strength color graphic and percentages of power for both Bull and Bear in current market emotion stage which will show you in multi time frames and sum of the total Bull and Bear power strength which is an important information for traders especially you can see all Bull and Bear power in visualized graphic easily, Hope it will be helpful tool for you for making a good decision in trading.

This algorithm is based on the grid strategy and performs dynamic position management to make it work on netting accounts. Unlike other robots, this grid system bases its entries on profit over time of the asset instead of using pips. This parameter is the one that corresponds to "Average Distance".
You can trade all 28 major currencies simultaneously. Parameters: +------------------------------------------------------------------+ :-:-:-:-:-:-:-:EXPERT SETTINGS:-:-:-:-:-:-:-: +---------------

A "Volume Profile" is an advanced charting indicator that displays total volume traded at every price level over a user specified time period. The main components of the volume profile are POC ( Point Of Control - the price level, at which the maximum number of contracts were executed during a selected period), VAH ( Value Area High - the highest price in the Value Area) and VAL ( Value Area Low - the lowest price in the Value Area).
When we settled on the original indicator, we spent a lot of

Описание индикатора будет крайне коротким. Индикатор Коридор тренда показывает трейдерам зону в которой находится валюта и даёт понимание по какому тренду движется рынок. Визуально очень хорошо воспринимается. Уровни взяты и просчитаны не просто. Полезный индикатор для арсенала индикаторов трейдера. The description of the indicator will be extremely short. The Trend Corridor indicator shows traders the zone in which the currency is located and gives an understanding of which trend the market is

Индикатор RSI MT5 - это индикатор Metatrader 5, и суть этого технического индикатора заключается в преобразовании накопленных исторических данных на основе индикатора RSI. Сигналы показаны разными цветами свечей. Смотрите настройки, тестируёте. Это очень полезный индикатор и он точно должен быть у вас . The RSI in candlelight MT5 indicator is a Metatrader 5 indicator, and the essence of this technical indicator is to transform the accumulated historical data based on the RSI indicator. Signals a

Deflection MT5 (MT4 version https://www.mql5.com/ru/market/product/63276 ) - a trend following expert advisor. It is based on strategy of searching entry points in the beginning of a trend. 2 EMA are used for a signal determination. Deflection has an adaptive system of profit and losses targets calculation which is based on current volatility. The control of risks is managed by TP/SL ratio and via setting risk per trade of a balance amount. Stop Loss and Take Profit targets in points are calc

" A trading range occurs when a financial instrument trades between constant high and low prices over a period of time. The upper part of the trading range of a financial instrument often provides price resistance, while the lower part of the trading range usually offers price support. Traders can enter in the direction of a breakout or breakdown from a trading range... "
This is the "Classical Theory" understanding of ranges. We have a different understanding of the nature of ranges and the

Индикатор Trading Strategy призван помочь трейдерам в поиске оптимальных входов в сделку и выходов из неё. В его основе лежат показания технических индикаторов (MA, RSI, ATR и др.), а также авторский алгоритм, связывающий их сигналы в единое целое. Индикатор даёт сигналы на покупку и продажу в виде стрелочек: стрелочка вверх — сигнал на покупку, вниз — на продажу. В правом верхнем углу показаны сигналы индикатора на 6 таймфреймах (M1, M5, M15, M30, H1, H4) данной валютной пары. Индикатор свои з

The MA Bounce Strategy is a strategy that seeks to long FX pairs on a strong uptrend as they bounce off their MA support and shorting FX pairs on a strong downtrend as they bounce off MA resistance. The best suitable periods of moving averages for that strategy are 18, 30, 50. This indicator helps to identify and find place for potential market entry by MA bounce strategy. More information about MA Bounce Strategy can be read by this link https://www.mql5.com/en/blogs/post/743037 . By defau
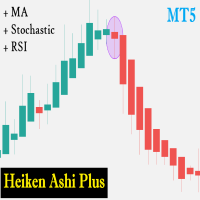
Heiken Ashi Plus is a trading tool in the form of an expert advisor. This EA works based on the change in the color of the Heiken Ashi candle. called a plus because there are additional indicators such as Moving Averages, Stochastic and RSI which you can combine its use with Heiken Ashi candles.
Update V2. = Add Multi TimeFrames Features
Explanation of EA parameters LotMethod : 1 = Fixed Lot, 2 = RiskLot (Freeze of Balance), 3 = Martingale System TrailingStart : Trailing will activated after
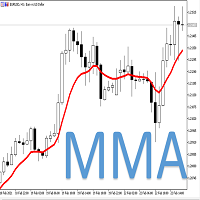
This system use M M A (Multipair Moving Average ) It is a multipair system, which uses the value of the averages in the majors to detect the entry points in the EURUSD.
!!!!!IMPORTANT!!!!! THIS EA IS FOR USED IN EURUSD ONLY. !!!!!IMPORTANT!!!!!
Only one operation at a time. It does not use hedging or marging systems, all operations have Stoplost, Take Profit and trailing stop, configurable. The system also allows you to configure the parameters of the averages that give us the entry and the
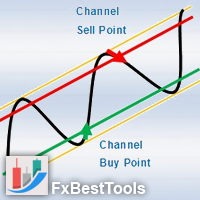
Channels Indicator is an All-In-One Indicator with a powerful calculation engine. The Indicator contains 4 different and usual methods for finding channels on the market. Indicator is powered by a visual interface and with various selections of alerts and notifications.
Testing Indicator : Strategy Tester does not respond to your clicks on panels (This is metatrader tester limitation). Thus input your desired settings on the indicator pre-settings and test.
Using Indicator :
Display 4 Typ

This easy to setup indicator shows you the market volumes in a different way, with support and resistance as showed. You can setup: - Backdays volume to show - Heiken Ashi candle view It works for every kind of graph and every kind of period. The program shows the volumes based on the number of candles displayed in the chart: the more candles the more volumes. Enjoy this very useful indicator.
Please feel free to message me to report any kind of improvements! :D
MetaTraderマーケットは自動売買ロボットとテクニカル指標を販売するための最もいい場所です。
魅力的なデザインと説明を備えたMetaTraderプラットフォーム用アプリを開発するだけでいいのです。マーケットでプロダクトをパブリッシュして何百万ものMetaTraderユーザーに提供する方法をご覧ください。
取引の機会を逃しています。
- 無料取引アプリ
- 8千を超えるシグナルをコピー
- 金融ニュースで金融マーケットを探索
新規登録
ログイン