YouTubeにあるマーケットチュートリアルビデオをご覧ください
ロボットや指標を購入する
仮想ホスティングで
EAを実行
EAを実行
ロボットや指標を購入前にテストする
マーケットで収入を得る
販売のためにプロダクトをプレゼンテーションする方法
MetaTrader 5のためのエキスパートアドバイザーとインディケータ - 86

When using CCI (Commodity Channel Index) oscillator, the waiting time till the next signal can be long enough depending on a timeframe. CCI Alerts indicator prevents you from missing the indicator signals. It is a good alternative for the standard CCI indicator. Once there appears a CCI signal on the required level, the indicator will notify you with a sound or push, so you will never miss an entry. This is especially significant if you follow the indicator in different timeframes and currency p

EvoNightEA MT5 v.10.3 Presets: Download >>> EvoNightEA MT5 v.10.3 Live Results: Here >>> EvoNightEA is a fully automated Expert Advisor based at midnight scalping during the low market volatility. EvoNightEA is based on the principles of channel trading and Price Action. The system analyzes the price movement in the daily range and, based on the data obtained, trades in the low-volatility market in rollover. Most of the parameters are dynamic, thus reducing the chance of overfitti

Fibonacci decorator is a unique product that decorates Fibonacci objects. This indicator can change the specific level line of a Fibonacci object. This tool caters to both beginners and advanced traders using Fibonacci objects.
Advantages Supports three Fibonacci objects: Fibonacci Retracement Fibonacci expansion Fibonacci time zones Just add the mark of your choice to the description of a Fibonacci object's level Easy setting This indicator does not work well with Strategy Tester. Please down

This long-term trading system works on 9 pairs and timeframe. The Expert Advisor uses various trading systems, such as trend trading, counter-trend trading and others. The EA has the built-in smart adaptive profit taking filter. The robot has been optimized for each currency and timeframe simultaneously. EA uses economic news. No martingale, grid and other risky strategies. EA uses timeframes:
MetaTrader 4 MetaTrader 5 M5, M15, M30, H1 M2, M3, M4, M5, M6, M10, M12 , M15, M20, M

All traders face to a serious question: How to estimate trading strategy performance and control risk in real-time? Eventhough use backtest and optimizing in strategy tester, but unfortunately, trader need to deal with the curse of curve-fitting, because optimized result is just for the specific set of historical data that was tested. This indicator retrieves deal information from historical data then draws balance and equity curve of account and calculate drawdown in REAL-TIME. It helps trader
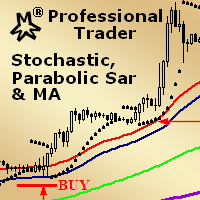
MMM Stochastic, PSAR & MA: This EA's strategy is a combination of two indicators types (Oscillator and Trend) and a Moving Average which helps to enhance the price trends signals and decide to open a new order at the right time. There is an Stochastic (Oscillator) indicator, a Parabolic SAR (Trend) indicator and a Moving Average that you may tune by using the strategy tester optimization to help you to find the best input values that will give you the best results ; It is highly recommended for

This tool allows you to better analyze your chart. With "Crosshair Percent", you can calculate distances in the chart in a percentage way (in a very simple way, when the pointer is attached in the form of a crosshair: CRTL + F). The utility allows to measure and/or calculate the movements of the price NOT only in points, use a measure in professional terms as it is the percentage. The result is shown in two parts of the screen, one of them, next to the position of the pointer and the other in a
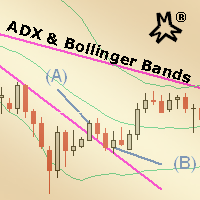
MMM ADX & Bollinger Bands & MA strategy: This EA's strategy combines two built-in indicators to enhance its signals and decide to open a new order at the right time. There is an ADX indicator and you may choose its signal's strength and Bollinger Bands indicator confirms the trends and MA to check if the prices are deviating from its pattern. By joining both indicators' data and the moving average, it is possible to calculate quality signals, avoiding sudden market movements against your tradin
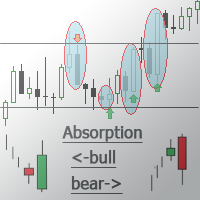
This indicator detects the Engulfing candlestick pattern and draws the corresponding market entry signal.
Features It works on all pairs and timeframes. The indicator analyzes a combination of 2 or 3 candlesticks depending on settings. The number of pre-calculated bars (signals) is configurable. The indicator can send an alert to notify of a found signal. Signal can be filtered by setting the number of candlesticks of the same color (trend) preceding the pattern formation. The indicator has an
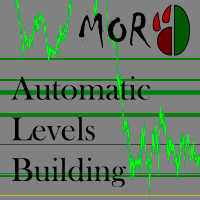
This indicator is designed to automatically build support/resistance levels. The indicator calculates the density of the price distribution in the specified time range and creates a table of volumes for each price. Levels are constructed from the minimum to the maximum volumes specified by the user. Some input parameters can be changed using hot keys without opening the settings window.
Inputs StartPoint - start bar number Range - length of the level in bars (time range) VolumeMin - minimum vo

The EA RSI Hill Pro trades on signals from the indicator RSI and moving averages. To determine a more accurate experience, the Stochastic indicator is used.
EA parameters RSI timeframe - Timeframe indicator RSI. Suitable value: M15 M30 H1 Period RSI - The period of the RSI indicator. Recommended value 14. Stoch timeframe - Timeframe indicator Stochastic. Suitable value: M15 M30 H1 % K period - K period of the Stochastic indicator. Recommended value 14. % D period - D period of the Stochastic
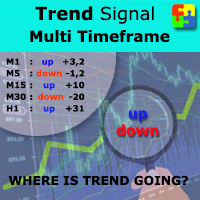
Do you want to always know in a quick glance where price is going? Are you tired of looking back and forth between different timeframes to understand that? This indicator might just be what you were looking for. Trend Signal Multitimeframe shows you if the current price is higher or lower than N. candles ago, on the various timeframes. It also displays how many pips higher or lower current price is compared to N. candles ago. Number N. is customizable The data is shown in a window that you can m
Introduction to EFW Analytics EFW Analytics was designed to accomplish the statement "We trade because there are regularities in the financial market". EFW Analytics is a set of tools designed to maximize your trading performance by capturing the repeating fractal geometry, known as the fifth regularity in the financial market. The functionality of EFW Analytics consists of three parts. Firstly, Equilibrium Fractal Wave Index is an exploratory tool to support your trading logic to choose which r

The script creates a brief daily summary report of the weekly trade in a separate window.
Input parameters of the script number of weeks - set the time interval (the number of weeks) for the report. switch for symbols selection - three modes for selecting the instruments to generate the report: All_Symbols - report is generated for deals of all instruments. Current_Symbols_Only - report is generated only for deals of the instrument in the current window. Without_Current_Symbols - report is gen
The trading system operates on seven pairs and one timeframe. The Expert Advisor uses trading systems for trend-based entries with the help of the Envelopes and CCI indicators. Each indicator uses up to five periods for calculating the trends. The EA uses economic news to calculate the prolonged price movements. The EA has the built-in smart adaptive profit taking filter. The robot has been optimized for each currency and timeframe simultaneously. Attention! This EA is only for "hedging" account

The TickDelta indicator shows the difference in the number of oscillations of the best prices per unit of time. In this case, the unit of time is the specified timeframe (M1, M2, M5, M15, etc.). This value indirectly shows the market "sentiment". Due to the "tick-wise" nature, the indicator is more appropriate for use in scalping strategies. When applied in conjunction with real volumes and monitoring of various instrument charts, it is possible to identify certain reversal setups. In some cases
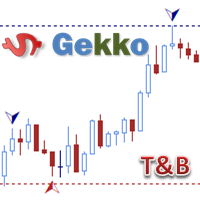
Type: Oscillator This is Gekko's Famous Tops and Bottoms indicators. Find important Tops and Bottoms on chart of any symbol or timeframe, based on set of configurations to adjust the indicator to the instrument you are trading.
Inputs Calculate Tops and Bottoms for the past X Bars: number of bars the indicator will plot Tops and Bottoms for, the fewer the faster. At Least Two Bars Making New Highs or Lows to Confirm: true - only consider a new High or Low when the last 2 bars have Highs or Low
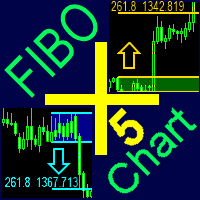
A ready-made trading system based on automatic plotting and tracking of Fibonacci levels for buying and selling any symbol on any timeframe.
Advantages Determines the trend direction (14 indicators) Displays the trend strength and the values of indicators comprising the trend direction Plotting horizontal levels, support and resistance lines, channels Selection of the Fibonacci levels calculation type (6 different methods) Alert system On-screen Email Push notifications
Buttons Changing the
"All in One" Expert Advisor. It can work simultaneously on:
up to 6 periods; up to 31 popular signals. Features:
You can see the sum for all signals taking into account the weight of the signal Trades on each timeframe are managed separately from each other It is possible to set different Money Management for each timeframe Version MT4: https://www.mql5.com/ru/market/product/27996 Version MT5: https://www.mql5.com/ru/market/product/27835
Parameters NUM_BAR - number of the bar to analyze

This multi time frame and multi symbol indicator identifies high-probability breakout patterns. It does this by identifying strong, symmetrical pennants and triangles. This pattern DOES NOT appear very often on higher timeframes. But when it does, it is a very high-probability setup. The indicator also includes an Inside bars scanner. It can for example be used to detect a special type of Inside bars formation which is formed by a Master candle (MC) followed by 4 inside candles (please see the

Версия 2.0 2018.10.20 1. Добавлен расчет коэффициента ранговой корреляции Спирмена.
2. При наведении курсора на показатель таблицы появляется всплывающая подсказка (Расхождение RSI, направление сделок, информация о свопе). Table of currency pairs - разработана в помощь трейдеру торгующему на рынке Форекс по методу основанному на корреляционной зависимости валютных пар. Корреляционная зависимость между двумя инструментами рассчитывается через коэффициент К. Пирсона. Основная функция таблицы -

MetaTrader 4 version is available here: MT4 Drawer . This tool allows you to draw on the chart using keyboard shortcuts. It also provides some custom drawing tools for your convenience. You can configure 3 variants for each tool (6 for advanced patterns), which you will be able to choose from dashboard. There is also, a possibility to define up to 30 quick access keys that skips the dashboard step and goes straight to drawing. Here are the list of supported tools: Advanced Pattern - draws two t
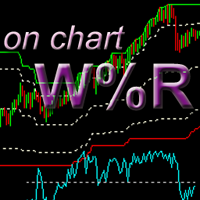
This is a variation of Williams' Percent Range indicator which draws high/low/mid range and overbought/oversold levels directly on the chart, where the last candle Close price corresponds to the %R value. Advantage of this representation is that it is possible to see exact extremum reaches by price (0 and -100 levels) and current price value in regards to overbought/oversold conditions. In addition, this indicator allows tracking price action on a different timeframe (for example, see the price

This is Gekko's Strong Bars indicator. It produces signals when there is a strong bullish or bearish bar, for that it uses three different conditions: 1 - when the current bar is higher/lower than the last x bars (x is an input parameter), 2 - when the current bar size is higher than the average size of the last x bars (x is an input parameter) and 3 - when the current bar has a short candle tail (shadow).
Inputs Plot Strong Bar Arrows for the past X Historical Bars: number of historical bars

Copyist MS — это простой и удобный в использовании торговый копир. Работает как однофайловый советник с переключаемыми режимами работы Master и Slave. Ордера можно копировать из МТ5 в МТ5, из МТ5 в МТ4, из МТ4 в МТ5. Для копирования ордеров в MetaTrader 4 требуется версия советника для MetaTrader 4. Текущая версия советника работает только на ХЕДЖИНГОВЫХ счетах. Параметры Тип работы - выбор режима работы: Master или Slave; Копировать по магическому номеру - копирование торговых ордеров по магич

Open Season is a fully automated Expert Adviser that allows 'active' and 'set and forget' traders to trade high probability EURUSD H1 price action breakouts. It detects price action set ups prior to the London Open and trades breakdowns. The EA draws from human psychology to trade high probability shorts Every trade is protected by a stop loss In-built time filter Three position sizing techniques to suit your trading style Two trade management techniques The EA does not use a Martingale system T

This is an automated Expert Advisor that trades using the MACD and Envelopes indicators. The paid version is available here . The free version has the following limitations. No panel for opening orders. The trading is limited to the EURUSD currency pair and similar. Orders can only be opened with the minimum lot, no more than 5 orders can be opened in the same direction, to a total of 10 orders. Pause after closing of all orders is 6000 minutes. During the analysis, no more than 50 orders are ad
FREE
Would you like to have statistics about your trades displayed while you operate? Have you a solid understanding of the symbol you are trading? Do you really know everything you need to about your trading account? Do you need to keep an eye on the local times around the world? Advanced Info Displayer answers to all that. It helps you to know many hidden or hard to find data. Also, it is very convenient if you value statistics and maths. Just to exemplify, in more than 80 lines of information you

Plug’n’Trade BR is an Expert Advisor with a minimum number of input parameters. The robot is designed for trading the Brent oil futures contract (BR) on FORTS derivatives market. Plug’n’Trade trades using unique technical indicators, which perform mathematical analysis of the price movement. The EA automatically sets the optimal stop loss and take profit. Plug’n’Trade works on M30 chart. All computations are performed when a new candle forms. This robot does not require optimization and is easy

This algorithm uses statistically justified comparison of historical prices and output values of the CCI and ATR indicators to decide whether it is necessary to open position. This logic has been created as a result of the use of stochastic methods, it has been tested on history data and verified by the Monte Carlo method, which, of course, does not guarantee future results. The EA is designed to trade EURUSD M15 during morning hours. Despite the fact that this condition is not mandatory, the tr

This version of the AshiMomentum multicurrency Expert Advisor works based on short-term changes in the trend, creating the price "corridor" set in the parameters. Trading is carried out at the external borders of this corridor by opening positions in different directions with different lot sizes. This achieves a very high probability of closing positions in profit.
AshiMomentum is intended for trading any currency pair on the M1 timeframe or higher.
No martingale, no arbitrage.

Turnover Expert Advisorはインジケーターを使用せず、保留中の注文BUYSTOPおよびSELLSTOPでのみ機能します。 EAでのすべての作業と計算は、保留中の注文と市場でのオープンポジションに基づいています。 EAは、平均ポジションへの自動ロット増加を使用します。損失限度額は、残高のパーセンテージとして指定された負の数として設定されます。 EAが開始されると、2つの保留中の注文が出されます。注文がトリガーされた場合、設定された利益でクローズするか、注文の利益が不採算である場合、損失を平均化するために同じ方向に追加の注文が出されます。したがって、一方向注文の総利益が正の場合、そのような一連の注文は強制的にクローズされます。
アドバイザ設定の説明 OrderLevel-現在の価格から保留中の注文を出すレベルまでの距離(ポイント単位) TakeProfit-ポイント単位の注文利益レベル LevelAverage-追加の平均化注文が出される後の価格ロールバックレベル TakeProfit_Average-複数のポジションの利益レベルを同時に計算するための値 Dra

The Trend Detect indicator combines the features of both trend indicators and oscillators.
This indicator is a convenient tool for detecting short-term market cycles and identifying overbought and oversold levels. A long position can be opened when the indicator starts leaving the oversold area and breaks the zero level from below. A short position can be opened when the indicator starts leaving the overbought area and breaks the zero level from above. An opposite signal of the indicator can
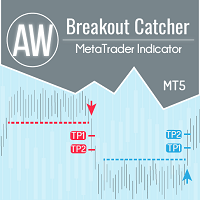
価格レベルの内訳、高度な統計、TakeProfit 計算、および 3 種類の通知。 利点: 結果を再描画しないでください ろうそくの終わりに厳密に信号を送る False Breakdown フィルタリング アルゴリズム どんなトレンド戦略にもよく合います。 すべてのツールと時系列で動作します マニュアルと説明 -> ここ / 問題解決 -> ここ / MT4 バージョン -> ここ インジケーターで取引する方法 わずか 3 つの簡単なステップで AW ブレイクアウト キャッチャーを使用して取引できます。 ステップ 1 - ポジションを開く 70% 以上の成功率で買いシグナルが受信されました ステップ 2 - ストップロスの決定 逆信号でトランクを選択 ステップ 3 - テイクプロフィット戦略の定義 戦略 1: TP1 に到達したらポジション全体をクローズする 戦略 2: TP1 に達した時点でポジションの 50% をクローズし、TP2 に達した時点で残りの 50% をクローズします。 戦略 3: 反対のシグナルでポジション全体を決済する 統計モジュール ペアをより適切に選
The EA is recommended for trading EURUSD(or EURGBP) M15 or M30. It is based on the strategy of "waiting out", the market entry (and exit) points are determined on the basis of correlation of a number of indicators. The trading volume for opening a position depends on results of previous trades. It is possible to limit the amount of risk (the AutoMM parameter). It is also possible to set the maximum spread, above which the EA will automatically suspend trading (the MaxSpread parameter). It also h

This is a utility designed to automatically set the stop loss levels of orders according to the specified condition. Two price levels serve as the condition for setting stop loss: Trigger level - when this level is reached, an order is placed. The stop loss value of an order. It is possible to enable or disable traling stop loss.
Input parameters Order type for execution - type of orders to be processed by the expert. It can either be BUY, SELL or auto-select. Trigger Level Points - level to p

EFW Pattern Trader is a powerful pattern scanner for Forex and Stock trading. The pattern detection in EFW Pattern Trader uses the Fractal Wave Theory, which captures the endless up and down movement of the market. Therefore, EFW Pattern Trader can be considered as the robust price action indicator. Any patterns in EFW Pattern Trader can be backtested visually in your strategy tester. Visual backtesting with pattern will show you how pattern will likely behave in the live trading. Therefore, you

This Expert Advisor is designed for a large number of positions with a small profit. In case of a drawdown, a position is opened in the opposite direction with recalculated lot size and reduced amount of points for closure. It trades along the trend based on Moving Average, and opens positions during a drawdown based on Stochastic. For each addition of a position, there are certain rules that take the current situation into account. Lot size for the first position is also calculated automaticall

Regent Street, rather than an expert or an indicator, is an all-in-one trading assistant easing your trading sessions by providing signals and notifications. It's an assistant rather than a robot - "an assisted steering rather than an autopilot", and now, it autoadjusts itself to any instrument, any timeframe & any circumstance. Note from the author: Regent Street's frontend is exactly the same as an other product Ermou Street , but the backend is different. Performances for each are very relati

One of the main goals in the development of this Expert Advisor was ease of use. As a result, this EA has a minimum of parameters, which are easy to understand. At the same time, it is very flexible and customizable for almost for any instrument (currency pair).
The logic According to the given algorithm, the EA determines local support and resistance levels (at startup, the previous quotes are disregarded). When a candle closes beyond any level, a deal is opened in the opposite direction, exp

The Trade Helper indicator is a modification of the Trade Assistant indicator (by Andriy Moraru). The Trade Helper multitimeframe indicator is a good assistant for traders, useful as a filter in most trading strategies. This indicator combines the tactics of Elder's Triple Screen in a single chart, which lies in entering a trade when the same trend is present on three adjacent timeframes. The indicator operation is based on the principle of determining the trend on the three selected timeframes

Lotus indicator combines the features of both trend indicators and oscillators allowing you to track the smoothed price change rate, as well as trend strength and change. The uptrend is shown as a green indicator line, while a downtrend is displayed in red. A long position can be opened when the indicator breaks the zero level from below. A short position can be opened when the indicator breaks the zero level from above. An opposite signal of the indicator can be used for exiting positions. You

MeetAlgo Asian Scalper is an Expert Advisor that uses range breakouts strategy to enter trades when the market is the most quiet. It will scalp the market for small price deviations. This EA will need a good broker with small spread to work successfully. It is fully optimized for AUDCAD, EURAUD, GBPAUD, GBPCAD, GBPCHF and GBPUSD . The trades are based on several indicators and it's not a tick scalper EA. It need 1:300 leverage minimum, and a low spread broker. It is recommended to use a low spre

発見が困難で頻度が少ないため、分岐は最も信頼できる取引シナリオの1つです。このインジケーターは、お気に入りのオシレーターを使用して、通常の隠れた分岐点を自動的に見つけてスキャンします。 [ インストールガイド | 更新ガイド | トラブルシューティング | よくある質問 | すべての製品 ]
取引が簡単
通常の隠れた発散を見つけます 多くのよく知られている発振器をサポート ブレイクアウトに基づいて取引シグナルを実装します 適切なストップロスおよび利益レベルを表示します
設定可能なオシレーターパラメーター カスタマイズ可能な色とサイズ バー単位でサイズ別に分岐をフィルタリング パフォーマンス統計を実装します 電子メール/音声/視覚アラートを実装します 幅広い市場の見通しを提供するために、異なるオシレーターを使用して、干渉なしで同じチャートにインジケーターを何度もロードできます。このインジケーターは、次のオシレーターをサポートしています。 RSI CCI MACD オスマ 確率的 勢い 素晴らしい発振器 加速器発振器 ウィリアムズパーセントレンジ 相対活力指数 特に外国為替市

Risk Manager Pro is a simple utility that calculates the necessary lots with the risk percentage and the pips of stop loss, before opening positions. The web calculators can be useful in some cases but they are not efficient to open operations in real time. In the trading days, there are few opportunities to open positions and when the opportunity arises, the seconds make the difference. This is not possible with conventional web calculators, since to calculate the size of an operation regarding

This EA uses an Alligator indicator and has a classic strategy to trade as the Alligators Jaw, Teeth and Lips calculation results are compared each tick. This way, the EA opens orders at right moment and closes the orders as it reaches the right profit value. It protects your money because it is provided with: trailing stop loss to protect your profit. Once your order has a positive profit, it sets SL at a certain distance in order to keep a positive profit; Spread value limit to prevent opening

The ForexGenerated Expert Advisor works based on short-term changes in the trend, creating the price "corridor" set in the parameters. Trading is carried out at the external borders of this corridor by opening positions in different directions with different lot sizes. This achieves a very high probability of closing positions in profit. ForexGenerated is intended for trading any currency pair on the M5 timeframe or higher. However, backtests indicate that it is best suited for NZDUSD on M5.
C

IndCorrelationTable Ind Correlation Table - 通貨ペアの相関関係に基づく方法を使用して、Forex市場でトレーダー取引を支援するように設計されています。 2つの計測器間の相関依存性は、K. PearsonとC. Spearmanの係数によって計算されます。この表の主な機能は、事前設定されたパラメータ、および戦略に従ってトランザクションの方向に従ってトランザクションの「バスケット」を開く可能性についての形式化された信号を出力することである。他のデバイスに通知する必要がある場合、プッシュ通知と電子メールを介して信号を複製することができます。 アプリケーション: 相関係数の計算(変換はキャンドルの終了時に実行されます)。 インジケータの入力パラメータで作業するには、推奨されたしきい値がすでに設定されています。 信号数を増やすには、複数の時間枠に同時にテーブルを適用することができます(M15からH1の推奨時間枠)。
指標パラメータ シンボル(1,2,3) - 通貨ペアのバスケットのリスト(1つのリスト17に入力されたバスケットの数の制限)。 Tim

As the name suggests, the utility collects ticks and uploads them to a file. Each symbol receives its own folder. A directory in the symbol folder is created for each date so that you can find ticks of a necessary symbol and date quickly and easily. The collector is made as fast as possible within MQL. One collector is sufficient for each symbol. Timeframe does not matter. The utility features the function for displaying ticks collected in a file on a chart. You can also navigate ticks using a k

This robot is based on martingale logic but with flat lot size increment and limiting the opening trade frequency to avoid big risk due to this logic. The positions are opened in both direction without setting Take Profit and Stop Loss. Stop Loss is set only in case of running a positive trade and will be trailed. The closure of all the opened positions is done by robot when the target profit is reached. Suggested period is M1, but it also works with others. Can be used on all pairs using defaul
The EA is recommended for trading GBPUSD M5. It is based on the strategy of "waiting out", the market entry (and exit) points are determined on the basis of correlation of a number of indicators. The trading volume for opening a position depends on results of previous trades. It is possible to limit the amount of risk (the AutoMM parameter). It is also possible to set the maximum spread, above which the EA will automatically suspend trading (the MaxSpread parameter). It also has advanced feature

One of the main goals in the development of this Expert Advisor was ease of use. As a result, this EA has a minimum of parameters, which are easy to understand. At the same time, it is very flexible and customizable for almost for any instrument (currency pair).
The logic According to the given algorithm, the EA determines local support and resistance levels (at startup, the previous quotes are disregarded). When a candle closes beyond any level, a deal is opened in the same direction. By defa

A personal implementation of a famous trend principle known as higher high, higher close, lower low, lower close (HHHC - HHHL). It uses price action alone to determine trend direction, trend changes and pullback zones. [ Installation Guide | Update Guide | Troubleshooting | FAQ | All Products ] Customizable breakout period Customizable colors and sizes It is non-repainting and non-backpainting It implements alerts of all kinds The indicator defines three price zones: Buy zones are blue Sell zon

This is a general purpose indicator that displays colored lines at fixed and customizable price intervals, entered as parameters. It offers universal, constant, and familiar price ranges that allow quick and precise price analysis of a currency pair. With default parameters, this indicator implements The Quarters Theory , as described originally by Ilian Yotov . [ Installation Guide | Update Guide | Troubleshooting | FAQ | All Products ] Easy to use No optimization needed Customizable price int

Harrow Strikes is an Expert Advisor that has been developed based on Harrow Order for MetaTrader 4. This is the MetaTrader 5 version and also based on Support and Resistance, Martingale and Anti-Martingale method. Since MetaTrader 5 already supports the use of hedging in trading, the algorithm of this EA has little differences from the original Harrow Order. For more information about Harrow Order, you can read https://www.mql5.com/en/market/product/28456 . Same as Harrow Order, the Support and
Sato - smart automatic trading robot, which makes trend transactions using up to 15 trend indicators. The robot is developed on the basis of a real trading strategy. Very easy to configure, does not require special knowledge. You can quickly start trading using the default settings. The robot is optimized for 26 currency pairs and does not need optimization. Stop-loss and take-profit are established for each order, and also various methods of order modifications are used. Monitoring : https://
Those familiar with chess-playing robots that successfully defeat grandmasters, know very well what a complex and large card catalog is. As a result, the Expert Advisor's algorithm is based on 320 reversal and 302 flat patterns formed by day candles on 7 major currency pairs, displayed on screenshots ( EURUSD_i, GBPUSD_i) from 12.01.2012 to 04.22.2018 (account currency USD, "Every tick" test mode, M1, MetaTrader 5). Positions are opened by analyzing the current and previous day candles with impu
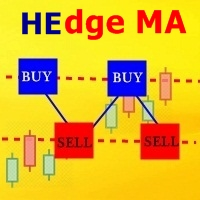
Hedge MA is both a moving average cross EA and hedging EA, designed to recover a loss of a losing trade by opening an opposite trade, or more, if necessary. If the initial trade will be lost, the hedge trade will win. If the initial trade wins, then the hedge trade might not even get triggered and will be cancelled. The EA is designed for МТ5 hedge accounts. Recommended account - cent МТ5 hedge, at least 15000 USD cents ($150), leverage - 1:500. Recommended timeframe - М5. The default settings a
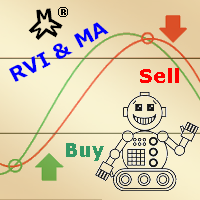
The strategy is based on RVI osculation to check the prices trend and direction and check the moving averages (Open Price and Low Price) to decide about the viability of opening any order. Market is very unpredictable due to economic news published every hour, but our EAs are really prepared for such hostility due to its protections. This Expert Advisor is provided with two kinds of indicators: an oscillator (RVI) in order to check the prices osculation limit pattern and direction trend; two Mov

マルチチャートリフレッシュMt5は、高速でスムーズに不可欠なスクリプトであり、複数のチャートを同じものから同時にリフレッシュすることができます。マルチタスクにより、更新するシンボルを事前に選択できるため、これが可能になります。 それはどのように機能しますか?
チャートを開き、ナビゲーターからスクリプトをドラッグしてチャートにドロップします。目的の記号を設定し、[OK]をクリックします。これはスクリプトであり、エキスパートアドバイザーではないことに注意してください。プログラムは、タスクが完了するとチャートから自分自身を削除します。ターミナルのジャーナルの詳細情報は、どのシンボルが希望のバー数で更新されているか、更新されていないかについて印刷されます。これより簡単なことはありません!
スクリプトメニュー設定 シンボルの選択-目的のシンボルを設定します シンボルプレフィックス-シンボルプレフィックスが存在する場合は入力します。プレフィックスのみです。 記号の接尾辞-記号の接尾辞が存在する場合は入力します。その接尾辞のみです。 何本のバーでチャートを更新しますか? -更新/チャートす

ACB Trade Filter indicator provides a way to filtering out the low probability trading entries in a trading strategy. The indicator uses a sophisticated filtration algorithm based on the market sentiment and trend. The MT4 version of the same indicator is available here ACB Trade Filter MT4
Applications Works great with our indicator ACB Breakout Arrows MT5 Filter out low probability signals from any indicator. Avoid over-trading and minimize the losses. Trade in the direction of market sentim

A grid expert with a trained neural network for the GBPUSD currency pair, timeframe H1. Fully ready to work. The expert determines the trend and opens a series of orders for each price correction. It is possible to limit the number of orders in each grid of orders. To work, you can use a standard lot or a percentage of available funds. The Expert was tested on an account with a leverage of 1:100, with a different leverage, change the Percentage parameter.
Parameters PlusB

This Expert Advisor's main strategy is based on the usage of two kind of indicators: two built-in shifted RSI to measure the asset prices oscillations and a Parabolic SAR to check the prices trends. It combines these indicators signals in order to get stronger signals and ensure the EA will do good trading operations.
It protects your money because it is provided with : Trailing stop loss to protect your profit. Once your order has a positive profit, it sets SL at a certain distance in order t

The indicator shows supply and demand degenerated through tick volume.
The red line is the supply line.
The blue line is the demand line.
The green line is the total volume line.
Typical situations of indicator readings:
red is higher than blue - supply is higher than demand - the price is falling. blue is higher than red - demand is higher than supply - the price is growing. the red and blue lines tend to go down, but the blue is above the red - demand prevails, the price rises, but

The Universal Signal Dashboard (USD) is a signal dashboard or indicator matrix. It can generate a matrix of signals from values, chart and candle prices, and from the buffer output of almost any technical indicator. However, unlike most dashboards of the same category, USD is configurable based on the inputs provided by the user within the app interface. The tabs (Display, Data, and Signals tabs) starts empty and the Display tab will show more display entries as the user adds more signal entries

Introduction to Harmonic Volatility Indicator Harmonic Volatility Indicator is the first technical analysis applying the Fibonacci analysis to the financial volatility. Harmonic volatility indicator is another level of price action trading tool, which combines robust Fibonacci ratios (0.618, 0.382, etc.) with volatility. Originally, Harmonic Volatility Indicator was developed to overcome the limitation and the weakness of Gann’s Angle, also known as Gann’s Fan. We have demonstrated that Harmonic

Мультитаймфреймовый индикатор показывает спрос и предложение, вырожденный через тиковый объем. Индикатор разделен на 3 зоны. Зона снизу показывает спрос и предложение текущего временного периода. Выше нее располагается значения показывающий таймфрейм старшего периода. В верхней зоне располагается отображение таймфрейма на 2 больше текущего. Пример: основной временной период 1 минута - будет отображаться в нижней зоне индикатора. Выше нее расположится 5 минутный период. В 3 зоне расположится 1

Spread Costs refers to the amount of the loss caused by the spread, and Swap Benefits refers to the amount of the income gained by overnight positions. Spread Costs is an important indicator for short-term traders, especially for scalping traders, and Swap Benefits is an important indicator for long-term traders. Since the spreads and swaps on the MetaTrader 5 platform are all expressed in points, we need to convert it into the amount expressed in the account currency. This tool can display the

The Extremum catcher MT5 indicator analyzes the price action after breaking the local Highs and Lows and generates price reversal signals with the ability to plot the Price Channel. If you need the version for MetaTrader 4, see Extremum catcher . The indicator takes the High and Low of the price over the specified period - 24 bars by default (can be changed). Then, if on the previous candle, the price broke the High or Low level and the new candle opened higher than the extremums, then a signal
The " Delta Volume histogram " Expert Advisor plots histograms of "Delta volume", "Real volume", "Buy volume", "Sell volume", "Tick volume".
EA version: Has a built-in «Pending orders indicator". The indicator is designed for analysis of pending orders in the market, available in "MarketBook". Displays the Volume profile levels (VAH VAL from 60% to 85%). Built-in side histogram. This is a powerful tool for analyzing trade volumes. The chart is plotted based on tick data.
Depending on the broke
MetaTraderマーケットは、他に類のない自動売買ロボットやテクニカル指標の販売場所です。
MQL5.community ユーザーメモを読んで、取引シグナルのコピー、フリーランサーによるカスタムアプリの開発、支払いシステムを経由した自動支払い、MQL5Cloud Networkなど、当社がトレーダーに対して提供するユニークなサービスについて詳しくご覧ください。
取引の機会を逃しています。
- 無料取引アプリ
- 8千を超えるシグナルをコピー
- 金融ニュースで金融マーケットを探索
新規登録
ログイン