YouTubeにあるマーケットチュートリアルビデオをご覧ください
ロボットや指標を購入する
仮想ホスティングで
EAを実行
EAを実行
ロボットや指標を購入前にテストする
マーケットで収入を得る
販売のためにプロダクトをプレゼンテーションする方法
MetaTrader 5のためのエキスパートアドバイザーとインディケータ - 167

Einstein Pivot Point indicator shows you hourly, weekly or monthly pivot points and support and resistance levels. You can choose 3 different formula for the support and resistance levels (Classic Formula, Woodie Pivot Points and Fibonacci Pivot Points). Einstein Pivot Point will automatically calculate the p ivot point and support and resistance levels on the basis of market data.
Trading requires reference points (support and resistance), which are used to determine when to enter th

A fan of special weighted moving averages, able to predict tendency reversal and give references about price movements during consolidation and drawbacks. This special moving average is based on Phi fractals and is not available on others indicators. Reproduce this method with another kind of average will not have the same results. The fan has the following averages: 17: Purple 34: Blue 72: Orange 144: Green Blue 305: Dark Blue 610: Grey How to use the fan to analyze price behaviour: If the pric

魔動MT5はプロの指標のMetaTrader5端子です。
移動平均とは異なり、Magic Movingはより良い信号を提供し、長期的な傾向を特定することができます。
インジケータでは、アラート(アラート、メール、プッシュ)を設定することができますので、単一の取引信号を見逃すことはありません。
インジケータの利点 スキャルピングに最適です。 最小の偽信号を生成します。 初心者や経験豊富なトレーダーに適しています。 すべての時間枠で動作します。 外国為替、CFD、バイナリオプション:任意の金融商品に取り組んでいます。 インジケータは再描画されません。 電子メールやモバイルデバイスへの信号の送信。
推奨シンボル EUR/USD、GBP/USD、AUD/USD、USD/CAD、ゴールド。
使用に関する推奨事項 開買い注文が価格を横切る指標線は上向きになるようにします。 価格が下向きのインジケータラインを横切るときにオープン売り注文。
パラメータ Period -値を増やすとインジケータが遅くなり、信号の品質が向上し、その数が減少します。 減
半自動取引のためのユーティリティ。ストップオーダー、ストップロス、テイクプロフィット、トレーリングストップをブローカーに見えないように設定するための動的レベルを適用します。 FIFO要件のある米国のブローカーを含むあらゆるブローカーとの連携に適しています。
アドバイザリンクのMT4バージョン
取引はボタンまたは線を使用して開くことができます。アドバイザが線に沿ってポジションを開くには、チャートに線を引き、名前を変更します。価格がそれを超えると、EAは対応するコマンドを実行します。
OPEN_SELL-売り注文を開きます CLOSE_SELL-すべての売り注文を閉じます OPEN_BUY-オープンバイオーダー CLOSE_BUY-すべての購入注文を閉じる コマンドが実行された後、コメント「OK」が書き込まれ、行はコマンドを1回だけ実行します。
チャートには、受け取った利益、現在のオープンポジション(注文数、ロット数、利益)、オープニング注文のボタン、実行速度、スリッページに関する情報が表示されます。
オプション: MAGIC_NUMBER-マジックナンバ
ユニバーサルアドバイザー。スカルパーおよび動的注文グリッドとして機能します。ブローカーには見えないストップオーダー、ストップロス、テイクプロフィット、トレーリングストップを設定するためのレベルを適用します。レベル値は、ピップ単位または平均価格ボラティリティ(ATR)のパーセンテージとして設定できます。それは指定された時間に働くことができ、滑りと広がりの広がりに対する保護を持っています。チャートには、注文実行の品質、受け取った利益、現在のオープンポジション(注文数、ロット数、利益)に関する情報が表示されます。 FIFO要件のある米国のブローカーを含むあらゆるブローカーとの連携に適しています。
Iron TraderEAのMT4バージョン
資金管理: FIX_START_LOT-残高のN個ごとの開始ロットを修正しました(FROM_BALANCE); FROM_BALANCE-開始ロットを計算するためのN残高(FIX_START_LOT); 開始ロットは、次の式を使用して計算されます。残高/ FROM_BALANCE * FIX_START_LOT
例1:
バランス

The strategy: EA strategy is inspired from a profitable strategy of Mr Rob Hoffman (One of the best traders in the world with multiple prizes on manual trading) . 1.Entry: The EA search for IRB bars (Inventory retracement bar), and place sell pending order or buy pending order according to the trend confirmed by the calculation of a 20 EMA slope degree. We believe that most of IRB Bar are caused by huge institutions (Hedge funds …), so the idea is to take benefits from their very profitable robo

Have you ever take a long time to watch a Symbol when the network link is not good ? Have you ever wait for a long time when you switch chart between different Symbols or different TimeFrames ? If you do long-term backtesting , Have you ever to be downloaded datas for a long time ? Yes, If there is no data in the system, those will happen. 1. What is this: Download all the Symbol data in Market Watch to the system. PS: This is not outputting data to Files. This Link go to Demo version:
https:

NEW PROMO: Only a few copies copies available at 349$ Next price: 449$ Make sure to check out our " Ultimate EA combo package " in our promo blog ! Grid King is a revolution in grid trading. The main focus when developing the EA was safety, by eliminating the margin-call risk which is usually associated with most grid systems on the market. It also strives to achieve much higher returns than the average grid system, by spreading risk amongst multiple pairs and strategies which all have a li

Teclado trader, é uma BIBLIOTECA que você pode chamar no OnChartEvent para abrir posição de compra/venda/zerar, os botões padrões são: V = venda C = compra Z = zerar posições a mercado S = zerar posições opostas e depois a mercado X = zerar posições opostas
Além da função de teclado, é possível mostrar os estados do ExpertAdvisor usando o MagicId, com informação de:
lucro mensal, semanal, diario, e posição aberta, para isto use o OnTick, ou qualquer outro evento (OnTimer / OnTrade / OnBookEv

The indicator displays the delta and the cumulative delta based on the "Time & Sales" deals list data. In addition to the standard timeframes, the indicator displays data regarding the seconds timeframes (S5, S10, S15, S20, S30) to choose from. Using the rectangle, user can select an arbitrary area in the indicator subwindow to view the ratio of the volumes of deals of buyers and sellers within this area.
Indicator features:
The indicator works correctly only on those trading symbols for whi

Moriarty is fully automatic advisor based on Scalping, but also uses Martingale strategy. This advisor does not depend on timeframes and uses heuristic algorithms for opening/closing orders. It can work on several currency pairs simultaneously. The best results were achieved on the Hedged accounts.
Usage Run the advisor on a chart.
Parameters Moriarty Take profit in pips: minimal number of pips that is required to close order with profit Lots: size of lot Step: martingale step Martingale: m
A new and exclusive panel, Strategy Maker, for creating custom strategies. You can use your own parameter for entry (manual) or address the magic number of another expert advisor in the same Symbol for the entry. Put de gain, the space between the grid, stop in money or in points and create a dynamic strategy! Characteristics: Works in any type of account and broker. Easy to use. Simple interface and intuitive. Extremely customizable trading strategies. Quickly response for any command. Can work

Minions Labs' Candlestick Pattern Teller It shows on your chart the names of the famous Candlesticks Patterns formations as soon as they are created and confirmed. No repainting.
That way beginners and also professional traders who have difficulties in visually identifying candlestick patterns will have their analysis in a much easier format. Did you know that in general there are 3 types of individuals: Visual, Auditory, and Kinesthetic? Don't be ashamed if you cannot easily recognize Candlest

See AutoTrade deals ONLY on select charts If you attach this indicator to the chart, all the Autotrade deals will be removed from chart display. This solves the problem that deals on chart is turned on Universally. Now turn on the Universal show deal on charts. Attach this indicator to the charts that you do not want to see the deals.
E.g. if you are trading m1 chart, it may clutter your h1 chart bar.

The advisor NewsCatcher Visual automatically downloads actual data from the mql5.com calendar. The advisor can work in the "autoclick" mode, that is it can open trades automatically by comparing actual and forecast values. It also allows to manually open both instant and pending orders with a set volume.
Recommendations
By default the advisor NewsCatcher Visual applies the "autoclick" strategy to all events of high volatility. This allows the advisor to work in the fully automatic mode. Howev

NewsCatcher Pro opens both pending and market orders based on data from the mql5.com calendar. In live mode, NewsCatcher Pro automatically downloads the calendar, opens orders, trails and closes orders. NewsCatcher Pro can trade any event from the calendar with any symbol available in MetaTrader, including Gold, Oil and cross-rates. To change the default symbol, go to the event view you want to change it for. NewsCatcher Pro uses two strategies: Strategy 1 (pending orders): the advisor opens two

MA Crossover Master The strategy is based on price crossover with Moving Average indicator, confirmed by Fractal Adaptive Moving average and RSI indicator. The default settings are just place holders and not necessarily the best. Use the settings that best suites you or your strategy. OpenBUY - Set to true to allow buy trades. This setting is true by default. OpenSELL - Set to true to allow sell trades. This setting is true by default. StartTakeProfit - take profit value for open orders (d
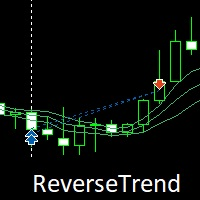
ReverseTrend MT5
ReverseTrend - fully automatic trading advisor that does not use martingale. The Strategy is night scalping. The Bollinger Bands indicator is used for inputs, only BUY positions are opening. Advisor uses a series of orders, lot calculation is carried out according to Fibonacci. Hedging account type is required. All my products can be found here: https://www.mql5.com/ru/users/zhigal/seller
Recommendations The minimum required deposit is $500, please use ECN accounts with
トレーディングキングMT5エキスパートアドバイザーの高度なバージョン。使用される指標:ATR、RSI、ストキャスティクス、CCI、WPR、DeMarker、RVI。各インジケータは、オプションでオン/オフで使用できます。
エキスパートアドバイザートレーディングキング拡張のMT4バージョン
セットファイルと最適化の結果は、アドバイザーのディスカッションに掲載されます。
エキスパートアドバイザーの戦略は、トレンドの強さを評価し、修正/逆転ポイントを見つけることに基づいており、特定の期間における市場の上昇と下降の絶対値を比較します。フィルタは、ニュース、時間、スプレッドの拡大、ボラティリティの増加、スリッページ、曜日に使用されます。戦略は短期取引を使用します-マーチンゲールを使用しない夜のスキャルピング
FIFO要件のある米国のブローカーを含むあらゆるブローカーとの連携に適しています。すべての注文には仮想ストップロスが伴い、ピップで利益を上げます。チャートには、さまざまな情報とインジケーターのインジケーターが表示されます。推奨される最低保証金は、0.01ロットで20

Intersection EA is a fully automated software (trading robot), executing trading orders on the currency market in accordance with the algorithm and unique trading settings for each currency pair. Intersection EA is perfectly suitable for beginner traders as well as for professionals who got solid experience in trading on financial markets. Traders and programmers of Kalinka Capital OU company, worked hard developing the Intersection EA forex robot, starting from the year 2011. Initially, this s

Take Your Profit X3 MT5 Take your Profit is a fully automatic multi-currency expert Advisor that trades on the Forex market using a trend strategy based on a breakout or rebound from moving Average or Double Exponential Moving Average with the possibility of placing up to three take profits in one trade. The EA can be run on any instruments with any TF, but the best results are obtained on TF: M30, H1, H4. The deal is opened by fully fixing the price above or below the moving average. Entry int

Updated latest version DD is below 30%
**Back Test in IC Markets, EURUSD, USDJPY, AUDUSD Time Frame M30** *USDCAD 1H * *AUDUSD H2*
**BE SAFE EA includes 9 Powerful Trend Indicators**
**99% Accuracy Super Strong BUY and SELL Signal entry**
**EA takes Super Strong BUY or SELL order, after 9 indicator confirmation in one bar**
Super Strong BUY and SELL entry EA takes super STRONG BUY and SELL entry, after 9 indicator confirmation in single bar. When you receive the super st
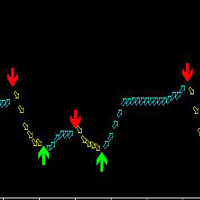
この指標はMT 5のすべての品種に適合して、いかなる周期にも適していますが、最も適した周期は30分と4時間で、使用は簡単で、矢印の出現は絶対に変わりません。
この指標の原理は、ATRとカスタマイズMAによって、混合計算を加えて開発された、正確な率が高い。
買います:緑の上の矢印を見ます。
売る:赤い下の矢印を見ます。
矢印が表示されます。
2つの周期で一緒に見ることを提案して、もっと正確になることができることを提案して、つまりまず大きい周期の趨勢を参考にして(大周期の中の大きい矢印が通った後に)、更に小さい周期の矢印を見ます!
以下はより良い使用方法です。 智幣A使います!2つの周期と一緒に見るのはもっと正確で、たとえば、あなたは5分の矢印を見て、まず15分の上で同じ傾向(つまり同じ矢印の中)を見てみて、もし同じように単にするならば、大きい周期の上ではしないでください!: 15分前に矢印になると、5分周期が上の矢印になります。 15分の現在は下矢印の場合、5分周期で下の矢印が表示されます。 1分で注文すると、5分周期を見てみます。15分だけを見ると、1時間周期を
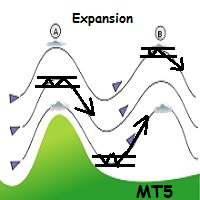
WindExpansion is a fully automated solution to get a smart edge type from the market: it will enter when the “smart money” is starting to heavy push the market (after accumulation/distribution phases that form tiny ranges) and volume is expanding due big interest to sustain the price caused by psychological buying/selling pressure; when this situation happens many traders will try to fade the move but “big dogs” will be stronger and collect profits by the crowd; when the opposite situation happe
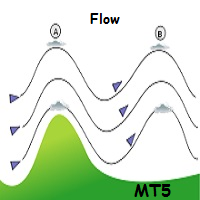
WindFlow is a powerful solution for manual traders that will drive your trading decisions in no time. I designed this indicator taking into account three main concepts: momentum, break of recent trend and volatility. Just like the wind's flow any trend can have small correction or major change in its direction based on the main trend's strength, so at glance you can have a very good idea on the next "wind's direction" when you look at your charts.
How to properly use WindFlow? WindFlow is the

KT Ichimoku Trader is a fully automated expert advisor that offers five popular trading strategies based on the Ichimoku indicator. Each strategy has it's own entry and exit method without any interference to other strategies. The Ichimoku system can be applied to all major currency pairs and metals. However, we found that it performs reasonably well mainly on two pairs. MT4 Version is available here https://www.mql5.com/en/market/product/35041
Features
Trade up to 5 famous trading strate

ini adalah indikator khusus digunakan untuk trading di binary.com dengan pair volatility 75. indikator ini sangat simpel dan mudah digunakan baik untuk yang sudah profesional atau pun yang baru dalam dunia trading terutama yang baru di market volatility 75.indikator ini lebih bertujuan untuk scalping trader dan menggunakan timeframe M1 sebagai acuan untuk entry. adapun jika ingin mempelajari lebih lanjut bisa menghubungi di telegram https://t.me/shadowbreakerfx . untuk SOP lengkap silahkan klik

F ully automated Expert Advisor using the advanced grid algorithm and constrained Martingale (MT4 version: GS grid ). Set up to work on EURUSD timeframe M15. Test 2021 shows a high percentage of winning orders: more than 98%. Works on HEDGING accounts with a leverage of 1:500 and a Deposit from 1000USD. Can use the news feed from Forex Factory to prevent trading during news release (Filter News Forex Factory=true;). To access the options terminal menu on the Expert Advisors tab, you must enable
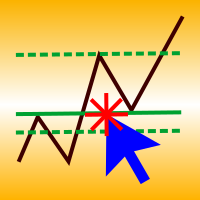
A simple panel to help you to place orders on the chart using the mouse. Hold Left Shift or Left Ctrl and the panel will show the lines where it will place the order already with stop loss and take profit. Use Shift to place buy orders and Ctrl to place sell orders, the panel will switch between stop or limit orders depending if the mouse is above or below the price. Please be aware that Ctrl key is used by Metatrader to copy an object, try to avoid using this panel with charts where you copy ob
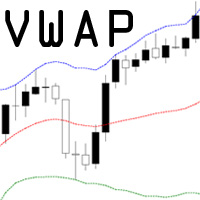
VWAP = Volume Weighted Average Price The concept of VWAP is not equal to a normal Moving Average. The VWAP starts always with zero at the beginning of a new day and successively forms an average to the traded volume relative to price. Professional trading firms and institutions use VWAP for a measure of the real weighted trend of an underlying. With the addition of the standard deviation you can spot support and resist at the outer boundaries.

Hamster Pro Hamster Pro
(Very Fast, Easy Setup, More Power!) The Hamster Pro is a Trading Robot with no use of Classic martingale. Schedule scalping Options. it uses some Indicators as a filter to maximize Correct entries.
Recommendations : Lot = 0.01. Balance = 100 USD. Pair = EURUSD. TimeFrame = 5Min. Broker = Trusted Brokers
Inputs descriptions : Initial Lot - Initial lot size. Virtual Take Profit - virtual take profit. Virtual Stop Loss - virtual stop loss. Max Orders - t

HelloTrader is a completely new product view for the MetaTrader platform. Immediately after launching, the utility displays randomly one of the lines of the phrase, quotes of famous people or an aphorism in the upper left corner of the terminal. Every 5 minutes the recording changes. The Demo version includes 32 phrases, quotes or aphorisms in English only.
The utility starts working immediately after launch and no longer has any settings or functions. The only task is to randomly display qu
FREE

Gap Trader Expert Advisor exploits one of the most common phenomena of the Forex market namely the weekend gap, a price difference between the last Friday’s closing price and the coming Monday’s opening one. This price jump is due to the fact that the interbank currency market continues to react on fundamental news during the weekend, opening on Monday at the most liquid level. Weekend Gaps are consistently been filled by the market and therefore fanatically traded by Forex expert traders. Gap

Fx Karakurt Работа робота, это увеличение лота и их усреднение, основное отличие, это пропорциональная торговля. Благодаря этому параметры советника не будут переоптимизированны. Советник торгует одновременно в обе стороны, без индикатора. Самая важная информация о работе выводится на график. Главное правило- это правильно оптимизировать советник. Покупки и продажи оптимизируются отдельно, для этого следует выключить LONG TRADES OPEN или SHORT TRADES OPEN. Начинать оптимизировать советник
インディケータはfxstreet.comからの通貨商品の履歴と将来の経済ニュースを表示し、ニュースがリリースされる前にニュースで取引したり、ポジションをクローズまたはヘッジしたりすることができます。
デモのテスト方法については、以下のビデオをご覧ください。 経済カレンダーデータをロードするには、経済ニュースカレンダーローダースクリプトを使用します。 https://www.mql5.com/ja/market/product/34738
主な機能: ウェブサイトからの2001年以来の経済ニュースの歴史 ターミナルでの通知、ニュースのリリース前に設定可能な時間電話または電子メールにプッシュ EA(アドバイザー)との互換性:インジケーターは、ニュースのリリース前の構成可能な時間のシグナルを提供し、構成可能な時間の後にオフになります ストラテジーテスターと互換性があります(実際のニュースを使用) 必要な機能が見つかりませんでしたか?私に書いてください、私はすぐに追加します。 利用可能な42カ国からのニュース: 国のコード 国 AR Argentina AU Australia AT
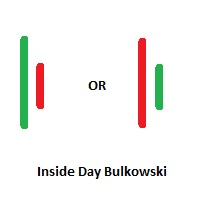
Inside Days Candlestick Bulkowski The Inside days candlestick is a well-known candle pattern composed of two candles. This indicator for showing outside days candlestick that describe by Thomas Bulkowski.
If you need for MetaTrader 4 version, please visit here: https://www.mql5.com/en/market/product/34725
Feature Highlights Show inside days candlestick. Customizable "Symbol". Customizable symbol distance from candlestick.
Input Parameters Symbol - Input symbol code from "wingdings" for ins

DYJ MacdSto EA uses MACD and Stochastic indicators to find signals.
Signals to buy are generated if the MACD line crosses over the SIGNAL line in the negative area below the MACD open level, and when Stochastic has crossed zoneBuy downwards, reached zoneBuy and then crossed back up through oversold.
Signals to sell are generated if the MACD line crosses under the SIGNAL line in the positive area above the MACD open level, and when Stochastic has crossed zoneSell upwards, reached zoneSell, and

Forex Abrams Основа работы EA, это увеличение лота и их усреднение, но основное отличие, это пропорциональная торговля. Благодаря этому параметры советника не будут переоптимизированны. Советник торгует одновременно в обе стороны, без индикатора. Самая важная информация о работе выводится на график. Самое главное, это правильно оптимизировать советник. Покупки и продажи оптимизируются отдельно, для этого следует выключить LONG TRADES OPEN или SHORT TRADES OPEN. Далее следует выключить Step Pro

Советник Forex Ilan Barbudos -это аналог советника торгующий на одном графика в разные стороны одновременно(для этого требуется соответственный счёт который это позволяет), с добавлением множества дополнительных логик и возможностей для торговли, с оставленными настройками советника . Советник торгует по системе Мартингейл с увеличением последующих лотов в серии ордеров, с целью их усреднения. Первые ордера робот выставляет по двум свечам. Так же советник имеет возможность прекращать торговлю в

The EA uses the strategy based on breakout. Breakout trading is one of the most popular and most frequently used strategies among Forex traders. This strategy has been developed a long ago and has been repeatedly tested on history data, showing superior results. The EA uses 3 types of trend breakouts, (support and resistance breakout, downtrend breakout, uptrend breakout). The EA uses a very small SL so the account is always protected from equity drawdown with a very low risk-per-trade. It uses
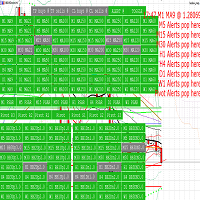
Provides automated (HFT) trading, manual trading, and alerts, with a manager panel.
Utilises bollinger bands, moving averages, Parabolic SAR, pivots and pending orders with range breakout. Allows linking takeprofit, stoploss, Sound & push-notifications, buy & sell triggers, to customizable indicators; 8 moving averages, 3 Bollinger bands, PSAR, and daily pivots.
A grasp of the configurability:
Active market hours requirement for all majors.
set timer intervals per timeframe trade tri

CyberTrend is a fully automatic Expert Advisor based on advanced algorithms for short term trend prediction. This EA uses several custom made indicators combined with candles prediction that helps to achieve a very high-rate of winning trades. This EA successfully passed long term back-test with real tick data, variable spread, real commision and swap from Metatrader 5 Strategy Tester. CyberTrend is also fully adjustable by user. Please read the blog to get more information about FAQ and setti

HelloTrader is a completely new product view for the MetaTrader platform. Immediately after launching, the utility displays randomly one of the lines of the phrase, quotes of famous people or an aphorism in the upper left corner of the terminal. Every 5 minutes the recording changes.
The structure includes more than 1000 phrases, quotes and aphorism in Russian and English.
In the input parameters, you can choose the Russian language display of records, the default is English.
The utilit

The indicator High Trend Pro monitors a big number of symbols in up to 4 timeframes simultaneously and calculates the strength of their signals. The indicator notifies you when a signal is the same in different timeframes. The indicator can do this from just one chart. Therefore, High Trend Pro is a multicurrency and multitimeframe indicator. High Trend Pro uses emproved versions of popular and highly demanded indicators for calculating its signals. High Trend Pro calculates the signal strength

KT Psar Arrows plots the arrows on chart using the standard Parabolic SAR indicator. A bullish arrow is plotted when the candle's high touch the SAR. A bearish arrow is plotted when the candle's low touch the SAR. The signals are generated in the real-time without waiting for the bar close.
Features
A beneficial tool for traders who want to experiment with the trading strategies that include the use of Parabolic Sar indicator. Can be used to find turning points in the market. Use custom PSA

The DYJBands opens and closes positions using Bollinger Bands signals: It performs trades after a price rebound from the borderlines of the indicator. It has the option to close positions by an opposite signal, by take profit and stop loss, move a trade to breakeven upon reaching the central Bollinger band or after a certain price movement. By default, the EA is configured for trading the GBPUSD currency pair on the H1 timeframe. Also, settings for the EURUSD, USDJPY, USDCAD and XAUUSD currency

If you want to share your trading signal, but you do not want to distribute your investor password, this product is fit with you. "Just copier Pro" is designed to copy trading without any complicated settings. The copy can be done in one PC or over the internet. One EA can be set as master (provider) or slave (receiver). The receiver lot can be set to multiple providers lots. In "Globe" mode, the signal provider (master) have to give the password to signal receiver, (the password that is set in
The utility TradeKeeper Pro allows you to open a trade manually with a magic and a volume of your choice. It does not open its own trades, it can only open a trade by your command.
TradeKeeper Pro can trail any open trades by the iSAR (parabolic) indicator, and a simple trail. It can set the stoploss level at the open price as soon as possible. To trail any open trades for any instruments, it suffices to launch the utility in one chart. TradeKeeper Pro can close any trades or pending orders of

KT Pin Bar identifies the pin bar formation which is a type of price action pattern which depicts a sign of reversal or rejection of the trend. When combined with support and resistance, BRN and other significant levels, Pin Bar pattern proved to be a very strong sign of reversal.
Basically, a pin bar is characterized by a small body relative to the bar length which is closed either in upper or lower 50% part of its length. They have very large wicks and small candle body.
A pin bar candlest
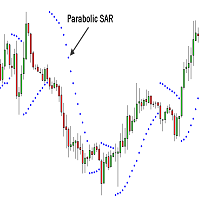
Professional Constrictors Expert Advisor follows the market using the Parabolic Stop and Reverse system indicator. At each Parabolic SAR indicator signal, a position is opened in the direction approaching the indicator. In case of an opposite signal, a new position closing the previous one is opened (in other words, positions are opened and closed partially). Thus, the EA constantly follows the price. The EA has been designed for working in the flat market. It features a critical drawdown,

RoboSar is a professional robot based on the Parabolic SAR indicator. The Expert Advisor is designed for the analysis of trending markets. On the "bull market" the indicator is below the prices, on the "bearish market" it is above the price. If the price crosses the Parabolic SAR lines, the indicator reverses, and its further values are located on the other side of the price. In case of such an indicator reversal, the reference point is the previous period's high or low. The reversal of the in

Outside Days Candlestick Bulkowski The Outside days candlestick is a well-known candle pattern composed of two candles. This indicator for showing outside days candlestick that describe by Thomas Bulkowski.
If you need for MetaTrader 4 version, please visit here: https://www.mql5.com/en/market/product/34411
Feature Highlights Show outside days candlestick. Customizable "Symbol". Customizable symbol distance from candlestick.
Input Parameters Symbol - Input symbol code from "wingdings" for

"Quick Copier" is designed to copy trading without any complicated settings. It copies master orders faster than "Just Copier" (https://www.mql5.com/en/market/product/20920). Please also check this product at fxina.hostingerapp.com. The copy can be done in one PC. One EA can be set as master (provider) or slave (receiver). The receiver lot can be set to multiple providers lots. Any type of copy is available. MT4 -> MT5 MT4 -> MT4 MT5 -> MT5 MT5 -> MT4 If you want to copy MT4 -> MT5 or MT5 -> MT
The Expert Advisor builds a grid of orders at prices near support or resistance levels. Entry points are calculated by the EA using the author's algorithm and based on a variety of factors. The EA uses several time ranges for analysis. The built-in trend filter allows to make more accurate entries with a greater likelihood of closing them with profit and thus reducing the number of simultaneously open orders. All orders are closed upon reaching the expected profit. Through the use of TakeProfit

"ONE SHOT, ONE KILL" - Trade like a Pro SNIPER . The best EA for anyone who loves the ACCURACY, PATIENCE, PERFECTION. The EA works like a sniper who hidden and waits until the best chance coming. So that, it only places about one order per month on average. While waiting, it takes time to analyze the market to find a unique pattern with the highest win rate (you can see it takes time in the backtesting). - This EA isn't suited for people who want to trade a lot of orders per day, trade every day

EA de Long & Short para B3 BOVESPA BMF IBOV Link para entender como funciona a parametrização e o painel de controle mql5.com/pt/blogs/post/757181
Esse Expert Advisor (EA) foi desenvolvido para realizar operações de Long & Short na Bolsa de Valores de São Paulo (B3 BOVESPA), podendo funcionar tanto em formato de Day Trade quanto de Swing Trade. Ele automatiza o processo de identificação de oportunidades de negociação entre dois ativos (Símbolo 1 e Símbolo 2), aproveitando as discrepâncias de p

This tool is used to generate a K - line reflection chart of a currency pair for foreign exchange transactions.
For example, if the currency pair is EURUSD, a custom currency pair named EURUSD_ref is generated and a chart for that currency pair is opened. The price of a custom pair of currency is the inverse of the price of the original pair, which is the equivalent of a new pair of currency, the USDEUR.
The usage is simple, put it on any chart, the new chart will open, and then draw the co
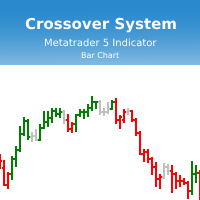
Индикатор Crossover System основан на трех скользящих средних, который изменяет цвет баров в зависимости от определенных условий скользящих средних. Этот индикатор позволит реализовывать системы из одной скользящей средней, из двух скользящих средних и из трех скользящих средних. Параметры индикатора: fastperiod - период быстрой скользящей средней fastMethod - метод построения быстрой скользящей средней fastPrice - метод вычисления быстрой скользящей средней fastshift - сдвиг быстрой скользя

Engulfing Candlestick Bulkowski The engulfing candlestick is a well-known candle pattern composed of two candles. This indicator for showing engulfing candlestick that describe by Thomas Bulkowski.
If you need for MetaTrader 4 version, please visit here: https://www.mql5.com/en/market/product/34193
Feature Highlights Show bullish engulfing and bearish engulfing. Customizable "Up Symbol". Customizable "Down Symbol". Customizable symbol distance from candlestick. Customizable "Down Color". Cus

KT COG is an advanced implementation of the center of gravity indicator presented by John F. Ehlers in the May 2002 edition of Technical Analysis of Stocks & Commodities magazine. It's a leading indicator which can be used to identify the potential reversal points with the minimum lag. The COG oscillator catches the price swings quite effectively.
MT4 version of the same indicator is available here KT COG Advanced MT4
Calculation of COG The COG indicator is consist of the two lines. The mai
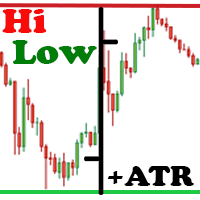
The Hi Low Last Day ( Hi Lo Last Day ) indicator shows the high and low of the last trading day and the second trading day. There are many trading strategies on the daily levels. This indicator is indispensable when using such trading strategies. In fact, everything is simple in trading, you just need to understand and accept it for yourself. There is only price!!! What is price? This is the level on the chart. The level is the price that the buyer and the seller are holding back. What price is

The purpose of this utility is to manage one or more subwindow in the same chart by opening and closing them through a button or the keyboard keys
How it works: If you want to handle more than one subwindow you need to reinstall the indicator . In this case some setups has to be customized onlu in the last subwindow installed and others setups in the installed subwindow during the first time installation. They are denoted in the input rispectively as ' LW ' and ' IW '.
First of all insta
This indicator helps you control several pairs in a small workspace, therefore, it is not necessary to open several charts on the platform to do so. The indicator shows sequentially up to 6 different pairs, besides that each of these pairs has a button with which you can stop the indicator to observe the selected pair. Place the indicator on a chart to monitor several pairs and the rest of your space use it on the chart of the pair you wish to observe in detail. MT4 version Parameters Ob

TeaCii Auto Fibonacci MTF is an implementation of Fibonacci Levels The indicator is simple and yet more powerful than those in the market
IMPORTANT: UNIQUE SELLING POINTS - The Levels are set automatically - You can see ANY TIMEFRAME Levels in ANY Chart. E.g. Watch H1 on M1. Watch M1 on H1 - The Levels are available in Buffers for EA Use - Helps you to get an edge early in by using multi timeframe
Parameters TimeFrame : The timeframe of the indicator. It can be same, higher or lower than t

Market Sentiment is an indicator for MT5. Market sentiment is the feeling or tone of a market . Also called investor sentiment, it is generally described as being bullish or bearish : When bulls are in control, prices are going up . When bears are in control, prices are going down . Markets being driven by emotions, the market sentiment is about feelings whereas fundamental value is about business performance .
Settings : Range in bars : numbers of bars used for the calculation, at your own

HV Models is an Indicator that containes 4 methods for calculating historical volatility of the selected asset. Volatility is one of the fundamental values describing changes in the underlying asset. In statistics, it usualy describes as a standard deviation. The price chart has 4 values (Open High Low Close) when we calculate volatility using a standard indicator, only one of these values is used as a result we get one-sided volatility picture. The presented indicator uses 4 volatility ca

This positions risk visualization indicators, indicators allow you to clearly know price go back will be generated how much account Loss Percent. This is very useful indicator for Controlling Risk when account is open positions, attach this indicator to the chart of the open positions, this indicator will draw three Lines, the three Line of Loss Percent default value is 10% 30% 50% user can define their own Loss Percent value. Loss Percent corresponding Back Point will show in the upper
Description: - Chart Time + Indicator is very simple and easy, but it can be very important to control the time before opening any manual trade. This indicator shows the time in a panel between 3 different options. Can be possible to move the panel with mouse or with fixed coordinates on the chart. Input Parameters: - Local Time : Enable Local Time if you want to show it (Personal Computer Time). - Server Time : Enable Server Time if you want to show it (Broker Time). - GMT Time

Description: - We all want to have the lowest spread and never high, with this utility we can have more information and a clearer idea of when the spread is acceptable or not. The Panel InfoSpread is a utility expert advisor and shows information on different spread options in one or more symbols, can be actual spread, average, minimum, maximum and tick counter. Read and show the symbols that are in the Market Watch window. Also you can put a maximum limit of average spread in every symbol f

Matreshka self-testing and self-optimizing indicator: 1. Is an interpretation of the Elliott Wave Analysis Theory. 2. Based on the principle of the indicator type ZigZag, and the waves are based on the principle of interpretation of the theory of DeMark. 3. Filters waves in length and height. 4. Draws up to six levels of ZigZag at the same time, tracking waves of different orders. 5. Marks Pulsed and Recoil Waves. 6. Draws arrows to open positions 7. Draws three channels. 8. Notes support and re
MetaTraderマーケットは、開発者がトレーディングアプリを販売するシンプルで便利なサイトです。
プロダクトを投稿するのをお手伝いし、マーケットのためにプロダクト記載を準備する方法を説明します。マーケットのすべてのアプリは暗号化によって守られ、購入者のコンピュータでしか動作しません。違法なコピーは不可能です。
取引の機会を逃しています。
- 無料取引アプリ
- 8千を超えるシグナルをコピー
- 金融ニュースで金融マーケットを探索
新規登録
ログイン