YouTubeにあるマーケットチュートリアルビデオをご覧ください
ロボットや指標を購入する
仮想ホスティングで
EAを実行
EAを実行
ロボットや指標を購入前にテストする
マーケットで収入を得る
販売のためにプロダクトをプレゼンテーションする方法
MetaTrader 5のための新しいエキスパートアドバイザーとインディケータ - 34

The TradeQL Indicator is a customizable tool that highlights specific trading patterns on candlestick charts. Users can define patterns through TradeQL queries, which the indicator then applies to the chart, visually representing matches and captured groups. Ideal for identifying complex trade setups in real-time.
TradeQL queries are specified using the TradeQL Language. See https://github.com/abdielou/tradeql for more details. This language is expressed as a regular expression. The language a
FREE

Data Extractor (DE) is designed to extract symbol price movement data and save it to file. It's a simple tool, designed to be used in combination with other software.
SETTINGS (INPUTS) Period_in_days - How many days of data for Data Extractor to process (including non-work days). File extension - Defines the type of file in which data will be saved. CSV is readable for a human, HST and BIN are binary data intended for machine reading. File name (without extension) - User defined part of file
FREE

Delving deep into the sphere of finance and trading strategies, I decided to conduct a series of experiments, exploring approaches based on reinforcement learning as well as those operating without it. Applying these methods, I managed to formulate a nuanced conclusion, pivotal for understanding the significance of unique strategies in contemporary trading.
FREE

Uncover high-probability opportunities in trending markets with the Brilliant Entries Indicator. Its clear visual signals can be followed and incorporated with market structure to provide you with accurate entries. Give it a try and gain an edge in your trading strategy.
It can be used on it's own but i highly recommend to used it as part of a wider strategy to provide you with confluence.
It works on all timeframes but will work very good doing market structure 2 x timeframes higher and t
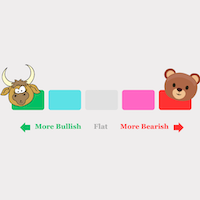
By using (MOMENTUM and VELOCITY and ACCELLERATION) and the power of machine learning we can accurately calculate the current strength of the currencies of each time frame. - It's really easy to use: Choosing to trade between currency pairs that have clear and dominant trends will give you a great advantage. -The currency pair strength meter is rated from -100 to + 100
Prop Drawdown Manager is a sophisticated utility tool designed to assist traders in effectively managing and minimizing the impact of drawdowns within their forex trading accounts. Drawdowns, which represent the reduction in capital from peak to trough, are an inevitable aspect of trading, but they can be detrimental if not managed properly. This utility provides traders with a suite of features aimed at controlling drawdowns and preserving trading capital: 1. Drawdown Thresholds : Traders can

The "Takeandstop" script is a powerful tool designed to streamline your trading workflow by automatically setting Take Profit (TP) and Stop Loss (SL) levels on your MetaTrader 5 chart. This script is particularly useful for traders who want to efficiently manage their risk and reward without the hassle of manually calculating and entering these levels. Key Features: Effortless TP and SL Placement: With a few clicks, the script allows you to set predefined Take Profit and Stop Loss levels for you
FREE

Master Nasdaq FTMO MT5 is a very accurate expert advisor for Nasdaq/ US100/ USTEC/ NAS100/ NDX/ NQ index. This EA is designed with MACD divergence, RSI divergence, RSI, Moving Average, and other secret indicator/ method for entry position. This EA is a single entry method use stop loss and take profit with ATR.
Propfirm & FTMO no longer supported, I am sorry about that.
This EA has been rigorously tested at several backtest levels, but past results do not guarantee future results. Please

EA の暗号通貨ライブティックデータの買値と売値および予約の深さ
利用可能な交換所:
1. Binance Spot (アクティブなチャートウィンドウで注文帳深度をサポート) および先物 (複数の注文帳深度をサポート)
2. Kucoin スポットと先物、アクティブなチャート ウィンドウでオーダーブックの深さをサポート
3. Bybit 先物およびインバース先物ティック データ ビッド アスク 最後
今後の取引所: OKX、MEXC など。
特徴 :
1. 買い値と売り値情報を含むライブティックデータ
2. 最高入札額と注文数量、ユーザーは設定から深さを有効/無効にできます
3. 履歴のロード: 始値高値安値終値値とティック値データを更新します
4. 履歴の自動更新:MT5ターミナルを再起動すると不足しているバーを埋める
5. 暗号データのストラテジーテスターを使用して、暗号シンボルティックのエキスパートアドバイザーであらゆる戦略をバックテストできます
6. このユーティリティは外部 DLL ファイルをロードする必

「AW Turtles」インジケーター戦略に基づく自動取引システム。サポートまたはレジスタンスレベルを下回った瞬間にポジションに入るシグナル。アドバイザには、平均化機能、バスケットの最初と最後の注文をクローズする機能、自動ロット計算機能があります。いくつかのストップロス、トレーリング、テイクプロフィットのオプションを使用してポジションを決済するためのさまざまなシナリオがあります。 手順 -> こちら / MT4 バージョン -> こちら 利点:
接続可能な自動体積計算 ストップロスを扱うためのいくつかのシナリオ 平均化の有無にかかわらず作業するためのさまざまなオプション ピッチ調整可能な内蔵トレーリングシステム 先着順と後着順の制度 あらゆる種類の通知を送信する機能 アドバイザに組み込まれたインジケーターシグナルのセットアップ アドバイザーの仕事の本質:
AW Turtles EA は、無料の AW Turtles インジケーターからのシグナルに基づいて機能します。さらに、トレーダーの個々のニーズに合わせて取引戦略をより柔軟にカスタマイズできる追加機能が組み込まれています。 注

This indicator finds Double Top and Double bottom Example : What is Double Top When price establishes a new high and then falls, then reverse to the same candle area of High then its considered a valid double top and vice versa for double bottom. 1. It plots and high and low on visible chart if ChartChange is set to true else it searches on new bar opening
2. If there is double top and double bottom found in visible chart window then it plots a line 3. It has options to customize text color, te
FREE
「IBG CANDLE SNIPER HTF」をご紹介します - 精度、使いやすさ、そして取引戦略の一貫性を求めるトレーダー向けに設計されたシンプルで革新的なエキスパートアドバイザー(EA)。このEAは、bogdanilieによって2023年に作成され、2024年1月のリリース前に1年間ライブアカウントでテストされました。 正確で多機能 : IBG CANDLE SNIPER HTFの目立つ特徴の一つは、その驚異的な精度です。それは、高いタイムフレームで非常によく機能するように設計されており、信頼できる取引シグナルとエントリーを提供します。さらに、ピップサイズが正しく設定されている限り、さまざまな取引ペアに適応し、取引ポートフォリオの多様性を保証します。 FOMO解消 :もうFOMO(取り残される恐怖)にさよならしましょう。このEAは特定のキャンドルタイムに基づいた正確なエントリーと出口のシグナルを提供し、システマティックな分析に基づいて決定を下しているという自信を持って取引することができます。 ストレスフリーな取引 :取引は圧倒されることがありますが、このEAはプロセスを簡素化します

ハンマー ローソク足パターンは 1 本のローソク足によって形成されます。 ハンマーローソク足パターンを識別する方法は次のとおりです。 キャンドルは小さいボディです 下部の芯は本体に比べて大きくなければなりません 上部には芯がないか、非常に小さい 体の色は関係ない この 1 本のローソク足の強気パターンは反転パターンであり、底値を見つけるために使用されます。 このため、私たちは下落後にこのパターンを確認し、強気派が主導権を握り始めていることを確認したいのです。 ハンマー ローソク足パターンが適切な位置に表示されると、次のような表示がされることがあります。 下降トレンドの終わりと上昇トレンドの始まり 引き戻しの終わり、上昇トレンドの再開 38ドル (残り1部)次回価格138ドル
EA Hammer GA は、通貨ペア、指数、金属、商品、暗号通貨など、あらゆる種類のシンボルで動作します。 Guardian Angel EAのチャンネル: ここをクリック GA EA を購入すると、ボーナスとして、選択した他の GA エキスパートを入手できます。 *(MQL経由ではなく、取引端末からの

の 強気エングルフィングローソク足パターン 2 本のキャンドルによって形成されます。 強気エングルフィングローソク足パターンを識別する方法は次のとおりです。 最初のろうそくは弱気でなければならない 2番目のろうそくは強気でなければならない 2番目のキャンドルの本体は1番目のキャンドルの本体を覆う必要があります この 2 本のローソク足の強気パターンは反転パターンであり、底値を見つけるために使用されます。 このため、私たちは下落後にこのパターンを確認し、強気派が主導権を握り始めていることを確認したいのです。 強気エングルフィング ローソク足パターンが適切な位置に表示されると、次のような表示がされることがあります。 下降トレンドの終わりと上昇トレンドの始まり 引き戻しの終わり、上昇トレンドの再開 38ドル (残り1部)次回価格138ドル
EA Hammer GA は、通貨ペア、指数、金属、商品、暗号通貨など、あらゆる種類のシンボルで動作します。 Guardian Angel EAのチャンネル: ここをクリック GA EA を購入すると、ボーナスとして、選択した他の GA

の 貫通ローソク足パターン 2 本のキャンドルによって形成されます。 ピアシングローソク足パターンを識別する方法は次のとおりです。 最初のろうそくは弱気でなければならない 2番目のろうそくは強気でなければならない 2 番目のローソク足の始値は 1 番目のローソク足より低くなければなりません (そこにギャップがあります) 2番目のキャンドルの終値は、最初のキャンドルの実体の50%レベルを超えている必要があります。 この 2 本のローソク足の強気パターンは反転パターンであり、底値を見つけるために使用されます。 このため、私たちは下落後にこのパターンを確認し、強気派が主導権を握り始めていることを確認したいのです。 ピアシング ローソク足パターンが適切な位置に表示されると、次のような表示がされることがあります。 下降トレンドの終わりと上昇トレンドの始まり 引き戻しの終わり、上昇トレンドの再開 EA Piercing GA は、通貨ペア、指数、金属、商品、暗号通貨など、あらゆる種類のシンボルで動作します。 ***Buy Piercing GA EA and you could

黄金パターンは、フィボナッチ数列の黄金比に基づいた 3 本のローソク足の構成です。
黄金比は1.618です。 その変動には、0.618、2.618、および 3.618 が含まれます。 このインジケーターでは、2.618 で最高の結果が得られます。
ゴールデン パターンは通常のローソク足とそれに続く大きなローソク足で構成され、終値は最初のローソク足の少なくとも 2.618 倍になります。
強気のゴールデンパターンは強気のローソク足で作られているのに対し、弱気のゴールデンパターンは弱気のローソク足で作られています。
シグナルに加えて、推奨されるエントリーラインが青い線として描かれ、最後の 2 本のローソク足に広がります。
そのパラメータは次のとおりです。
フィボナッチ比率 (0.618、1.618、2.618、3.618 など) 上記のシグナルの Wingdings コード、つまり弱気シグナル (スクリーンショットの Wingdings テーブルを参照) 上の信号の色 (弱気) 以下のシグナルの Wingdings コード、つまり強気シグナ

Gold Gridscalping is designed with a Moving Average and MACD indicator for entry points.
If you have suggestions or criticism, or additional features and indicators, please submit them via comments or reviews. I will fix it in the next version.
Recommendations: Currency pair: GOLD/ XAUUSD Timeframe: M5 Minimum deposit gold/xauusd : $1000 ($2000 recommended) Account type: standart, Raw, or zero spread accounts IMPORTANT: It is very important to use LOW SPREAD accounts for best results !
FREE
Never Dies EA is a super professional EA using advanced mathematical and statistical theories. The EA analyzes multiple timeframes (Chart Timeframe and D1) to detect strongest directions and verify signals. The EA is in the category of HFT trading EAs and will not use any dangerous recovery methods such as grid, martingale, hedge, .... All trades are powered by TP/SL to control the risk of the account. Also some smart algorithms inserted inside the EA to adjust some settings based on selected sy

Crash Spike master is the future for trading Crash markets. It has been designed to run on Crash 300 , 500 and 1000 markets on the 1 minute timeframe. It has 2 different trading modes (Aggressive and Normal) Aggressive mode will plot Yellow and blue arrows. 2 different conditions to help you make the right choice. Enter first trade on yellow arrow and second trade on blue candle. SL in this mode will be 10 Candles from the blue arrow. Normal mode will only plot red arrows on the chart. This mode

Spike Hunter has been developed for Crash and boom markets.
Spike Hunter does not repaint.
Also please download SPIKE HUNTER(B)-boom and SPIKE HUNTER(B)-crash from the comments section to assist with extra confirmation Buy Signal ; Make sure that the trend for boom is Uptrend on 15 and 30min. Use the SPIKE HUNTER(B)-boom on your chart. Once the Up arrow comes on and the SPIKE HUNTER(B)-boom line color is blue then its the best time to trade. Sell Signal ; Make sure that the trend for crash

TrendOnCloseは、特定のローソク足サイクル内のトレンドとカウンター トレンドの統計分析に焦点を当てた、バイナリー市場投資家向けの高度 なインディケータです。
各サイクル は、ローソク足の終値によって定義され、次のサイクルが始まるまでの間、トレン ド方向(UP/DOWN - BULL/BEAR)を確立します。統計分析は2つの構成で行われます:
⦁ SUBSEQUENT CANDLEとしての統計目標: アルゴリズムは、サイクル内の後続のローソク足に焦点を当てます。
⦁ INTERCYCLESとしての統計ゴール: アルゴリズムは、各サイクル間のすべてのローソク足を考慮する。 選択された統計目標に基づき、各ローソク足のトレンドがCYCLEローソク足のトレンドと比較され、同一方向の場合はTREND-Percent(TD)とTrend-Occurrences(N-TD)が増加し、トレンドが乖離している場合はCOUNTER-TREND(CTとN-CT)が増加します。さらに、このインジケータは、日足、週足、月足の統計的な合計を提供し、これらの期間中、各サイクル の「トレンド」ま

ジュリック・アドバンストMA(JurMA)は、マーク・ジュリックが考案した オリジナルのJMAをベースに開発されたノンリペイントのテクニカル 指標です。
従来の移動平均線に見られるラグを減らし、平滑性を向上させ、ノイズを減らすように設計されています。JurMAは市場のボラティリティに適応し、ユーザーが感度を微調整できるため、金融市場のトレンドや反転を見極めるのに役立ちます。この適応性と効率性により、トレーダーやアナリストの間で人気があります。
他のテクニカル・インディケータの広い文脈では、「感度」とは、価格データの変 化に対してインディケータがどれだけ速く反応するかを意味します。ローソク足の本数ではなく、インジケータが一定期間の値動きをどのように解釈するか(反応性の大小)を意味します。JurMAは、このインジケータの動作、特に「移行プロセスの質」を調整するために、PHASE機能パラメータを提供しています。PHASEは線の "滑らかさ "とは関係なく、平均計算におけるJarikの公式と直接相互作用する方法であることを理解することが重要です(ノイズをフィルタリングするのに適してい

This expert is the newest expert of our team.
We want to implement the latest market strategies in it.
A long-term project of several years
If you want to be a partner in the development of this expert, you can buy it at a very low price. An expert based on mixed strategies
We will combine several strategies in this expert
Price action, patterns, waves, maybe even artificial intelligence and...
Attributes of Version 1.0: Can be used in the GBPUSD and USDCHF , AUDUSD currency pairs
Can b

NOTE : Current price only for 5 copies, next price 1500$. This bot will be sold in limited edition to prevent the accumulation of users in the same broker. Golden Shine is designed for scalping GOLD/BITCOIN by placing pending orders based on high low at certain periods by taking advantage of strong momentum. Why Golden Shine : Golden Shine is a fully automatic trade system. Does not use any risky strategies such as martingale, grid or multiple orders. Every trade is protected by stoploss

HAshi-EはHeiken-Ashiシグナルを分析する強化された方法です。
説明
HAshi-Eは、Heiken-Ashiシグナルを分析するための強化された方法です。HAshi-Eは、Heiken-Ashiシグナルを分析するための強化された方法です。HAshi-Eは、Heiken-Ashiシグナルを分析するための強化された方法です。伝統的なローソク足チャートとは異なり、ヒーケンアシのローソク足は過去のバーの平均値を使って計算されるため、よりスムーズで解釈しやすい視覚的表現が可能です。
その主な利点は、ほとんどの人が本来の読み方をしない理由でもあります。Heiken-Ashiローソク足には平均値に関する情報が含まれており、通常、資産ローソク足の前に配置されているため、色や形に惑わされ、不適切な時間帯や遅い時間帯にエントリーやエグジットを行う人をよく見かける。
HAshi-Eは、伝統的なHeiken-Ashiインジケータの改良版です! HAshi-E(チャート版)の特徴: 同じデータを異なる角度から見る HAshi-Eは、伝統的なHeiken-Ashiローソク足だけでな

オンバランス・ボリューム(OBV)は、出来高と価格を関連付け、値動きを識別するテクニカル指標です。OBVの基本的な考え方は、出来高の変化は一般に価格の変化に先行するというものである。OBVは、価格が高値で引けた期間の出来高を累積し、安値で引けた期間の 出来高を減算する。こ の 結 果 、資 産 の ト レ ン ド の 方 向 を 示 す 数 値 が 得 ら れ る 。
OBVの解釈は簡単です。OBVの上昇は、買い手が市場に参入または留まろうとしていることを示唆し、上昇トレンドのシグナルとなります。一方、OBVが低下している場合は、売り手が優勢であることを示し、下降トレンドの可能性を示唆します。
現在、シグナルに最大3つの移動平均を使用することができ、取引判断プロセスを簡素化することができます。OBVがMAラインと交差していることと、その間の距離を観察するだけです。これがOBV-MAの目的です!
OBV線がMA線と交差し、MA線とOBV線が大きく離れている場合、上昇トレンドまたは下降トレンドの強い兆候を示します。もう一つの良いトレンドシグナルは、すべての線(OBV線とMA線

Designed by Welles Wilder for daily commodity charts, the ADXW is now used in various markets by technical traders to assess the strength of a trend or even a trend for short- or long-term trades.
The ADXW uses a positive (DI+) and negative (DI-) directional indicator in addition to its trend line (ADX).
According to Wilder, a trend has strength when the ADX signal is above 25; the trend is weak (or the price has no trend) when the ADX is below 20. The absence of a trend does not mean that

Epicus Prime Overview: Epicus Prime is a top-tier, superior, outstanding, unique, and exceptional solution in the world of algorithmic trading. In the realm of forex trading, Epicus Prime is engineered to handle significant and substancial tasks, and perform exceptionally well in the trading context, excelling remarkably in performance, accuracy, and reliability, which positions it as a leading, prominent and reliable option for traders. Strategy Elaboration: Epicus Prime is a system that analy

Master Gold Demarker is a very accurate expert advisor for gold and all pair currencies. This EA is designed with a moving average indicator to see trends, demarker to see momentum, and MACD/engulfing candles for entry points.
Please send me inbox after purchase, I will give you Breakout EA for free (promote until 12.12.2024).
Recommendations:
Currency pair: XAUUSD/GOLD Timeframe: M5 Minimum deposit gold/xauusd : $1000 ($2000 recommended) Account type: Raw or zero spread accounts IMPOR

Simple Trading Panel is a manual tool for safe trading. Monitored by the mentor and indicators. This panel has many useful settings to take your trading to the next level.
Simple Trading Panel offers features:
Adjustable stop loss, take profit, volume, trailing stop with profit in percent, risk ratio, news filter and much more. Test results Simple Trading Panel does not work in the strategy tester!
Recommend Account type: Hedging, Zero, Micro, Standard, Premium or ECN Brocker with low spr
FREE
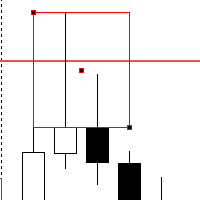
Introducing our Rejection Block Scanner – a powerful and intuitive tool designed to revolutionize your trading by effortlessly identifying key rejection zones across various timeframes. This cutting-edge scanner is crafted to cater to both beginner and experienced traders, offering unparalleled insights into potential market turning points.
**Key Features:**
1. **Multi-Timeframe Analysis:** Uncover opportunities on a grand scale! Our Rejection Block Scanner meticulously scans multiple timef
FREE

Functional in the Forex market. Functional on the B3 market - Bolsa Brasil Balcão. Motivation The Price Guide indicator is a tool that helps you insert support and resistance points at the chosen price and in the quantity you want, it depends on the agility of its configuration. This DEMO version will work on the Meta Trader 5 Demo account and Strategy Tester. Get the Full version that works with a Real account click: https://www.mql5.com/pt/market/product/111897 Operation The methodology publi
FREE

Grid Engulfing MT5 is designed with a engulfing candle for entry points.
Please give me 5 stars reviews, than I will be maintain & update this free EA for longtime or all of time. I am promise.
Recommendations: Currency pair: ALL PAIR CURRENCIES Timeframe: M5 Minimum deposit currencies : $250 ($500 recommended) Account type: Raw or zero spread accounts IMPORTANT: It is very important to use LOW SPREAD accounts for best results !
setfiles allcurrencies (best pair : EURUSD, EURGBP, EURCAD
FREE

Holeshot MT5 is a highly effective reversion trading system that leverages the power of momentum, and custom trend indicators to detect high-probability trading opportunities U-Turn areas to exploit. When demoing the system use this link below to get sample set files for your account size:
Holeshot MT5 Demo Set Files
Launch Sales The Launch Sale is $250, the first 10 believers in this product would receive this outstanding EA at our launch price. ***Buy Holeshot MT5 and you could get the P

Functional in the Forex market. Functional on the B3 market - Bolsa Brasil Balcão. Motivation The Price Guide indicator is a tool that helps you insert support and resistance points at the chosen price and in the quantity you want, it depends on the agility of its configuration. This FULL version will work in Meta Trader 5 on all accounts and Strategy Tester . To test on the DEMO account , download the free version at: https://www.mql5.com/pt/market/product/111620 Operation The method

The Adaptive Market Navigator(AMN) EA is an automated trend-based trading advisor combining the advantages of ATR, Bears Power and Moving Average indicators. The used strategy is well suited for both beginners and experienced traders.
The minimum deposit is $100 for a 1:100 leverage.
I recommend to use a 1:100 ECN account with a low spread and a fast VPS.
Optimized for EURUSD pair on 1H timeframe.
Due to the simplicity and convenience of this EA every user can give it a try and choose t

Stat Monitor is a good information indicator.
Benefits of the indicator: The indicator provides useful information - the current spread, the cost of one lot of the symbol, trading leverage and the recommended lot size for trading. You can use the indicator on the MetaTrader 5 trading platform of any broker. The indicator provides useful information.
Version of the Stat Monitor indicator for MetaTrader 4 I wish you all good luck in trading and stable profit!
FREE

O indicador é uma ferramenta desenvolvida para o MetaTrader, projetada para auxiliar na análise detalhada do comportamento do preço em relação a uma média móvel específica. Ao ser anexado ao timeframe diário, o ele realiza cálculos e monitora, em timeframes menores, quantas vezes o preço toca determinados níveis de afastamento durante o dias além de calcular a média dos toques.
MT4: https://www.mql5.com/pt/market/product/111706
FREE

What is this indicator? このインジケーターはMT5のFX検証ソフト「 Knots Compositor 」の 全てのチャートモードに対応したADX です。 どのチャートモードでも、 チャートに表示されているローソク足で計算して表示します 。
KC-Indicators - KC-MA (移動平均線) - KC-ENV (エンベロープ) - KC-BB (ボリンジャーバンド) - KC-ADX (Average Directional Movement Index) - KC-MACD (Moving Average Convergence/Divergence) - KC-RSI (Relative Strength Index) - KC-STOCH (ストキャスティクス)
FREE

What is this indicator? このインジケーターはMT5のFX検証ソフト「 Knots Compositor 」の 全てのチャートモードに対応したMACD です。 どのチャートモードでも、 チャートに表示されているローソク足で計算して表示します 。
Types of the applied price - Close - Open - High - Low - Median Price (HL/2) - Typical Price (HLC/3) - Weighted Price (HLCC/4)
KC-Indicators - KC-MA (移動平均線) - KC-ENV (エンベロープ) - KC-BB (ボリンジャーバンド) - KC-ADX (Average Directional Movement Index) - KC-MACD (Moving Average Convergence/Divergence) - KC-RSI (Relative Strength Index) - KC-S
FREE

What is this indicator? このインジケーターはMT5のFX検証ソフト「 Knots Compositor 」の 全てのチャートモードに対応したストキャスティクス です。 どのチャートモードでも、 チャートに表示されているローソク足で計算して表示します 。
KC-Indicators - KC-MA (移動平均線) - KC-ENV (エンベロープ) - KC-BB (ボリンジャーバンド) - KC-ADX (Average Directional Movement Index) - KC-MACD (Moving Average Convergence/Divergence) - KC-RSI (Relative Strength Index) - KC-STOCH (ストキャスティクス)
FREE

What is this indicator? このインジケーターはMT5のFX検証ソフト「 Knots Compositor 」の 全てのチャートモードに対応したRSI です。 どのチャートモードでも、 チャートに表示されているローソク足で計算して表示します 。
Types of the applied price - Close - Open - High - Low - Median Price (HL/2) - Typical Price (HLC/3) - Weighted Price (HLCC/4)
KC-Indicators - KC-MA (移動平均線) - KC-ENV (エンベロープ) - KC-BB (ボリンジャーバンド) - KC-ADX (Average Directional Movement Index) - KC-MACD (Moving Average Convergence/Divergence) - KC-RSI (Relative Strength Index) - KC-ST
FREE

What is this indicator?
このインジケーターはMT5のFX検証ソフト「 Knots Compositor 」の 全てのチャートモードに対応したエンベロープ です。 どのチャートモードでも、 チャートに表示されているローソク足で計算して表示します 。
Types of the moving average - Simple (SMA ) - Exponential (EMA) - Smoothed (SMMA ) - Linear weighted (LWMA)
Types of the applied price - Close - Open - High - Low - Median Price (HL/2) - Typical Price (HLC/3) - Weighted Price (HLCC/4)
KC-Indicators - KC-MA (移動平均線) - KC-ENV (エンベロープ) - KC-BB (ボリンジャーバンド) - KC-ADX (Average Directional Mov
FREE

What is this indicator?
このインジケーターはMT5のFX検証ソフト「 Knots Compositor 」の 全てのチャートモードに対応した移動平均線 です。 どのチャートモードでも、 チャートに表示されているローソク足で計算して表示します 。
Types of the moving average - Simple (SMA ) - Exponential (EMA) - Smoothed (SMMA ) - Linear weighted (LWMA)
Types of the applied price - Close - Open - High - Low - Median Price (HL/2) - Typical Price (HLC/3) - Weighted Price (HLCC/4)
KC-Indicators - KC-MA (移動平均線) - KC-ENV (エンベロープ) - KC-BB (ボリンジャーバンド) - KC-ADX (Average Directional Move
FREE

What is this indicator?
このインジケーターはMT5のFX検証ソフト「 Knots Compositor 」の 全てのチャートモードに対応したボリンジャーバンド です。 どのチャートモードでも、 チャートに表示されているローソク足で計算して表示します 。
Types of the applied price - Close - Open - High - Low - Median Price (HL/2) - Typical Price (HLC/3) - Weighted Price (HLCC/4)
KC-Indicators - KC-MA (移動平均線) - KC-ENV (エンベロープ) - KC-BB (ボリンジャーバンド) - KC-ADX (Average Directional Movement Index) - KC-MACD (Moving Average Convergence/Divergence) - KC-RSI (Relative Strength Index) -
FREE

Flat è una utility pensata per chi ama operare con take profit e stop loss virtuali ed ordini di copertura come sistema di protezione del capitale, ma a volte ad esempio la notte non è possibile operare quindi si è costretti ad intervenire nel momento e nel modo sbagliato Facciamo un esempio, dopo aver ricevuto un segnale ti posizioni sul mercato con una posizione Long ma il mercato a bassi volumi e comprendi che il tuo posizionamento è valido ma bisogna attendere più di quanto pensavi fosse ne

Profit X invia notifiche sul tuo dispositivo mobile mantenendoti aggiornato sul profitto dei tuoi investimenti anche nei momenti in cui non puoi fisicamente controllare i mercati, ad esempio quando sei alla guida, sul posto di lavoro, in una riunione o con amici, con parenti e non puoi distrarti Può essere disattivata e attivata ed è possibile scegliere la frequenza del aggiornamenti in minuti, ore, giorni, settimanale o mensile La configurazione e personalizzazione è molto semplice, di default
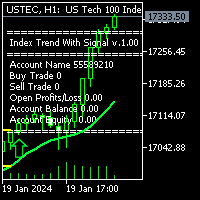
Description: Index Trend with Signal: is the Best working on DE40, USTEC, US30, US500 index on H-1 time chart with default settings. You don't need to change any settings. Easy to install and ready to start working. First of all this Index Trend with Signal Indicator is Non-Repainting, Non-Redrawing Indicator, which is best tool for Index Traders. For limited time only 50% OFF, Now 51$ only. 10 purchases left & the price increases to 30$ and final price will be 300$
Contact me right after t

Vision è un indicatore professionale che legge i dati storici del periodo impostato e in base a tali elabora una previsione scrivendo l'andamento sul grafico, l'impatto visivo eccellente rende chiaro l'andamento del prossimo trend e mette a fuoco il prezzo d'ingresso il posizionamento di ordini e la distanza per SL e TP, di default è impostato con un rapporto bilanciato 24 a 24 ciò significa che in base alle ultime 24 candele prevederà scrivendo sul grafico l'andamento delle 24 candele successi

**MT5** Elevate your risk management game with Equity Savior, the go-to Expert Advisor designed to safeguard your equity during prop firm challenges. This powerful yet user-friendly tool lets you choose your preferred trading session, set a maximum lot size, and establish a daily trade limit effortlessly. Key Features: Session Selection: Tailor your trading approach by selecting specific sessions, aligning with your strategy and prop firm challenge requirements. Max Lot Size Control: Take co

The Morning Star candlestick pattern is formed by three candles. Here’s how to identify the Morning Star candlestick pattern: The first candle must be bearish The third candle must be bullish The second candle must be small compared to the others, like a Doji or a Spinning Top The color of the second candle doesn’t matter Ideally, the body of the second candle shouldn’t overlap with the bodies of the other two candles This 3-candle bullish candlestick pattern is a reversal pattern, meaning t

The Three White Soldiers candlestick pattern is formed by three candles. Here’s how to identify the Three White Soldiers candlestick pattern: Three consecutive bullish candles The bodies should be big The wicks should be small or non-existent This 3-candle bullish candlestick pattern is a reversal pattern, meaning that it’s used to find bottoms. For this reason, we want to see this pattern after a move to the downside, showing that bulls are starting to take control. When a Three White Soldi

The White Marubozu candlestick pattern is formed by one single candle. Here’s how to identify the White Marubozu candlestick pattern: One single bullish candle The body must be big The wicks should be small or non-existent This 1-candle bullish candlestick pattern is a reversal pattern, meaning that it’s used to find bottoms. For this reason, we want to see this pattern after a move to the downside, showing that bulls are starting to take control. When a White Marubozu candlestick pattern ap

The Three Inside Up candlestick pattern is formed by three candles. Here’s how to identify the Three Inside Up candlestick pattern: The first candle must be bearish The second candle must be bullish The close of the second candle should ideally be above the 50% level of the body of the first one The third candle should close above the first one This 3-candle bullish candlestick pattern is a reversal pattern, meaning that it’s used to find bottoms. For this reason, we want to see this pattern

Position Manager serves as an expert advisor (EA) designed to enhance your trading experience by providing a user-friendly panel for intuitive management of your positions. This tool empowers you with a seamless interface, allowing for efficient handling of trades and improved control over your trading positions. The primary objective of Position Manager is to simplify and streamline the management of your positions, enabling you to make informed decisions with ease. Through its intuitive design

Introducing BOOM 1000 EA – 1 Minute. Your Ultimate Trading Partner! The first BOOM 1000 EA to trade Both directions has hit the market!!! Are you ready to take your trading to the next level? Say hello to BOOM 1000 EA – the expert advisor that's revolutionizing the forex market! Trade Both Directions – BUY and SELL: BOOM 1000 EA is not just another ordinary expert advisor. It's a powerful tool that trades both directions, maximizing your opportunities in any market condition. Fast Alg
This trading robot is based on a candlestick pattern and RSI indicator strategy. It looks for candles that have a small body relative to their shadows, indicating indecision in the market. It also checks if these candles are placed at the pivot point. If the close of one of the next candles breaks the resistance line from below and the RSI is above the MA of RSI, then the robot opens a buy order. If the close of one of the next candles breaks the support line from above and the RSI is below th
FREE

Calculate the Variance of prices on the chosen time frame and compare with the price range reached. Or in other words how mutch is price moving in the recent candles? Two impots: Candle = 4 (Default) number of previous candle to calculate Backward = 500 (Default) How many candle to go backward
Variance is calculated as follow: Variance(X) = Average(X 2 ) – [Average(X)] 2
Subsequently Variance is rapported to the price range fo the chosen period (i.e. 4 candles) Indicator = Variance(X) / (
FREE
Are you tired of the hassle and delays in closing your trades. Introducing our revolutionary One Click Close Tool, designed for both MT4 and MT5 platforms, empowering traders with seamless control over their trade closure experience. Instant Execution : Experience lightning-fast trade closures with just a single click. No more navigating through multiple windows or confirmation dialogs take full control of your trading decisions instantly. Our tool boasts a user-friendly interface, ensuring tha
FREE

"QuantumEdge FairValueGap Pro" - The Ultimate Trading Edge!
Elevate your trading experience with the QuantumEdge FairValueGap Pro, your all-in-one solution for unparalleled market insights and precision trading. This cutting-edge indicator brings quantum-level analysis to your fingertips, empowering you with advanced tools to navigate the financial markets.
Key Features:
1️⃣ FairValue Precision: Gain a quantum-edge perspective on market fairness, with a focus on pinpointing the mos

The Liquidation Estimates (Real-Time) experimental indicator attempts to highlight real-time long and short liquidations on all timeframes. Here with liquidations, we refer to the process of forcibly closing a trader's position in the market.
By analyzing liquidation data, traders can gauge market sentiment, identify potential support and resistance levels, identify potential trend reversals, and make informed decisions about entry and exit points.
USAGE (Img 1) Liquidation refer

DeepX Black Edition Expert Advisor is a cutting-edge trading tool meticulously designed for traders seeking a robust and low-risk strategy. Leveraging the power of candlestick patterns, this specialist excels in trend detection, ensuring timely market entry and exit points. With a predefined profit limit and loss limit, the expert advisor prioritizes risk management, providing users with a secure trading environment. Optimized for the H4 time frame, this expert aligns with traders who prefer a b

An indicator to show the current U.S. Dollar Index ( USDX , DXY , DX ). It is a weighted geometric mean of the dollar's value relative to the following select currencies: Euro (EUR), 57.6% weight. Japanese yen (JPY) 13.6% weight. Pound sterling (GBP), 11.9% weight. Canadian dollar (CAD), 9.1% weight. Swedish krona (SEK), 4.2% weight. Swiss franc (CHF) 3.6% weight.
You can request me to customize a similar indicator with weighted and currency pairs you desire. Just call me on MQL5, thank

Introducing Trader's NotifierYo,ur Ultimate Trading Companion
Are you tired of missing crucial market moments because you looked away for just a moment? The frustration of waiting for that perfect confluence, only to realize you've missed it, can be overwhelming. But fear not, because Trader's Notifier is here to revolutionize the way you trade!
Seize Every Opportunity
Trader's Notifier is your vigilant ally, keeping a watchful eye on your charts so you don't have to. No more staring at t
FREE

O Afastamento da Média Móvel, é uma poderosa ferramenta de análise técnica projetada para fornecer uma representação visual do afastamento entre o preço atual e uma média móvel específica. Este indicador, desenvolvido para o MetaTrader, oferece aos traders uma perspectiva clara das mudanças na dinâmica de preço em relação à tendência de médio prazo.
Versão MT4: https://www.mql5.com/pt/market/product/111705
FREE

The Bearish Engulfing candlestick, a potent signal in technical analysis, marks a potential shift in market sentiment. This compelling pattern unfolds when a smaller bullish candle is completely overshadowed by a larger bearish candle. The Bearish Engulfing signifies a transition from bullish to bearish momentum, capturing the attention of traders anticipating a downtrend. Savvy investors leverage this pattern to identify potential selling opportunities, signaling a shift towards bearish market

The Shooting Star candlestick, a key player in technical analysis, serves as a harbinger of potential trend reversals in financial markets. Distinguished by its small real body, long upper shadow, and minimal lower shadow, the Shooting Star suggests a shift from bullish to bearish momentum. Traders keen on market insights often use this pattern to identify potential selling opportunities, highlighting potential weakness after an uptrend. Harness the power of the Shooting Star to refine your cand

If you need MT4 version or can't afford renting/purchasing contact me for alternative solution. If you'd like to purchase multiple EAs (minimum 2 EAs) as a custom package contact me for 15% special discount for the package. Introducing Mito Velocity, a trading advisor built for serious traders who want a serious edge over the market. This advisor is the result of extensive research and testing, using a spatial AI algorithm to measure the deceleration of trends and enter at potential trend rev

Elevate your trading experience with Dynamic Trader EA MT5 , a cutting-edge trading robot designed to optimize your investment strategy. This advanced algorithm harnesses the power of four key indicators: RSI ( Relative Strength Index ), Stochastic Oscillator , MACD ( Moving Average Convergence Divergence ) and ATR ( Average True Range ) to make informed and precise trading decisions. ATR is used to dynamically set stop-loss and take-profit levels based on market volatility. IMPORTANT!
Read
MetaTraderマーケットは、履歴データを使ったテストと最適化のための無料のデモ自動売買ロボットをダウンロードできる唯一のストアです。
アプリ概要と他のカスタマーからのレビューをご覧になり、ターミナルにダウンロードし、購入する前に自動売買ロボットをテストしてください。完全に無料でアプリをテストできるのはMetaTraderマーケットだけです。
取引の機会を逃しています。
- 無料取引アプリ
- 8千を超えるシグナルをコピー
- 金融ニュースで金融マーケットを探索
新規登録
ログイン