YouTubeにあるマーケットチュートリアルビデオをご覧ください
ロボットや指標を購入する
仮想ホスティングで
EAを実行
EAを実行
ロボットや指標を購入前にテストする
マーケットで収入を得る
販売のためにプロダクトをプレゼンテーションする方法
MetaTrader 5のための新しいエキスパートアドバイザーとインディケータ - 33

Oracle Trading Expert the Quintessence of Modern Programming Technologies Expert Oracle for MetaTrader, trading on GBPUSD and Gold, represents the quintessence of modern programming technologies. Our unique proprietary methods and developments are based on advanced machine learning concepts, making our trading expert truly one-of-a-kind. We offer cutting-edge modules and neural architecture that embody innovative advancements in financial programming. Our algorithms rely on in-depth data analysi

元の価格 $269 → 50%割引で $129 のみ ライブ結果
Tiger Trade Pro - 自信を持って取引するための鍵! Tiger Trade Proは、Scalp-Trendシステムを使用し、他の類似したEAと比較して非常に有利なリスクを持つ実際かつ一貫して利益を上げるEAです。このEAは、取引スタイルに合わせてシンプルな設定と高度な設定の両方を提供しています。
カスタマイズされた設定: あなたがシンプルな設定を好むか、高度なコントロールを好むかに関わらず、Tiger Trade Proは対応しています。高度なオプションには次のものがあります:
トレーリングストップ:利益を保護します。 自動ロット:システムによってアカウントの純資産に基づいて取引サイズを調整します。 資産停止:資産範囲を定義して損失を最小化します。 時間取引:特定の時間に取引を実行。 ダイナミックステップ:市場条件に基づいて収益性を最適化します。
市場の状況に適応可能:Tiger Trade Proは異なる市場の状況にシームレスに適応し、柔軟性と強靭性を確保します。特に、スリッページ

Welcome to the world of innovative and efficient gold trading with GoldPro - an advanced trading robot specifically designed to help you achieve success in the Gold market.
The advisor uses the averaging technique, you should perceive this not as good or bad, but as an approach that works in the market, discarding the unipolar belief that one method is good and the other is bad, it exists and can be successfully applied, this is a fact.
Reliability and Experience: GoldPro is the result of c

へようこそ IndexLORD EA は 、主要指数 (NASDAQ/DOW/SP500) 向けに開発された効率的なスキャルピング システムです。 20 年以上の経験を持つクオンツ チームによって開発されたこのシステムは、積極的で強力な取引マシンです。 IMPORTANT! After purchase contact me for any ongoing bonus, manual and installation guide, also for risk assessment if you use prop etc. その他の製品はこちら: https://www.mql5.com/en/users/fxmanagementforexltd/seller Live Performance €5K Account Trading Now €20K++ : https://www.mql5.com/en/blogs/post/756211 索引主 主要な指数を利用する指数ディーラーです。この重要な外国為替市場は、良好な流動性、タイトなスプレッド、日中条件で運営されて

Hitech 強力で安定した取引システム! 世界的なサポートとレジスタンスのレベルからのみ取引してください。 さらに、フィルターは独自のインジケーターで使用されます。 最大の利益を得るために、部分的に注文をクローズする注文グリッドが含まれています。 信号
MT5 https://www.mql5.com/ru/signals/1842919?source=サイト +プロフィール+販売者 MT4 https://www.mql5.com/ru/signals/1776144?source=サイト +プロフィール+販売者
通貨ペア: GBPUSD、EURUSD、EURGBP、USDCAD、EURCAD、最小ロットを使用 ロールバック通貨ペアの場合、AUDCAD、AUDNZD、NZDCAD の増量ロットを使用できます。
時間枠: M15
設定
AutoMM=0 Lots=0.01の場合ロットを修正 オートロットの場合は株式残高を使用します
AutoMM。 積極的 = 1000、保守

トレーダーとPropFirmsの挑戦者向けのZenith Zone Botをご紹介します。このロボットは、カスタム開発されたテクニカルおよびファンダメンタルインジケーターに基づいたユニークな戦略を採用しており、一年以上にわたる専念した研究と改良を経ています。 Zenith Zone戦略は、以下の4つの包括的なステップで展開されます: 確認済みのサプライとデマンドのレベル:ロボットは確認済みのサプライとデマンドのレベルを計算することから始め、市場での正確なエントリーポイントと出口ポイントを可能にします。 リキディティの吸収:高度なアルゴリズムを活用して、ロボットはトレーディングペアのリキディティの吸収を評価し、トレードの実行を最適化し、スリッページを最小限に抑えます。 デイリーレリティブパフォーマンス:戦略には、トレーディングペアのデイリーレリティブパフォーマンスの堅実な評価が組み込まれており、変動する市場状況に対応した適応的な対応を保証します。 影響力のあるニュース分析:Botはリアルタイムで、トレーディングペアに関連する当日の重要なニュースの影響を評価し、ダイナミックで反応性のある取

MT4バージョン: https://www.mql5.com/ja/market/product/90077
MT5バージョン: https://www.mql5.com/ja/market/product/103136
「KingKong」エキスパートアドバイザー (EA) は、外国為替市場向けに設計された洗練された取引アルゴリズムであり、市場の流動性が高まる期間に有効になるブレイクアウト戦略を活用しています。 この EA は、取引量が急増したときに発生する大きな価格変動を利用するように作られており、市場活動の最適な瞬間に取引が実行されるようにします。
主な特徴:
ブレイクアウト戦略:
市場の流動性の検出: KingKong は、高度なアルゴリズムを採用して市場の流動性をリアルタイムで監視します。 これは、多くの場合、大きな価格変動の前兆となる、出来高が増加する期間を特定します。
ブレイクアウトの特定: このような流動性の高い期間中、KingKong は過去のデータとテクニカル指標に基づいて潜在的なブレイクアウト ポイントを特定します。 EA

BUILDING ON THE SUCCESS OF MY POPULAR FREE EA 'CAD SNIPER'... I PRESENT CAD SNIPER X!
THOUSANDS MORE TRADES | NO BROKER LIMITATIONS | BETTER STATISTICS | MULTIPLE STRATEGIES
Send me a PRIVATE MESSAGE after purchase for the manual and a free bonus
TWO STRATEGIES IN ONE FOR AUDCAD, NZDCAD, GBPCAD and CADCHF Strategy 1 can be used with any broker, trades much more frequently and is the default strategy for CAD Sniper X. It's shown robust backtest success for many years and is adapted

Smart Delta Volumeは市場のボラティリティに応じて自動的に調整されるダイナミックレベルを使用しています。この特徴により、市場の条件の変化により正確で適応性のある分析がリアルタイムで行われます。ダイナミックに調整する能力を持つSmart Delta Volumeは、取引量のフローと価格の行動についてより包括的で信頼性のある見解を提供します。 さらに、Smart Delta Volumeには、価格が2つのダイナミックレベルを超えた場合にトリガーされるプルバックの検証機能があります。この条件により、プルバックの有効性が確認され、識別されたトレンドに対する信頼が高まります。このプルバックの客観的な検証は、トレーダーにとって重要であり、偽のシグナルを回避し、より情報を元にした安全な取引の決定を行うのに役立ちます。 取引の機会を正確に特定し、常に変化する市場条件に適応し、トレンドやプルバックを客観的に確認するという精度を持つSmart Delta Volumeインジケーターは、経験豊富なトレーダーのテクニカル分析のツールとして貴重な存在です。

******first of all I would like to inform you that if you want to test the EA, please set it up as per the picture below. I need to change the input value due to website requirements. Hello, I have created a robot regarding fund exams. You can OPtimize to get the value that suits you. This EA I extracted from a fund examination on the internet. working system EA will open pending Buy and Sell 1 stick each and when there is profit there will be Trailling stop to maintain profit. When the order is

Classic MACD
It has MACD line, Signal line, and Histogram . The Histogram has 4 colors , showing its movement direction as simple as possible. The smoothing factor in the input helps to eliminate noisy signals. Besides different price types (hlc, hlcc, ohlc, ...), there is an option to use volume data as the source for MACD calculations (which is better to be used by real volume not unreliable tick volume). While the original MACD indicator uses Exponential Moving Average, this indicator provid
FREE

Currency Strength Dynamic 通貨強さのダイナミックは通貨の強さを示す指標です。 通貨の強さは、通貨が含まれるほとんどまたはすべての通貨ペアのトレンドの方向を指します。
この指標は、MACD 指標と同様に、28 の最も人気のある通貨ペア (メジャー通貨ペアとマイナー通貨ペア) の移動平均間の差の測定値に基づいています。 利点 独自の振動計算法 特定の通貨の明細を無効または有効にするボタンの利用可能性 情報テーブル 2 種類のアラート: インジケーターのラインが交差したときと、ラインが指定されたレベルを交差したとき。 描画されるバーの数はオプションです。 各ポイントを詳しく見てみましょう。
独自の振動計算方法により、インジケーターが長時間最大値に留まらず、発散と収束のよく知られた効果と同様に、事前に最大値から抜け出すことができます。 この方法には、指定された計算期間と読み取り値をより滑らかにする平滑化レベルも含まれます。 計算には無駄な計算式や冗長な計算式が含まれないため、端末への負荷が軽減されます。
特定の通貨の行を無効または有効にするボタンがあるこ

毎日特定のローソク足で動くPIVOTを何度探したことでしょう。
多くのトレーダーは、マーケットが開いてから30分後、正午12時など、毎日特定の時刻を基準にして、その日のトレンドの方向性を推し量ることを好みます。
このインディケータでは、特定の時間(時、分)を指定し、その時間から翌日までのピボットを同時にプロットすることができます。その特定のローソク足/時間に基づき、中央値、最大値、最小値、サポ ート、レジスタンスの5本のラインが表示されます。
選択した時間がPERIODの制限外(M5タイムフレームの10:12など)である場合、この値は最も近いローソク足の時間に切り上げられます。さらに、ユーザーはすべての線のスタイル、色、幅を設定することができます。
これで良いトレードができることを願っています。 また、時間範囲に基づくPIVOTが必要な場合は、 他の製品をご覧ください 。
FREE

HighDaily
このエキスパートアドバイザーは、HighDaily、ATR、および保留注文に基づいて、EURUSD H1向けに開発されました。20年以上のティックデータを使用して99%のモデリング品質でバックテストされました。添付されたスクリーンショットは、モンテカルロ分析による1000回のシミュレーションでの堅牢性テストを示しています。より良いパフォーマンスのためにスプレッドとスリッページの少ないブローカーをお勧めします。パラメーターを設定する必要はありません、これらの設定は最適化されています。 大口口座を使用する必要はありません。私は200米ドルから0.01ロットで取引することをお勧めします。
モンテカルロテスト
1000回のシミュレーション ティックデータを30%の確率でランダム化し、最大価格変動ATRを10%上下にランダム化 スプレッドを0から3にランダム化 戦略パラメーターを20%の確率でランダム化し、最大変更10%
テストのワークフロー
IS/OOSテスト、テスト期間を10部分に分割します。 異なる時間枠(30M)でのテスト。 最近性のテスト。 モンテカ
FREE

Accurate Gold インジケーターは、経験レベルに関係なく直感的で使いやすいユーザーフレンドリーなツールです。このインジケーターは、ゴールド市場のM5タイムフレームで正確なシグナルを探しているトレーダーを対象に設計されています。このインジケーターは、価格の動きと出来高ダイナミクスを分析するために高度な数学的アルゴリズムを使用し、正確な買いと売りのシグナルを生成します。このインジケーターの特長的な要素、リペイントしない性質を含め、トレーダーには市場の逆転の可能性に対する貴重な洞察を提供し、情報を元にした意思決定を可能にします。チャート上での視覚的な表示、聞こえるアラート、およびプッシュ通知により、ユーザーエクスペリエンスが向上し、正確性と信頼性を求めるゴールドトレーダーのツールキットに貴重な追加となります。 $35 - 期間限定で、最初の5人 のサポーターは35ドルで提供されています。 (残り1部)
$88 - ローンチ価格は88ドルです 。
$88 + X ($100) – 価格は5回の購入ごとに$100ずつ増加します。 MT5の信号 はこちらで 、ディ

HAshi-EはHeiken-Ashiシグナルを分析するための強化された方法です。
説明
HAshi-Eは、Heiken-Ashiシグナルを分析するための強化された方法です。HAshi-Eは、Heiken-Ashiシグナルを分析するための強化された方法です。HAshi-Eは、Heiken-Ashiシグナルを分析するための強化された方法です。伝統的なローソク足チャートとは異なり、ヒーケンアシのローソク足は過去のバーの平均値を使って計算されるため、よりスムーズで解釈しやすい視覚的表現が可能です。
その主な利点は、ほとんどの人が本来の読み方をしない理由でもあります。HAshiローソク足には平均値に関する情報が含まれており、通常、資産ローソク足の前に配置されているため、色や形に惑わされ、不適切な時間帯や遅い時間帯にエントリーやエグジットを行う人をよく見かけます。
このような背景から、HAshi-Eは従来のHeiken-Ashiインジケータの改良版です!
HAshi-E(別ウィンドウ版)の特徴: 同じデータを様々な角度から見る: HAshi-Eは伝統的なローソク足だけでなく

毎日特定の時間枠で機能するPIVOTを何度探しましたか?
多くのトレーダーは、NYSEが開く2時間前から1時間後まで、あるいはNYSEが開 いてから30分後までといったように、毎日特定の時間間隔に基づいて、その 日のトレンドの方向性を予測することを好みます。
このインディケータは、特定の時間間隔(時 間と分)を指定し、その時間間隔から同じ時間間隔で翌日までのピボッ トをプロットします。こ れ に 基 づ い て 、中 央 値 、高 値 、安 値 、サ ポ ー ト 、レ ジ ス タ ン ス の 5本の線が表示されます。
選択した時間がPERIODの制限外(M5タイムフレームの10:12など)である場合、この値は最も近いローソク足の時間に切り上げられます。さらに、スタイル、色、幅の面ですべてのラインを設定することができます。
これで良いトレードができることを願っています。

F-35 Lightning II MT5 エキスパートアドバイザーのご案内 残りわずか7部、 価格は$250. 00ですが、 完売後は$450. 00になります。 F-35 Lightningをご愛用いただきありがとうございます。 改善は今後も続けられ、 近日、 このEAを使って30日でプロップファームに合格する方法のガイドを作成する予定です。 口座残高に基づいて推奨ロットサイズを超えないでください。 プロップチャレンジに合格するだけではありません。合格後も、ほとんどすべてのプロップファームと互換性があります。 このEAは過去のデータに合わせて過度に最適化されていません。 このEAは価格変動に基づいており、 キーゾーンであればトレンドまたは逆トレンドに基づいて実際にトレードを行います。 最佳取引時間はGMT+2の午前2時から午前10時です。 この設定は変更しないことを強くお勧めします。 ライブトレードシグナルはこちら ------> https://www.mql5.com/en/signals/2196649 F-35 Lightning II MT5は、 価格アクションとトレン

The ICT Unicorn Model indicator highlights the presence of "unicorn" patterns on the user's chart which is derived from the lectures of "The Inner Circle Trader" (ICT) .
Detected patterns are followed by targets with a distance controlled by the user.
USAGE (image 2) At its core, the ICT Unicorn Model relies on two popular concepts, Fair Value Gaps and Breaker Blocks. This combination highlights a future area of support/resistance.
A Bullish Unicorn Pattern consists ou

Limited Time Offer! Only $ 150 USD ! The price will increase by $100 USD after every 10th purchase ! Final price: $ 30 000 USD DESCRIPTION : Attention! Contact me immediately after purchase to receive setup instructions!
The Expert Advisor (EA) is designed for capital distribution. We have made every effort to ensure that the minimum deposit is $50 USD.
This advisor is intended for trading with the broker Deriv. The EA has been optimized over the past year, starting

テクニカル分析の領域では、ParbMAはParabolic SARのトレンドを調査するための非常に直感的なツールとして浮かび上がります。この革新的なアプローチは、カスタマイズ可能なラインを活用し、その色、形状、幅のオプションにおいてその汎用性が際立っています。この柔軟性により、視覚的な分析が向上し、戦略の立案や意思決定に大きく役立ちます。
ParbMA(Parabolic Moving Average)は、J. Welles WilderのParabolic SAR(Stop and Reverse)と移動平均の概念を組み合わせたカスタムの技術指標です。このハイブリッド指標は、これらの手法の利点を捉え、金融市場における価格トレンドと潜在的な反転ポイントを追跡する独自の方法をトレーダーに提供することを目的としています。
ParbMAの主な特徴
カスタマイズ可能な視覚的表現: ParbMAの中心には、ラインを通じてトレンドを表現する能力があります。ユーザーはこのラインを好みに合わせて、様々な色、形状、幅から選択することができます。このカスタマイズのレベルにより、トレンドの表現

This is one of the most popular and highly rated volatility index (VIX) indicators on the market. It provides the same readings as the VIX does for stock indexes. However, this indicator works across all asset classes. VIX Fix Finds Market Bottoms. This indicator is not for inexperienced traders. Use it for day and swing trading. MT4 Version - https://www.mql5.com/en/market/product/112238 Bernard Baruch summed it out best: "Markets fluctuate." The Chicago Board Options Exchange (CBOE) Vo
FREE

GOLD ESCAVATOR TRADING BOT A trading bot for XAUUSD. Lot size is calculated by multiplying the lot factor by each 100 USD on account. NB: These are risky strategies which give good returns over time but also pose a risk of blowing up your account. Use on your own accord. LINKS Automatic Pattern and Trendline Analyst : https://www.mql5.com/en/market/product/88794 Automatic Price Action Level Plotter: https://www.mql5.com/en/market/product/94338 MQL5 SIMPLIFIED SUMMARY; learn how to code your
FREE

Welcome to WarungFX https://t.me/warungfx ,
Please set autovalidation to false, input at the bottom under comment variable.
This bot can be use for managing your manual order from any device and in the same time open position based on price action when there is signal and no open order, Backtested 2013-2023 EURUSD M2, GBPUSD M2, default setting NZDUSD m15, default setting USDJPY H1, AUDCAD H1, USDCHF H1, EURCHF H1, GBPCAD H1, AUDJPY H1, using default setting. For Forex Pair I will be using 1

Send signals to your Discord channel in a simple way. Enjoy.
All instructions on YouTube video, this don't need a large description.
I add unnecessary text that Metatrader asks me for:
Once upon a time, in a quaint little village, there lived a curious and adventurous young girl named Lily. Lily had big, bright eyes that sparkled with excitement, and she loved exploring the enchanted forest that bordered her home.
One sunny morning, Lily decided to embark on a special advent
FREE
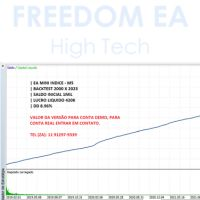
Looking to boost your financial market results?
The EA Mini Index is the answer. Tested and enhanced since 2000, this expert advisor offers operations on the M5 chart, with an initial balance of R$ 1,000 and an impressive net profit of R$ 420,000 until 2023, maintaining a drawdown of only 8.96%.
Seize this unique opportunity to increase your profitability and operate more effectively.

Market Cycle and Trading Sessions Indicator
Introducing our Market Cycle and Trading Sessions Indicator, a tool designed to provide you with a comprehensive view of the financial market like never before. Observe the market's pulse with our exclusive indicator. Gain a deep understanding of market phases, from accumulation to distribution, to make informed, strategic decisions with a high probability.
What makes our indicator?
1. Date Range for Calculations: Customize the start and end da
FREE
Limited Time Offer! Only $ 150 USD ! The price will increase by $100 USD after every 10th purchase ! Final price: $8000 USD DESCRIPTION : Attention! Contact me immediately after purchase to receive setup instructions!
The Expert Advisor (EA) is designed for capital distribution. We have made every effort to ensure that the minimum deposit is $100 USD.
This advisor is intended for trading with the broker Deriv. The EA has been optimized over the past year, starting fr

This indicator show Gann Swing Chart (One Bar) with multi layer wave. 1. Wave layer F1: Gann waves are drawn based on candles. SGann wave(Swing of Gann) is drawn based on Gann wave of wave layer F1. 2. Wave layer F2: Is a Gann wave drawn based on the SGann wave of wave layer F1. SGann waves are drawn based on Gann waves of wave layer F2. 3. Wave layer F3: Is a Gann wave drawn based on the SGann wave of wave layer F2. SGann waves are drawn based on Gann waves of wave layer F3. ---------Vi
FREE

Only 6 copies left at $99 USD. Next price is 199 USD Safe Scalping is a scalping trading strategy.
The Expert Advisor analyzes historical data of a certain period and finds certain patterns. After the analysis is completed, it determines market entry points. For more conservative trading it is enough just to reduce the lot size.
It's possible to start trading from 1 USD (cent accounts).
Recommendations:
- H1 EURUSD
- Leverage 1:500 or higher
- Minimum deposit 100 units of currency o

O Touch VWAP é um indicador que permite calcular uma Média Ponderada por Volume (VWAP) apenas apertando a tecla 'w' no seu teclado e após clicando no candle do qual deseja realizar o calculo, clicando abaixo do candle é calculada a VWAP baseado na minima dos preços com o volume, clicando sobre o corpo do candle é calculado uma VWAP sobre o preço medio com o volume e clicando acima do candle é calculado uma VWAP baseado na máxima dos preços com o volume, voce tambem tem a opção de remover a VWA
FREE

BreakHarmony Multi-Timeframe Breakout Indicator for MT5
The BreakHarmony Multi-Timeframe Breakout Indicator for MT5 is a highly advanced tool providing information on breakout points across different timeframes, aiding traders in decision-making and understanding market movements. [ Features and Manual | MT4 version | All Products ] The indicator tracks breakout points on price charts across 6 timeframes. Breakout prices are indicated with the closing price of the correspond

One of the best trend indicators available to the public. Trend is your friend. Works on any pair, index, commodities, and cryptocurrency Correct trend lines Multiple confirmation lines Bollinger Bands trend confirmation Trend reversal prediction Trailing stop loss lines Scalping mini trends Signals Alerts and Notifications Highly flexible Easy settings Let me know in the reviews section what you think about it and if there are any features missing.
Tips: Your confirmation line will predict tr
FREE

What is this script? このスクリプトは 全てのチャートのオブジェクトを一括で削除します 。 スクリプトを走らせれば確認のためのメッセージボックスが表示されるので、了承すれば全てのチャートのオブジェクトが一括で削除されます。 このスクリプトはMT5のFX検証ソフト「 Knots Compositor 」の拡張機能でもあります。
How to use 1. スクリプトを走らせる 2. 確認のためのメッセージボックスが表示されるので了承する 3. 全てのチャートのオブジェクトが一括で削除される
How to run
- ナビゲーターウインドウを開いて、このスクリプトをダブルクリックする - ナビゲーターウインドウを開いて、このスクリプトをチャートにドラッグアンドドロップする - ナビゲーターショートカットウィンドウを開いて、このスクリプトをショートカット設定する
FREE

Equity X è una utility che chiude tutte le posizioni ed eventuali ordini pendenti ad un importo prestabilito, è possibile fissare il bilancio del tuo conto quando il netto e uguale o superiore oppure uguale inferiore all'importo desiderato Ha integrato un sistema per la notifica mobile instantanea che genera il messaggio ad operazione avvenuta Uno strumento che permette di ottimizzare al massimo il rendimento del tuo investimento, è possibile utilizzarlo anche come gestore virtuale di take prof

The Bullish Harami candlestick pattern is formed by two candles. Here’s how to identify the Bullish Harami candlestick pattern: The first candle must be bearish and have a big body The second candle must be small and bullish The second candle is inside the body of the first candle This 2-candle bullish candlestick pattern is a reversal pattern, meaning that it’s used to find bottoms. For this reason, we want to see this pattern after a move to the downside, showing that bulls are starting to

The Tweezer Bottom candlestick pattern is formed by two candles. Here’s how to identify the Tweezer Bottom candlestick pattern: The first candle is bearish The second candle is bullish The lows from both candles should be pretty much at the same level This 2-candle bullish candlestick pattern is a reversal pattern, meaning that it’s used to find bottoms. For this reason, we want to see this pattern after a move to the downside, showing that bulls are starting to take control. When a Tweezer Bott

The Three Outside Up candlestick pattern is formed by three candles. Here’s how to identify the Three Outside Up candlestick pattern: The first candle is bearish and small The second candle is bullish and engulfs the first one completely The third candle is bullish and closes above the other ones This 3-candle bullish candlestick pattern is a reversal pattern, meaning that it’s used to find bottoms. For this reason, we want to see this pattern after a move to the downside, showing that bulls are

The Bullish Counterattack Line candlestick pattern is formed by two candles. Here’s how to identify the Bullish Counterattack candlestick pattern: The first candle is bearish and big The second candle is bullish and small There’s a gap between the close of the first candle and the open of the second candle They both close at the same level This 2-candle bullish candlestick pattern is a reversal pattern, meaning that it’s used to find bottoms. For this reason, we want to see this pattern after a

The Dragonfly Doji candlestick pattern is formed by one single candle. Here’s how to identify the Dragonfly Doji candlestick pattern: The candle has no body The wick at the bottom must be big At the top, it should have no wick, or be very small This 1-candle bullish candlestick pattern is a reversal pattern, meaning that it’s used to find bottoms. For this reason, we want to see this pattern after a move to the downside, showing that bulls are starting to take control. When a Dragonfly Doji cand

Limited Time Offer! Only $ 150 USD ! The price will increase by $100 USD after every 10th purchase ! Final price: $ 15 000 USD DESCRIPTION : Attention! Contact me immediately after purchase to receive setup instructions!
The Expert Advisor (EA) is designed for capital distribution. We have made every effort to ensure that the minimum deposit is $100 USD.
This advisor is intended for trading with the broker Deriv. The EA has been optimized over the past year, starting
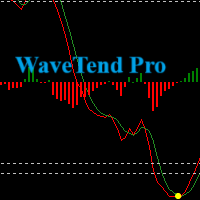
Introducing our Wave Trend Oscillator Indicator , exclusively designed for MetaTrader 5 . This advanced tool is a must-have for traders who seek precision and efficiency in their trading journey. Our oscillator is built on the principles of wave trend analysis , capturing the ebb and flow of market trends with unparalleled accuracy. It helps traders identify potential buying and selling points based on market wave patterns, enabling you to stay ahead of the market. One of the key features of ou
Subscribe to the 'MA7 Trading' channel to receive notifications about new programs, updates and other information. Ask questions in the profile on the MQL5 .
Description of work
The 'MA7 Agave' indicator is based on the standard Average Directional Movement Index (ADX) indicator. Shows the intersection of the +DI and -DI lines. Detailed information about the 'MA7 Agave' indicator.
Indicator settings
General settings: ADX period - Average Directional Movement Index indicator period.
'MA7

Compared to simple or exponential moving averages, slow adaptive trend lines might offer a more nuanced view of the trend by adjusting their sensitivity based on market conditions. However, their slow nature might also mean they are late in signaling reversals when market conditions change rapidly - and that is the difference between them and our SlowAMA .
SlowAMA was designed to be a better long-term trend indicator than EMA and other Moving Averages. It uses our JurMA calculations, reducing

Our goal is to empower every trader with their own unique trading system.
Indicator - Red-Green Series
Ultimate simplicity: Red for uptrend, green for downtrend! It can be used independently or in combination with other indicators. This is a red-green indicator based on the crossover of two moving averages. We have more indicators in store and will be adding them gradually. Friends who make a purchase are kindly requested to contact us after their purchase.
In the world of financial tradi

MT5TradePanel_V1 The panel supports market and pending orders Closing of positions by order type -trade -statistics - risk management - Trailing Stop -select the variant of risk calculation FIXED_LOTS, // fixed lots RISK_MONEY, // lots based on money RISK_RATIO // risk percent of account - percent of loss warning -percent od loss close all -show symbol info
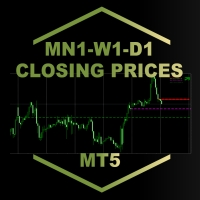
MN1-W1-D1 Close Price Indicator to Index Trading for MT5
The indicator draws lines to the close prices of the last closed bars of monthly, weekly and daily timeframes. Observably, these prices are significant support and resistance prices at major indices, like Nasdaq, DAX. The info panel always shows the prices relative to each other in the correct order. If the current price is the highest - i.e. higher than the last monthly, weekly and daily closing price - it is in the first row. The lowest

Introducing the Engulfing Goddess Metatrader 5 (MT5) Indicator , a revolutionary tool designed for traders who seek to harness the power of candlestick patterns in their trading strategy. This indicator is built on the principles of engulfing candlestick patterns , a popular method used by successful traders worldwide. Our Engulfing Goddess Indicator stands out with its ability to detect various kinds of engulfing patterns . It employs a range of filters, providing you with a comprehensive anal

Introducing the Accelerator Divergence Indicator, a powerful tool designed to enhance your Forex trading experience. This innovative indicator is specifically crafted to identify market divergence, providing traders with valuable insights for more informed decision-making. The Accelerator Divergence Indicator utilizes advanced algorithms to detect divergence in the market, visually guiding traders with precision-drawn lines that highlight key points of interest. Divergence occurs when the price
FREE

Baby WPR opera automáticamente en base al algoritmo oscilador WPR. Es capaz de llegar a generar resultados alcistas en las pruebas realizadas con el par de FX GBPUSD en el marco temporal H1 Se puede testear en otros instrumentos ajustando sus diversas opciones. Diseñado para operar con un capital mínimo de 100 USD y un apalancamiento de 1:30 Ideal para los iniciados. Con Baby WPR no esperes grandes beneficios con la configuración conservadora por defecto, por el contrario habrán DD significativo
FREE

Introducing The Day Trader System: Your Shortcut to Day Trading Success! Are you a day trader seeking simplicity without compromising profitability? Look no further! We present The Day Trader System – your go-to solution for identifying lucrative opportunities in the fast-paced world of Forex. Simple Yet Powerful: The Day Trader System is a straightforward yet highly effective indicator designed exclusively for day traders. Say goodbye to complexity and hello to a system that simplifies
FREE

Exclusive FOREX account HEDGE FuzzyLogicTrendEA is based on fuzzy logic strategy based on analysis 5 indicators and filters.
When the EA analysis all this indicators, it decides, based on its fuzzy strategy, which trade will be better: sell or buy.
As additional functions, it´s possible defines spread maximum, stop loss and others.
Recomm. Symbol: EURUSD, AUDUSD, GBPUSD, NZDUSD, USDCAD, AUDCAD, EURCAD e USDJPY
Recomm. timeframe: H1.
Backtest were done on EURUSD, H1, 01/07/2023 - 26/0

This indicator helps you identify support and resistance levels. Also it adds break points when level is broken. Price sometimes goes back to break point. It has 4 technical parameters and 4 buffers for expert advisors. Buffer indexes: 0 - Resistance, 1 - Support, 2 - Resistance break point, 3 - Support break point". Number of Levels: Determines how many levels are on graph ( if 3 - 3 levels of support and 3 levels of resistance) Tolerance in percentage %: This parameter is used to filter out

ACCOUNT FLIPPER EA A trading bot for GBPUSD Lot size is calculated by multiplying the lot factor by each 1000 USD on account. Advisable to use account sizes of USD 1000 and above. Account types: Hedge accounts, Standard accounts are preferred i.e. no commissions, Use well regulated brokers eg ICMarkets. all this provides room for the strategy to work smoothly for stabilized results and removing the possibility of the model crashing. ADJUST The Time settings to your own time zone because the
FREE

Introducing UJ Master EA, a simple yet powerful Expert Advisor for trading the USDJPY pair! Developed, tested and traded by a team of experienced traders with trading experience of over two decades. Prop-Firms Ready Easy To Set up Not sensitive to broker conditions UJ Master EA is updated every 3 months to get the best results!
UJ Master EA utilizes a complex price action strategy and smart money concepts, following strict mechanical rules. For the best possible results, follow these st

Что показывает на графике индикатор TrendBreak? 1 — рисует линию тренда до максимальных максимумов в 100 баров. 2 — рисует линию тренда до максимальных максимумов в 30 баров. 3 — рисует линию тренда до максимальных минимумов в 100 баров. 4 — рисует линию тренда до максимальных минимумов в 30 баров. И эти линии указывают на сжатие тренда. Также индикатор выбирает 100-й бар и рисует ровную линию к максимуму и минимуму.
FREE

O Chart Control é um indicador que permite de forma rapida e pratica alterar o timeframe e ativo do grafico, possibilitando que voce possa fazer todas as suas analises em apenas um grafico sem precisar abrir vários, além disso voce pode escolher o entre os temas claro e escuro para o qual melhor se adapta a sua preferencia.
MT4: https://www.mql5.com/pt/market/product/112155
FREE

The underlying strategy of this indicator is based on identifying momentum in the market and attempting to capture the direction of the trend through transitions between bullish and bearish moments. Utilizing bands around the RWMA allows for identifying potential overbought and oversold situations in the market.
1. Calculation of the Range Momentum Index (RMI): The RMI is based on a combination of the Relative Strength Index (RSI) and the Money Flow Index (MFI), both of which are momentum ind
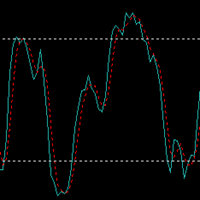
Simple EA with two indicators (SMA + STOCHASTIC) and Grid. The Expertadvisor opens positions in the direction of the trend when the lines of the Stochastic indicator intersect in the swing high or swing low area. It then uses a simple grid strategy if the position turns into a loss. Grid levels can be defined specific to the market.
It depends on your personal preferences and the respective market which parameters should be set and how. You have to test it yourself. The EA is programmed in suc

Introducing the True Currency Strength Indicator - Your Ultimate Guide to Market Mastery! Are you tired of guesswork when it comes to trading? Ready to elevate your trading strategy to a whole new level? Look no further! We present to you the True Currency Strength Indicator - the game-changer in the world of Forex trading. Unleash the Power of Multi-Currency Analysis: Gain a competitive edge with our revolutionary indicator that goes beyond traditional single-currency analysis. The Tru
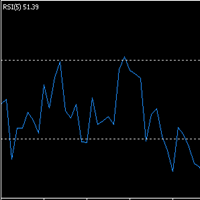
Simple EA with two indicators (SMA + RSI) and Grid. The Expertadvisor opens positions in the direction of the trend when the RSI line turns above 80 or below 20. It then uses a simple grid strategy if the position turns into a loss. Grid levels can be defined specific to the market.
It depends on your personal preferences and the respective market which parameters should be set and how. You have to test it yourself. The EA is programmed in such a way that optimization runs consume little time.
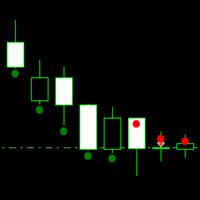
Simple EA with an self-made indicator and Grid. The Expertadvisor opens positions when the market behavior changed from bullish to bearish or vice versa. To determine the market behavior the indicator simply measures how many points it has moved up and down for the last X candles.
It then uses a simple grid strategy if the position turns into a loss. Grid levels can be defined specific to the market.
It depends on your personal preferences and the respective market which parameters should be

A very simple position sizing calculator to help traders calculate the right lot size per trade. It also places the order with one click. All inputs can be edited. So if you want to change the SL or TP or the lot size, you can do so before placing an order. The inputs are the following: SL - stop loss in pips (not points). set to 0 before placing an order to not add SL. TP - take profit in pips (not points). set to 0 before placing an order to not add TP. RISK - dollar amount to risk. i

Recommended currency pairs: USDJPY, CADJPY, EURJPY. and other. Recommended optimization: It is recommended to do balance max optimization or complex criterion max optimization . Min 1/ 2 year in M15/M30/H1. Other recommendations: const_lot_or_not - true - lot is constant, false lot is variable, Trailing_stop - true recommended, stop_loss_on_off - true recommended, take_profit_on_off - false recommended, max of open positions - 1 - 5, max_Analyzed_Bars - from 1 to 50 every


Now, you have your own AUTO-CLOSE program ! Once your account target or drawdown hits, all open orders will be closed automatically. ========================================== INPUTS: Account target: Put the exact account target. Once the equity hits it or went above that, all orders closed. Please add buffer to consider slippage. Use fixed value or dynamic value: Choose whether you will need a fixed value or dynamic value for drawdown. DYNAMIC SETTINGS: Equity-based or Balance-based drawdo

TRADE BOT X A trading bot for XAUUSD,GBPUSD,US-30 index. Risk levels can be adjusted using the coefficients, but also adjust the maximum drawdown as you increase the coefficients Advisable to use account sizes of USD 500 and above. Account types: Hedging accounts, Standard accounts are preferred i.e. no commissions, Use well regulated brokers eg ICMarkets. all this provides room for the strategy to work smoothly for stabilized results and removing the possibility of the model crashing. ADJUST
To get access to MT4 version please click here . This is the exact conversion from TradingView: "HalfTrend" by "Everget". This is a light-load processing indicator. This is a non-repaint indicator. Buffers are available for processing in EAs. All input fields are available. You can message in private chat for further changes you need. Thanks for downloading

Only 2 copies available for $299.00. Next price 999 USD
AI Breakdown is a scalping strategy based on artificial intelligence. Most trading parameters will be automatically retrained and adjusted to the current market thanks to the author's algorithm of market analysis. The strategy does not require any optimization. Set it on the chart according to the recommendation and enjoy trading!!!
Advantages of AI Breakdown: - self-learning parameters - optimal SL/TP ratio - low SL, which makes t

The TradeQL Indicator is a customizable tool that highlights specific trading patterns on candlestick charts. Users can define patterns through TradeQL queries, which the indicator then applies to the chart, visually representing matches and captured groups. Ideal for identifying complex trade setups in real-time.
TradeQL queries are specified using the TradeQL Language. See https://github.com/abdielou/tradeql for more details. This language is expressed as a regular expression. The language a
FREE
MetaTraderマーケットは、開発者がトレーディングアプリを販売するシンプルで便利なサイトです。
プロダクトを投稿するのをお手伝いし、マーケットのためにプロダクト記載を準備する方法を説明します。マーケットのすべてのアプリは暗号化によって守られ、購入者のコンピュータでしか動作しません。違法なコピーは不可能です。
取引の機会を逃しています。
- 無料取引アプリ
- 8千を超えるシグナルをコピー
- 金融ニュースで金融マーケットを探索
新規登録
ログイン