YouTubeにあるマーケットチュートリアルビデオをご覧ください
ロボットや指標を購入する
仮想ホスティングで
EAを実行
EAを実行
ロボットや指標を購入前にテストする
マーケットで収入を得る
販売のためにプロダクトをプレゼンテーションする方法
MetaTrader 5のための新しいエキスパートアドバイザーとインディケータ - 148

Maximum Minimum Candle indicator is a basic indicator (but useful) that shows the highest and lowest candle in a period of time .
The indicator shows the maximum candle and the minimum candle for a defined period of time. You can choose the number of candles that make up the period The indicator will show with color points the maximum and minimum values. A message tells you when the price reaches the maximum or minimum.
Parameters number_of_candles: It is the number of candles that will b
FREE

What are Donchian Channels? Donchian Channels are three lines generated by moving average calculations that comprise an indicator formed by upper and lower bands around a mid-range or median band. The upper band marks the highest price of a security over N periods while the lower band marks the lowest price of a security over N periods. The area between the upper and lower bands represents the Donchian Channel. Career futures trader Richard Donchian developed the indicator in the mid-twentieth c
FREE

Estratégia de negociação MACD O cálculo do MACD é executado uma vez a cada tick, e são considerados para fim de cálculo os três últimos resultados, para analisar o cruzamento da linha de zero, ou seja quando o último resultado for maior que 0 e o antepenúltimo não então há um cruzamento para cima e analogamente para baixo, quando um cruzamento é constatado o estado de uma variável de controle é alterado de "false" para "true", permitindo o abertura de uma posição caso a média de sinal também cru
FREE

Indicador usado para sabermos os pontos de suporte de resistência no gráfico.
Funciona em todos ativos e timeframes.
Acerte exatamente os pontos de entradas e saídas das suas operações. SEE OUR RESULTS ON INSTAGRAM: https://www.instagram.com/diogo.cansi/ TELEGRAM GROUP = https://t.me/robosdsc More information by email dscinvestimentos@gmail.com or by Whatsapp 55-991372299
FREE

The OCTO Indicator is a new and easy to use zero-crossing trend/trend reversal indicator that provides entry signals for both long and short positions. It is based on High/Low divergence and correlation of the values over time.
Reliability of the indicator has been backtested with an example trading robot.
How to use The OCTO indicator is added in a separate window, showing a red and a green indicator line, as well as the zero line for crossing. You can see an example of the standard look a

Corretora recomendada para usar esse indicador: https://tinyurl.com/5ftaha7c Indicador que pinta o candle de amarelo em pontos de muita agressão no mercado. Sempre que o mercado for se movimentar o candle irá ficar amarelo. Valido para todos ativos e todos timeframes. SEE OUR RESULTS ON INSTAGRAM: https://www.instagram.com/diogo.cansi/ TELEGRAM GROUP = https://t.me/robosdsc More information by email dscinvestimentos@gmail.com or by Whatsapp 55-991372299
FREE

参考混沌理论的思想而开发的一款 EA 程序 本程序的MT4版本 适合的商品:EURUSD EURJPY 运行的周期:H1 参数用法介绍: auto_volume : 自动手数 volume_fixed:设置固定手数 volume_init:自动初始手数 auto_indic_param: 自动设置指标参数 signal_D1_period:D1图表的指标信号计算周期 signal_D1_value:D1图表的指标信号参数值 signal_H1_period:H1图表的指标信号计算周期 signal_H1_value:H1图表的指标信号参数值
混沌理论具有三原则: 1、动能永远会遵循阻力最小的方向行进 2、始终存在这通常不可见的根本结构,这个结构决定阻力最小的方向。 3、这种根本结构可以被人发现,并加以利用
本程序以混沌理论为主导思想,结合几个合适的指标,对看似无规律的市场价格行为能够进行相对准确的分析,从而抓住转瞬即逝的短暂信号进行剥头皮型的交易。 EA具有时效性,任何程序都不能保证完全适应未来的行情,不过本程序会经常更新,以使之适应最新的市场特征。

This is a Price Projection for Current Candle from Time Frame M15 To Weekly, It's shows Market Trends Teji (Bullish) Or Mandi (Berries). It's Show Teji High & Low for Bullish Market and Mandi High & Low for Berries Market. We can Plan Our Trade in Well Advance for our Current Open Trade. It's Generate New Data for Every New Candle. You are requested to Please Test it with demo Ac before Use in Real Trade. Please Save it to your Mql\Indicator folder and attache to your chart. if any quay Please
FREE
This OCO Closer is one of the most useful things in my toolbox. You can place as many pending orders as you want on your chart, then after adding this to the chart it will delete them all once a Buy or Sell Position Opens. This is great for those times when you think the price might reverse trend, or if you simply want to hedge your bets both ways. Bear in mind that this will only delete the pending orders on the current currency pair, so you can set Buy and Sell pending orders on as many pairs
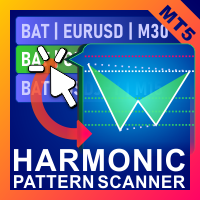
高調波パターン EA 説明を読む代わりにライブチャートでこれを確認したい場合は、 ここから無料のデモをすぐにダウンロードできます。 含まれているパターン:
ABCDパターン ガートレーパターン バットパターン 暗号パターン 3ドライブパターン ブラックスワンパターン ホワイトスワンパターン カジモドパターンまたはオーバーアンダーパターン Altバットパターン 蝶のパターン 深いカニ柄 カニ柄 サメ柄 FiveOパターン 頭と肩のパターン 昇順の三角形のパターン ワンツースリーパターン そして8つのカスタムパターン Voenixは、マルチタイムフレームおよびマルチペアのハーモニックパターンスキャナーであり、25のチャートおよびフィボナッチパターンをサポートします。カスタムブロック光学アルゴリズムを利用し、再描画なしで、確認ステップに依存せずに可能なパターンを迅速に発見できます(ジグザグ計算とは異なります)。 )。 選択したパターンを自動的に交換したり、通知を送信したり、テーブルに収集して簡単にアクセスして評価したりできます。 取引には最大3つの利益目標があり、各目標で成約された注文
FREE

It was developed especially for intraday operations, allowing the market operator to create unconventional candlestick charts, to escape the traditional points of OHLC (Open, Hight, Low and Close).
This Expert Advisor (EA) assembles custom candles in any time frame by seconds unit. You can generate charts that are not available in standard Metatrader 5 periods, for example: Generate a chart of an unconventional time frame of 27 seconds or, if you want to generate 7 minutes time frame, jus
FREE

Easy Virtual Trader Free MT5
簡単な仮想トレーダー無料-5ピップストップロスでEURUSDのみ Get the full - Easy Virtual Trader : https://www.mql5.com/en/market/product/42804
Easy Virtual Traderのセットアップ>ルールの入力>モバイル、別のEA、またはどこからでも取引する準備ができました。...ロボットが取引を管理できるようにします。
この強力なEAは、事前設定のルールと設定に基づいて、すべてまたは特定の取引を自動的に管理するのに役立ちます
セットアップして実行すると、注文を監視する必要がなくなります。ソフトウェアは定義済みのルールで注文を監視および制御します
デスクトップMT4またはモバイルアプリケーションから取引するか、別のEAの取引を管理できます。
マルチプロテクションとトレーリング戦略をサポートするように設計されています。損益分岐点による保護、パーセンテージによる保護、ピップによる保護、ア

Kono robotto wa idō heikin no kōsa de dōsa shimasu. Idō heikin wa kihontekini torendo o tsuiseki suru tame ni shiyō sa remasu. Idō heikin o kōsa sa seru senryaku wa, ōkina tsuyoki oyobi yowaki no ugoki o riyō suru koto o omona mokuteki to shite imasu. Subete no paramēta wa henshū kanōde tsukai yasuku, koreha jikken-tekina purojekutodesu. Kono robotto o shiyō shite chōsa o jisshi shi, mitsuketa sairyō no jōhō o watashitachi to kyōyū shite kudasai Aurélio Machado.
FREE

EQUITY PROTECTION EA -MT5- 大きな損失を避け、アカウントを保護します
一般的な機能: 取引セッションの結果を完全に制御。 すべての外国為替記号、指数、金属、株式などの全体的な結果を制御します。制御はグローバル株式に対して行われます。 利益率または損失率に達したときに、すべてのシンボルのすべての取引を閉じます。 量とパーセンテージの両方で変更可能な構成。 トレーリングストップグローバルによる結果の保護。 セッションで達成された結果の記録(より高い資本とより低い資本)。 すべての計算はログイン時に常に貸借対照表で実行されるため、取引のクローズまたはオープンには影響しません。 新機能! テイクプロフィットまたはストップロスがトリガーされたときにプラットフォームを自動的に閉じるオプション- 通知機能:TP / SLレベルがトリガーされたときにレポートを電話に送信するオプション(プッシュ通知)または電子メール。 TP / SLがトリガーされたときに保留中の注文を削除するオプション。 TP / SLがトリガーされたときにスクリーンショットを撮ってファイルに保存するオプ

Description The indicator uses market profile theory to show the most relevant trading zones, on a daily basis. The zones to be shown are LVN (low volume nodes) and POC (point of control). An LVN zone is one which represents price areas with the least time or volume throughout the day. Typically, these areas indicate a supply or demand initiative, and in the future, they can turn into important breakout or retracement zones. A POC zone is one which represents price areas with the most time or vo

Want to make the graph cleaner?
Don't you use the opening price in your analysis?
Want to use a chart model that was used by Richard Wyckoff?
Then you need to know the Color HLC Candles and Bars indicator. In the same indicator you can switch to the display of candles or bars.
Take a look at the other volume indicators to complement your operating. And don't forget to look at the best Vwap Custom (Midas)!
Leave your comment!
Success and good trades!

The Martinware Volume indicator plots a colored moving average over volume bars. The coloring uses three colors and can be done in different ways choosable by the user and is applied both to the average as to the volume bars.
Three types of coloring are possible: None: no coloring is done Increasing or decreasing: changes the color depending on the current value being bigger or lesser than the previous one Volume relative to average: colors vary if the current volume is bigger or lesser then
FREE

Description
Reverse Rayer is an indicator that draws rays on inclined trend levels.
Recommendations
You can use this indicator to determine the trend and, accordingly, to determine the direction of opening a position or closing an opposite position.
Parameters
===== _INDICATOR_SETTINGS_ ===== - indicator settings Maximum History Bars - maximum number of history bars for calculating the indicator. Average True Range Period - ATR indicator period (used to calculate the difference be
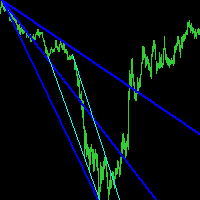
Description
Reverse Rayer Pro is an indicator that draws rays on inclined trend levels.
Recommendations
You can use this indicator to determine the trend and, accordingly, to determine the direction of opening a position or closing an opposite position.
Parameters
===== _INDICATOR_SETTINGS_ ===== - indicator settings Maximum History Bars - maximum number of history bars for calculating the indicator. Average True Range Period - ATR indicator period (used to calculate the differenc
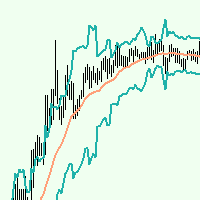
Ara Channel это канальный индикатор призван помогать определять вероятные точки разворота цены. Будет полезен трейдерам торгующим как в тренд так и в контртренд. Сигналы индикатора могут служить как полностью самостоятельными для торговли , так и как дополнительными , подтверждающими. Индикатор имеет всего две настройки: Period_MA это обычная скользящая средняя рекомендуемые значения от 8 до 480, Period_Channel это период для расчёта границ динамического канала. Преимущества : не перерисовывает

Tool that allows viewing candles in multiple timeframes. This way, it helps the analysis in multiple timeframes.
This is another product developed by Renato Fiche Junior and available to all MetaTrader 5 users!
Input Parameters
- Option 1 - TimeFrame: Standard MT5 timeframe - Option 2 - Custom TimeFrame (in minutes): Or, if this value is different from zero, the timeframe will be customized. This allows you to choose timeframe other than the MT5 standard. - Total Candles: Number of candle

The EA uses a trending strategy based on numerous technical indicators "Moving Average" on the timeframe: M4, M5, M6, M10, M12, M15, M20, M30, H1. The Expert Advisor uses elements from strategies such as Martingale, Grid and Averaging. In trading, up to 3 orders can be opened simultaneously on each of the currency pairs. The EA uses a partial order closing algorithm and hidden Stop Loss, Take Profit, Break Even and Trailing Stop. A multi-currency adviser trades in 17 currency pairs. EA uses time

GALAXY it is a Secure Automated Software for trade Forex market and indices. Architecture is a Fully Automatic Autonomous Robot Expert capable
Independently analyzing the market and making trading decisions
GALAXY It is an advanced trading system. This is a fully automatic Expert Advisor.
NO INPUT TO SELECT FOR THE TRADER ALL AUTOMATED
THIS SYSTEM IS ALWAIS IN THE MARKET IN THE TWO DIRECCTION MAKE WINING CYCLES
GALAXY . It is a 100% automatic system, the system controls
Our Moving Average Crossover EA offers a unique and complete 100% automated trading solution with over 34 different types of Moving Average calculations to choose from! Yes, that right 34! See the list at the bottom of the description! So many great features! Position Sizing & Money Management - Position sizes are either fixed or calculated dynamically based on percentage of Capital available divided by pip count or ATR multiplier. Stop Loss, Target Profit, Trailing Stop & Partial Position Closi

Description :
Combination MT5 is a professional indicator based on the Stochastic Oscillator and Average True Range (ATR) technical indicators, thus, you can use it with any currency pair and any timeframe.Trade signals from Combination MT5 are drawn on the main chart in the form of arrows. When a blue arrow appears, then this is a signal to buy, when the red one appears then this is a signal to sell. You can set the alerts on/off. The Stochastic Oscillator and Average True Range (ATR) technic
FREE

Tired of losing FIMATHE entries?
Tired of spending hours in front of the screen waiting for the right time to enter on a trade?
EA VALHALLA was made for you!
With simple configuration this EA will help you don't lose more entries!
The Expert Advisor has all the necessary resources to help you with risk management.
With a robust language and focused on MQL5, which is more complete and secure than MQL4.
Download and test in DEMO account right now!
https://bit.ly/3fO07eA Benefits:

The Glider indicator gives accurate and timely signals to enter and exit the transaction that appear on the current candle. Using the indicator is very simple. When a dot and a blue line appear, open a buy deal. When a dot and a red line appear, open a sell deal.
The main purpose of this indicator is to determine the moments of entry and exit from transactions, therefore the Glider indicator will display only the trend line and entry points, i.e. displays displays the entry points to the mark

1. Development background Forex is a ratio, different from futures and the stocks. For example, if EURUSD has risen, it may be that EUR is falling and USDX has fallen even more. I believe everyone knows that the US dollar index is an essential reference index in forex analysis . In MT5 client, it is very valuable to see the US dollar index. Similarly, if you can see the index of other forex in the MT5 client, which is very valuable for trading. Because the US dollar index is very authoritat

Delta Single Volume is a very powerful indicator that reads the supply on the Market.
It calculates the Delta from movement of the price and the difference of BUY and SELL volumes. Its special structure allows you to get all timeframe values available on the MT5 platform. It works on Tick Volumes and Real Volumes (if avalaibles on your Broker). A good observation of this instrument can suggest great entry points and possible reversal. We are confident that this tool will help you to improve yo

Эта панель предназначена для быстрого визуального поиска паттернов "price action" по нескольким торговым инструментам одновременно. Есть возможность добавлять и удалять торговые инструменты. По клику на сигнальную кнопку осуществляется быстрый переход на график с данным паттерном и таймфреймом. Панель ищет 8 свечных паттернов: PIN-BAR, EXTERNAL BAR, INSIDE BAR, DOJI, LEVEL, HIGH/LOW OF N BAR, FAKEY, ONE-WAY N BAR. Отключение любого из паттернов осуществляется кликом по его заголовку. Также имеет

For those who love to follow Volume behavior here it is a little indicator that could be used as a replacement for the old and standard MT5 built-in volume indicator. The trick here is that this indicator paints the volume histogram based on the direction of the candle giving to the trader a quick "Heads Up" on what is happening, visually! It could be used to study and see for instance, the volume and past bars volume during (or, reaching) a peak (Tops and Bottoms). UP candles are shown in pale
FREE
More stable MetaTrader 4 version is available here: Lot Calculator Tool . This tool helps you to automatically calculate and manage risk, conveniently place orders visually, schedule orders, trail stops, move them to break-even and more.
Features Place market or pending orders using draggable lines Schedule orders Calculate and limit risk using various methods See current spread See time till next candle Set custom order comments Trail stops Move stops to break-even See order profit/loss in

This Indicator draws Fibonacci Fan levels in two different ways. You can select whether to draw Fibonacci Fan levels based on your favourite ZigZag settings or you can let the indicator to draw Fan levels based on given number of bars or candles. You can also set Mobile and Email notification for your favourite Fan levels individually. With this indicator you will not have to feel lonely as the it can generate Voice alerts, which will keep you focused on your trading and remove boredom. Prod

This Indicator draws Fibonacci Arc levels in two different ways. You can select whether to draw Fibonacci Arc levels based on your favourite ZigZag settings or you can let the indicator to draw Arc levels based on given number of bars or candles. You can also set Mobile and Email notification for your favourite Arc levels individually. With this indicator you will not have to feel lonely as the it can generate Voice alerts, which will keep you focused on your trading and remove boredom. Produc

Extensiver is designed to trade any markets (Stocks, Forex, Commodities, Futures, Cryptos). The strategies are developed based on various Price Actions that will be observed on different Fibonacci Extension Levels. Product Home Page: https://www.mql5.com/en/market/product/51242
ADVANTAGES:
Works on any market and time frames Multiple Strategies in 4 categories: Extension, Breakout, Trend Follow, Reversal Trades simultaneously on any number of markets under the same account Display Fibonac
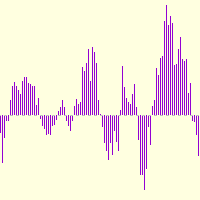
Ara metod , индикатор-осцилятор. Создан для отображения вероятных экстремумов. Представляет из себя гистограмму отображающую вероятные изменения цены. Преимущества , не перерисовывается, прост в настройках. Будет полезен как основной инструмент для поиска сигналов для входа, так и как дополнительный инструмент подтверждения точек входа. Из настроек только один параметр Reg_Period , допустимые значения от 10 до 1000, рекомендованные 120-480 .
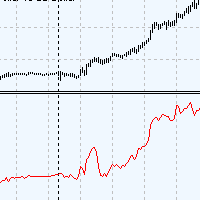
Ara volatility - это индикатор волатильности, показывает силу трендового движения. Удобен в использовании. Не перерисовывается. Для расчёта индикатора была применена авторская разработка. Индикатор будет вам очень полезен как самостоятельный инструмент показывающий периоды тренда или затишья. Также индикатор может служить как дополнительный фильтр к вашей торговой системе. Ara volatility очень прост в настройках, всего один параметр Period Volatility . Рекомендуемые значения от 24 до 1000.

FanTrader is designed to trade any markets (Stocks, Forex, Commodities, Futures, Cryptos). The strategies are developed based on various Price Actions that will be observed on different Fibonacci Fan Levels. Product Home Page: https://www.mql5.com/en/market/product/51333
ADVANTAGES:
Works on any market and time frames Multiple Strategies in 4 categories: Retracement, Breakout, Trend Follow, Reversal Trades simultaneously on any number of markets under the same account Display Fibonacci Fa

ArcTrader is designed to trade any markets (Stocks, Forex, Commodities, Futures, Cryptos). The strategies are developed based on various Price Actions that will be observed on different Fibonacci Arc Levels. Product Home Page: https://www.mql5.com/en/market/product/51336
ADVANTAGES:
Works on any market and time frames Multiple Strategies in 4 categories: Retracement, Breakout, Trend Follow, Reversal Trades simultaneously on any number of markets under the same account Display Fibonacci Ar

Tortoise Scalper is an Expert Advisor for trading on Forex markets using MT 5 platform. This scalper is useful for day traders. This is slow and steady strategy, which helps you to win the race like tortoise .... regular small profits with calculated draw downs … It will keep you always on the winning side at the end of the race, just like tortoise… We made this scalper with the belief that, for day trading most recent data should be used for analysis and to create a trading system. So, we made

This EA includes 11 SmartForexExpert EAs. These EAs belong to 3 different area types, momentum, reversal, trend. Using all EAs we can diversify risk and trade better and take advantage of different market behaviors where specific type of EA works better than others. Version 3.0 on MT5 include SFE Crypto Master!
A big effort has made to include the different EAs in 1 mt5 file, and keeping the low demand of the computer resources. The EA runs very smoothly and only take care of his own trades,

このエキスパートアドバイザーは、長年の開発の結果です。私は主にグリッドとヘッジ戦略を専門としており、このエキスパートアドバイザーですべての経験と知識を移転しました。その結果、高度にカスタマイズ可能なExpert Advisorテンプレートと、トレーダーが選択できるいくつかの優れた戦略があります。取引戦略は常に追加され、Expert Advisorは関連性を維持し、10年後もトップになります。つまり、この製品を購入することで、継続的なサポートと最新の更新を備えた、柔軟にカスタマイズ可能なExpertAdvisorを入手できます。あなたの戦略と願いは改訂で使用することができます。
EAは市場と保留中の注文を取引します。ストップロス、テイクプロフィット、トレーリングストップは取引を成立させるために使用されます。これらは、単方向または双方向の注文のバスケットに対して、注文ごとに個別に使用できます。注文のグリッドは、固定または拡大するステップとポジションのボリュームのいずれかを使用できます。貿易統計がチャートに表示されます。
ストップロス、テイクプロフィット、トレーリングストップはリア

私に書いてください、そして私はあなたに暗号、株式USA、株価指数、金のためのスーパーボット戦略を送ります。購入前にテストできます。 497ドルで生涯ライセンスを購入した後、私にプライベートメッセージを送ってください。オンラインコースにアクセスできます:「スーパーボット:Metatrader 5内でアルゴリズム取引戦略を高速かつコード行なしで作成する方法」(すべてのコース情報は英語で表示されます)。 スーパーボットを使用した信号のカップル: https://www.mql5.com/en/signals/1414140 https://www.mql5.com/en/signals/1529750
Superbotを使用すると、Metatrader5をソフトウェアパッケージに変換して、モスクワ証券取引所とシカゴ証券取引所のデリバティブおよび株式市場でトレンドおよびリバーストレーディングシステムを作成およびテストできます。 5つのモードがあります。 コンストラクター:使用可能なブロックから戦略を手動でアセンブルします。 ジェネレーター:遺伝的最適化を使用して、取引システムを自動的に生成

Multicurrency and multitimeframe modification of the indicator Bollinger Bands. On the dashboard you can see breakouts and touches of the Bollinger Bands. In the parameters you can specify any desired currencies and timeframes. The indicator can also send notifications when the price touches the Bollinger Bands, when the current volatility changes (expands or falls), and when the price touches all the bands. By clicking on a cell with a period, this symbol and period will be opened. This is MTF

New candlestick alert, the alert appears according to the timeframe it is placed on. The indicator works on any asset, the alert can be silenced at any time, without the need to remove the indicator from the graph. It's great for those who can't keep an eye on the chart all the time. You can use this tool at work, college or anywhere else. It is also possible to receive signals directly on your cell phone by connecting to the metatrader. Aurélio Machado.
FREE

The Martinware Closing Time Alarm indicator serves to warn traders that the current period (bar, candle) is about to end.
Input parameters: Time offset: with how many seconds before the ending of the current period the alarm must trigger
Alert with sound: informs if the alert should include playing a sound
Sound selection: a list of sounds available
Custom sound: name of the custom sound file to be used in case "custom sound" was selected. It must be inside a folder named "Sounds", this o
FREE
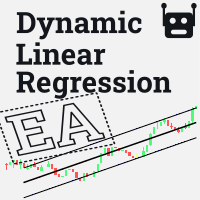
The Expert Advisor (EA) is based on the Dynamic Linear Regression indicator ( https://www.mql5.com/en/market/product/49702 ).
User inputs: Number of candles is considered when calculating linear regression; Distance to the top line; Distance to the bottom line; Stop the loss of. The EA executes purchase and sale orders in the market when the value of a line, higher or lower, is reached at the current price, when the lower line is reached, a buy order at market is executed and when the upper l
FREE

The principle of this indicator is very simple: detecting the trend with Moving Average, then monitoring the return point of graph by using the crossing of Stochastic Oscillator and finally predicting BUY and SELL signal with arrows, alerts and notifications. The parameters are fixed and automatically calculated on each time frame. Example: If you install indicator on EURUSD, timeframe M5: the indicator will detect the main trend with the Moving Average on this timeframe (for example the Moving

Lock is a powerful tool for saving a trader’s money. Instead of the traditional stop loss, you can now use this robot. The robot will set the pending lock. With a sharp movement of the price against the trader, the lock becomes market, and therefore the loss does not increase. The main position is maintained and will bring profit as soon as the robot selects the right moment to unlock. The robot can be used to insure positions during manual trading, or as an addition to another robot.
Princip

Do you want to see the most relevant supports and resistances at a glance? Tired of tracing the levels by hand? Multi Levels Detector is an indicator for MetaTrader that will draw supports and resistances according to the parameters entered, and also offers the possibility of executing an alert every time the price reaches any of its levels.
SETTINGS UsePercentage: Allows you to configure whether the distances between levels will be measured in points, or by a percentage of the asset.
TimeFr
FREE

Relative Strength Ratio (RSR)
The Relative Strength Ratio (RSR) indicator compares the performance of one security against another, dividing the base security by the comparative security, and showing the ratio of this division in a line c hart. This indicator is also known as the Relative Strength indicator, Price Relative , or Relative Strength Comparative .
It is one of the main tools for Intermarket Analysis professionals, to help them identify Sector Rotations and other global relations

Display the date, time and price according to the movement of the mouse cursor on the chart This is useful for discretionary trading.
It is an indispensable tool for verifying and studying past market prices and trades. Large and easy-to-read characters It is easy to see even if your eyesight is weak.
Also, you can tell the date and price to YouTube and webinar viewers in an easy-to-understand manner. Characteristic Date,Time and Price are displayed. The value follows the movement of the mous

Buy and sell signals based on Larry Williams's exponential moving average strategy 9.1 for trend reversals.
How does it work? The indicator activates the buy and sell signal when a candle closes turning the 9 period EMA.
How to use it? One way of using it, proposed by Larry Williams, is to enter a trade with a buy stop order one tick above the high of the candle with the buy signal, placing the stop loss order one tick below the candle's low. When there's a sell signal instead, place a sell

This indicator is especially for the binary trading. Time frame is 1 minutes and exp time 5 or 3 minutes only. You must be use martingale 3 step. So you must put lots size is 10 % at most. You should use Mt2 trading platform to connect with my indicator to get more signal without human working. This indicator wining rate is over 80% but you may get 100% of profit by using martingale 3 step. You should use MT2 Trading Platform to connect meta trader platform and binary platform . You can get mt2
FREE
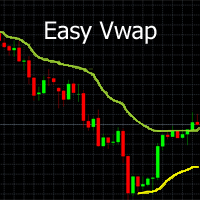
With a single mouse click you can add the indicator Vwap V2 (free download available) to the graph. The indicator Vwap V2 has been extended with a cyclic Vwap indicator. With the cyclic Vwap indicator it is possible to reset the Vwap after a predetermined number of bars. e.g. the CAC 40 index, after 14 (closing - opening: 23-9 = 14) measures, a new day starts and the Vwap is automatically reset with a new time. Or in a graph of 5 minutes, 60/5 = 12, the Vwap will reset the time parameter every h

Простая утилита, которая показывает на какую сумму средств куплено активов в портфеле. Необходима для отслеживания загрузки депозита. Выводит информацию в удобную надпись, которую можно разместить в любом месте графика. Учитывает валюту депозита: USD или RUB Учитывает, в какой валюте торгуется актив (USD или RUB) и автоматически конвертирует по текущему курсу. Можно настроить размер и цвет надписи
FREE

The indicator shows buy and sell signals. The " CounterTrend 5 " is designed to recognize profitable counter trend patterns from your chart. Features: The CounterTrend 5 is a Counter-Trend Trading with Simple Range Exhaustion System. Signals based on the daily trading range. The indicator calculates the trading range for the last few days and compare the price movements on short time intervals and generating short term reversal points. This is a leading indicator. It works on any instruments.

を読むことをお勧めします 製品のブログ (マニュアル) 最初から最後まで EA が提供するものは最初から明らかです。 このエキスパートアドバイザー (EA) の主な戦略は、3 つの移動平均 (MA) が連続して整列し、互いに一定の距離にある場合に取引を行うことです (たとえば、一部の機関投資家が使用するあまり知られていない戦略に使用できます)。 、これには D1 時間枠の MA 10、20、および 30 が含まれます)。 EA は、H1 以降の時間枠で最適に機能します。トリプル MA 戦略 (使用される MA: に関係なく) は、長期的な戦略と見なす必要があります。悪い月が続くかもしれません。したがって、この EA は、頻繁な取引と短期的な一定の利益を求めるトレーダー向けではありません。デフォルト設定は EURUSD H1 用に最適化されています (2015.01.01 から 2022.12.29 までのバックテスト、224 回の取引、つまり週平均 0.52 回の取引)。 ここで 信号を監視します (D1 時間枠に異なる設定を使用)。 また、2 MA:s の通常の


粗化されたフラクタルに基づく回帰チャネル。
パラメータ:
期間の再計算-インジケータ計算期間
スイッチゼロ(最後の)バー-最後に開いているバーを数えますか?
チャネルに対する丸め価格の位置を変更するときにプッシュ通知を切り替えます
ラインリスク-リスクラインの表示
Coeff Risk,%-トランザクションの最大割合をパーセンテージとして表します
このチャネルでは、市場における傾向とその強さを評価し、必要なリスクを伴う取引の要求を正しく行うことができます。
基本的な分析を考慮して、より高い時間枠のチャートで取引することをお勧めします。
取引のための可能な信号:1. チャンネル境界吹き出物
2. チャネル境界からのリバウンド
3. チャネルトレンド別

Description
ABC Trend Levels is an indicator that identifies market trends and important trend support and resistance levels.
Recommendations
You can use this indicator to determine the trend and, accordingly, to determine the direction of opening a position or closing an opposite position.
Parameters
===== _INDICATOR_SETTINGS_ ===== - indicator settings Maximum History Bars - maximum number of history bars for calculating the indicator. Average True Range Period - ATR indicator p
Description
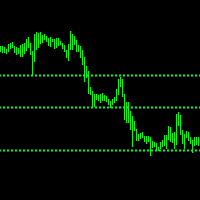
ABC Trend Levels Pro is an indicator that identifies market trends and important trend support and resistance levels.
Recommendations
You can use this indicator to determine the trend and, accordingly, to determine the direction of opening a position or closing an opposite position.
Parameters
===== _INDICATOR_SETTINGS_ ===== - indicator settings Maximum History Bars - maximum number of history bars for calculating the indicator. Average True Range Period - ATR indicat

The principle of this indicator is very simple: detecting the trend with Moving Average, then monitoring the return point of graph by using the crossing of Stochastic Oscillator and finally predicting BUY and SELL signal with arrows, alerts and notifications. The parameters are fixed and automatically calculated on each time frame. Example: If you install indicator on EURUSD, timeframe M5: the indicator will detect the main trend with the Moving Average on this timeframe (for example the Moving
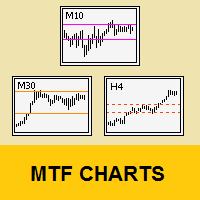
Tool that allows viewing more than one timetime in the same window (up to 3 timeframes). Then, the tool helps the analysis in multiple timesframes.
This is another product developed by Renato Fiche Junior and available to all MetaTrader 5 users!
Input Parameters
- Timeframes 1, 2 and 3: Timeframes of sub-charts
- Show Dates: Shows the dates on the sub-charts on the X-axis (Yes / No)
- Show Prices: Shows on the Y-axis the prices in the sub-charts (Yes / No)
- Show Subwindow: Sh
FREE

The principle of this indicator is very simple: detecting the trend with Moving Average, then monitoring the return point of graph by using the crossing of Stochastic Oscillator and finally predicting BUY and SELL signal with arrows, alerts and notifications. The parameters are fixed and automatically calculated on each time frame. Example: If you install indicator on EURUSD, timeframe M5: the indicator will detect the main trend with the Moving Average on this timeframe (for example the Moving

ONLY 10 COPIES AT $199! After that, the price will return to $499 How to run backtest: https://www.youtube.com/watch?v=D8NGbHGp1-k I recommend SETUP 1 to anyone starting out. To run the backtest correctly, download the set's on our drive: https://drive.google.com/drive/folders/1yFz4tJbJwl71_T3YU7f8fqHBoq0aYMsi?usp=sharing The expert DSC PRICE ACTION EURUSD was created for the EURUSD asset in the M5 time under Hedge account. It´s a Expert to leverage the account quickly. It is a high hit rate an

Halley´s comet it is a Secure Automated Software for trade Forex market and indices.
The architecture is a Fully Automatic Autonomous Robot Expert capable of
Independently analyzing the market and making trading decisions
Halley´s comet It is an advanced trading system. This is a fully automatic Expert Advisor.
Halley´s comet . It is a 100% automatic system, The system is self-sufficient, performing all the work. Is a revolution in the customization of the tra

Script to load history of a symbol on determined timeframe (default M1).
It is extracted from the MQL5 documentation:
https://www.mql5.com/en/docs/series/timeseries_access
Adapted by Renato Fiche Junior #melhoresferramentas #renato #larissasihle #aguiatraders
Parâmetros de Entrada
- Start datetime : the initial datetime from the history will be loaded - Timeframe to be loaded: period that will be loaded
FREE

Classical ADX revamped to provide faster and more solid trading signals. This indicator calculates ADX values using standard formulae, but excludes operation of taking the module of ADX values, which is forcedly added into ADX for some reason. In other words, the indicator preserves natural signs of ADX values, which makes it more consistent, easy to use, and gives signals earlier than standard ADX. Strictly speaking, any conversion to an absolute value destroys a part of information, and it mak

AnaliTickDemo is a demo version of AnaliTick. AnaliTIck is a financial instrument analysis and testing program based on the Metatrader5 platform. The object of analysis is the sequence of changes in the prices of Bid and Ask - ticks. The program may be useful to developers of scalping advisers and strategies, those who work on the news. The demo version differs from the full one in fewer filters and strategies. The analyzed period is one - the current trading day and two previous days. The strat
FREE
MetaTraderマーケットはMetaTraderプラットフォームのためのアプリを購入するための便利で安全な場所を提供します。エキスパートアドバイザーとインディケータをストラテジーテスターの中でテストするためにターミナルから無料のデモバージョンをダウンロードしてください。
パフォーマンスをモニターするためにいろいろなモードでアプリをテストし、MQL5.community支払いシステムを使ってお望みのプロダクトの支払いをしてください。
取引の機会を逃しています。
- 無料取引アプリ
- 8千を超えるシグナルをコピー
- 金融ニュースで金融マーケットを探索
新規登録
ログイン