YouTubeにあるマーケットチュートリアルビデオをご覧ください
ロボットや指標を購入する
仮想ホスティングで
EAを実行
EAを実行
ロボットや指標を購入前にテストする
マーケットで収入を得る
販売のためにプロダクトをプレゼンテーションする方法
MetaTrader 5のための新しいエキスパートアドバイザーとインディケータ - 145
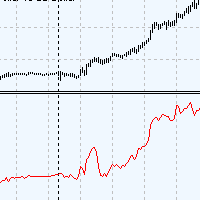
Ara volatility - это индикатор волатильности, показывает силу трендового движения. Удобен в использовании. Не перерисовывается. Для расчёта индикатора была применена авторская разработка. Индикатор будет вам очень полезен как самостоятельный инструмент показывающий периоды тренда или затишья. Также индикатор может служить как дополнительный фильтр к вашей торговой системе. Ara volatility очень прост в настройках, всего один параметр Period Volatility . Рекомендуемые значения от 24 до 1000.

FanTrader is designed to trade any markets (Stocks, Forex, Commodities, Futures, Cryptos). The strategies are developed based on various Price Actions that will be observed on different Fibonacci Fan Levels. Product Home Page: https://www.mql5.com/en/market/product/51333
ADVANTAGES:
Works on any market and time frames Multiple Strategies in 4 categories: Retracement, Breakout, Trend Follow, Reversal Trades simultaneously on any number of markets under the same account Display Fibonacci Fa

Tortoise Scalper is an Expert Advisor for trading on Forex markets using MT 5 platform. This scalper is useful for day traders. This is slow and steady strategy, which helps you to win the race like tortoise .... regular small profits with calculated draw downs … It will keep you always on the winning side at the end of the race, just like tortoise… We made this scalper with the belief that, for day trading most recent data should be used for analysis and to create a trading system. So, we made

Multicurrency and multitimeframe modification of the indicator Bollinger Bands. On the dashboard you can see breakouts and touches of the Bollinger Bands. In the parameters you can specify any desired currencies and timeframes. The indicator can also send notifications when the price touches the Bollinger Bands, when the current volatility changes (expands or falls), and when the price touches all the bands. By clicking on a cell with a period, this symbol and period will be opened. This is MTF

このエキスパートアドバイザーは、長年の開発の結果です。私は主にグリッドとヘッジ戦略を専門としており、このエキスパートアドバイザーですべての経験と知識を移転しました。その結果、高度にカスタマイズ可能なExpert Advisorテンプレートと、トレーダーが選択できるいくつかの優れた戦略があります。取引戦略は常に追加され、Expert Advisorは関連性を維持し、10年後もトップになります。つまり、この製品を購入することで、継続的なサポートと最新の更新を備えた、柔軟にカスタマイズ可能なExpertAdvisorを入手できます。あなたの戦略と願いは改訂で使用することができます。
EAは市場と保留中の注文を取引します。ストップロス、テイクプロフィット、トレーリングストップは取引を成立させるために使用されます。これらは、単方向または双方向の注文のバスケットに対して、注文ごとに個別に使用できます。注文のグリッドは、固定または拡大するステップとポジションのボリュームのいずれかを使用できます。貿易統計がチャートに表示されます。
ストップロス、テイクプロフィット、トレーリングストップはリア


This EA includes 11 SmartForexExpert EAs. These EAs belong to 3 different area types, momentum, reversal, trend. Using all EAs we can diversify risk and trade better and take advantage of different market behaviors where specific type of EA works better than others. Version 3.0 on MT5 include SFE Crypto Master!
A big effort has made to include the different EAs in 1 mt5 file, and keeping the low demand of the computer resources. The EA runs very smoothly and only take care of his own trades,
The Expert Advisor (EA) is based on the Dynamic Linear Regression indicator ( https://www.mql5.com/en/market/product/49702 ).
User inputs: Number of candles is considered when calculating linear regression; Distance to the top line; Distance to the bottom line; Stop the loss of. The EA executes purchase and sale orders in the market when the value of a line, higher or lower, is reached at the current price, when the lower line is reached, a buy order at market is executed and when the upper l
FREE
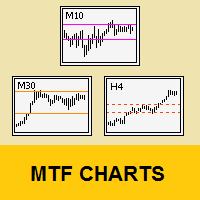
Tool that allows viewing more than one timetime in the same window (up to 3 timeframes). Then, the tool helps the analysis in multiple timesframes.
This is another product developed by Renato Fiche Junior and available to all MetaTrader 5 users!
Input Parameters
- Timeframes 1, 2 and 3: Timeframes of sub-charts
- Show Dates: Shows the dates on the sub-charts on the X-axis (Yes / No)
- Show Prices: Shows on the Y-axis the prices in the sub-charts (Yes / No)
- Show Subwindow: Sh
FREE

ONLY 10 COPIES AT $199! After that, the price will return to $499 How to run backtest: https://www.youtube.com/watch?v=D8NGbHGp1-k I recommend SETUP 1 to anyone starting out. To run the backtest correctly, download the set's on our drive: https://drive.google.com/drive/folders/1yFz4tJbJwl71_T3YU7f8fqHBoq0aYMsi?usp=sharing The expert DSC PRICE ACTION EURUSD was created for the EURUSD asset in the M5 time under Hedge account. It´s a Expert to leverage the account quickly. It is a high hit rate an

Classical ADX revamped to provide faster and more solid trading signals. This indicator calculates ADX values using standard formulae, but excludes operation of taking the module of ADX values, which is forcedly added into ADX for some reason. In other words, the indicator preserves natural signs of ADX values, which makes it more consistent, easy to use, and gives signals earlier than standard ADX. Strictly speaking, any conversion to an absolute value destroys a part of information, and it mak

Relative Strength Ratio (RSR)
The Relative Strength Ratio (RSR) indicator compares the performance of one security against another, dividing the base security by the comparative security, and showing the ratio of this division in a line c hart. This indicator is also known as the Relative Strength indicator, Price Relative , or Relative Strength Comparative .
It is one of the main tools for Intermarket Analysis professionals, to help them identify Sector Rotations and other global relations

The Decision indicator determines the long-term and short-term trend. The indicator allows you to examine in more detail the real and historical market trends! Shows the opening points of transactions for sale or purchase, and also indicates the direction of the trend for: short-term and long-term periods. The analysis is based on the selected timeframe.
The indicator not only signals an immediate purchase or sale. It indicates a short-term and long-term trend. operations. The easiest way to

Display the date, time and price according to the movement of the mouse cursor on the chart This is useful for discretionary trading.
It is an indispensable tool for verifying and studying past market prices and trades. Large and easy-to-read characters It is easy to see even if your eyesight is weak.
Also, you can tell the date and price to YouTube and webinar viewers in an easy-to-understand manner. Characteristic Date,Time and Price are displayed. The value follows the movement of the mous

Buy and sell signals based on Larry Williams's exponential moving average strategy 9.1 for trend reversals.
How does it work? The indicator activates the buy and sell signal when a candle closes turning the 9 period EMA.
How to use it? One way of using it, proposed by Larry Williams, is to enter a trade with a buy stop order one tick above the high of the candle with the buy signal, placing the stop loss order one tick below the candle's low. When there's a sell signal instead, place a sell
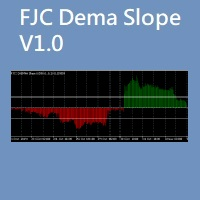
FJC Dema Slope indicator helps finding and meassuring trend force better than Ema or Dema Alone. You can set levels for filtering low force trends and for detecting exit trade point when the trend force is reducing. Bullish trend shows in green color and Bearish trend in red. It can be use for manual trading but you can also use it when programming EAs, this is an example of use: demaSlopeHandle[i]=iCustom(NULL,PERIOD_CURRENT,"::Indicators\\FJC_DEMA_SLOPE.ex5", 500, PRICE_CLOSE, 0.0,1);

This indicator is especially for the binary trading. Time frame is 1 minutes and exp time 5 or 3 minutes only. You must be use martingale 3 step. So you must put lots size is 10 % at most. You should use Mt2 trading platform to connect with my indicator to get more signal without human working. This indicator wining rate is over 80% but you may get 100% of profit by using martingale 3 step. You should use MT2 Trading Platform to connect meta trader platform and binary platform . You can get mt2
FREE

The indicator shows buy and sell signals. The " CounterTrend 5 " is designed to recognize profitable counter trend patterns from your chart. Features: The CounterTrend 5 is a Counter-Trend Trading with Simple Range Exhaustion System. Signals based on the daily trading range. The indicator calculates the trading range for the last few days and compare the price movements on short time intervals and generating short term reversal points. This is a leading indicator. It works on any instruments.

En base a cálculos matemáticos de determino una linea Horizontal que cruza a todas las señales de trading, mostrando los máximos y mínimos. La linea horizontal parte en dos las subidas y bajadas de las señales de trading, de tan manera que es fácil identificar los máximos y mínimos, y es inteligente por que es sensible a las subidas y bajadas, afín de no quedarse en un solo lado por siempre, trabaja excelentemente con otros indicadores suavizadores ya que les garantiza que en un intervalo de tie

Features
With MT5 to Interactive Brokers(IB) Trader, you can:
1. Load chart data from IB to MT5, and Analyze with all standard or customer Indicators.
2. Place Orders to IB Account Directly in MT5.
3. Make your Own EAs upon IB Securities by only making minus changes of the trading function. Usage
1) Installation
Copy the "Mt5ToIBTraderEn.ex4" and sample files to [MT5 Data Folder]->MQL5->Experts.
2) MT5 Settings
Add the IP Address to the MT5 Allowed URLs in 'Tools->Options->Exper

を読むことをお勧めします 製品のブログ (マニュアル) 最初から最後まで EA が提供するものは最初から明らかです。 このエキスパートアドバイザー (EA) の主な戦略は、3 つの移動平均 (MA) が連続して整列し、互いに一定の距離にある場合に取引を行うことです (たとえば、一部の機関投資家が使用するあまり知られていない戦略に使用できます)。 、これには D1 時間枠の MA 10、20、および 30 が含まれます)。 EA は、H1 以降の時間枠で最適に機能します。トリプル MA 戦略 (使用される MA: に関係なく) は、長期的な戦略と見なす必要があります。悪い月が続くかもしれません。したがって、この EA は、頻繁な取引と短期的な一定の利益を求めるトレーダー向けではありません。デフォルト設定は EURUSD H1 用に最適化されています (2015.01.01 から 2022.12.29 までのバックテスト、224 回の取引、つまり週平均 0.52 回の取引)。 ここで 信号を監視します (D1 時間枠に異なる設定を使用)。 また、2 MA:s の通常の

粗化されたフラクタルに基づく回帰チャネル。
パラメータ:
期間の再計算-インジケータ計算期間
スイッチゼロ(最後の)バー-最後に開いているバーを数えますか?
チャネルに対する丸め価格の位置を変更するときにプッシュ通知を切り替えます
ラインリスク-リスクラインの表示
Coeff Risk,%-トランザクションの最大割合をパーセンテージとして表します
このチャネルでは、市場における傾向とその強さを評価し、必要なリスクを伴う取引の要求を正しく行うことができます。
基本的な分析を考慮して、より高い時間枠のチャートで取引することをお勧めします。
取引のための可能な信号:1. チャンネル境界吹き出物
2. チャネル境界からのリバウンド
3. チャネルトレンド別

Description
ABC Trend Levels is an indicator that identifies market trends and important trend support and resistance levels.
Recommendations
You can use this indicator to determine the trend and, accordingly, to determine the direction of opening a position or closing an opposite position.
Parameters
===== _INDICATOR_SETTINGS_ ===== - indicator settings Maximum History Bars - maximum number of history bars for calculating the indicator. Average True Range Period - ATR indicator p
Description
ABC Trend Levels Pro is an indicator that identifies market trends and important trend support and resistance levels.
Recommendations
You can use this indicator to determine the trend and, accordingly, to determine the direction of opening a position or closing an opposite position.
Parameters
===== _INDICATOR_SETTINGS_ ===== - indicator settings Maximum History Bars - maximum number of history bars for calculating the indicator. Average True Range Period - ATR indicat

The principle of this indicator is very simple: detecting the trend with Moving Average, then monitoring the return point of graph by using the crossing of Stochastic Oscillator and finally predicting BUY and SELL signal with arrows, alerts and notifications. The parameters are fixed and automatically calculated on each time frame. Example: If you install indicator on EURUSD, timeframe M5: the indicator will detect the main trend with the Moving Average on this timeframe (for example the Moving
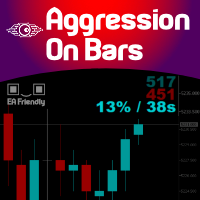
Imagine a Buy and Sell Pressure monitor on your chart that shows in REAL-TIME this data, bar by bar? Well, imagine no more. We present you an exclusive creation of Minions Labs : Aggression On Bars indicator. On every new bar on you chart this indicator will start counting in real-time the BUY/SELL pressure and present this data statistics directly inside your chart. As soon as a new bar is created in your chart, the counter restarts. Simple and effective. Just watch the video to see it running

The principle of this indicator is very simple: detecting the trend with Moving Average, then monitoring the return point of graph by using the crossing of Stochastic Oscillator and finally predicting BUY and SELL signal with arrows, alerts and notifications. The parameters are fixed and automatically calculated on each time frame. Example: If you install indicator on EURUSD, timeframe M5: the indicator will detect the main trend with the Moving Average on this timeframe (for example the Moving

Halley´s comet it is a Secure Automated Software for trade Forex market and indices.
The architecture is a Fully Automatic Autonomous Robot Expert capable of
Independently analyzing the market and making trading decisions
Halley´s comet It is an advanced trading system. This is a fully automatic Expert Advisor.
Halley´s comet . It is a 100% automatic system, The system is self-sufficient, performing all the work. Is a revolution in the customization of the tra

Script to load history of a symbol on determined timeframe (default M1).
It is extracted from the MQL5 documentation:
https://www.mql5.com/en/docs/series/timeseries_access
Adapted by Renato Fiche Junior #melhoresferramentas #renato #larissasihle #aguiatraders
Parâmetros de Entrada
- Start datetime : the initial datetime from the history will be loaded - Timeframe to be loaded: period that will be loaded
FREE

AnaliTickDemo is a demo version of AnaliTick. AnaliTIck is a financial instrument analysis and testing program based on the Metatrader5 platform. The object of analysis is the sequence of changes in the prices of Bid and Ask - ticks. The program may be useful to developers of scalping advisers and strategies, those who work on the news. The demo version differs from the full one in fewer filters and strategies. The analyzed period is one - the current trading day and two previous days. The strat
FREE

AnaliTIck is a financial instrument analysis and testing program based on the Metatrader5 platform. The object of analysis is the sequence of changes in the prices of Bid and Ask - ticks. The program may be useful to developers of scalping advisers and strategies, those who work on the news. When the program is loaded, an array of ticks for the financial instrument, on the chart of which the program is installed, is filled for the current period. The analyzed period is 4 trading days. On this pe

The FREE version works on Demo account and only CADCHF and NZDCHF pairs.
The indicator predict the future candles direction, by scanning past candle movement. Based on the principal: “ The history repeat itself”. Programmed according to Kendall Correlation. In the settings menu, different scanning options are available. When the indicator find a match, start painting future candles from the current candle to the right, also from the current candle to the left as well, showing you the candle
FREE

The indicator predict the future candles direction, by scanning past candle movement. Based on the principal: “ The history repeat itself”. Programmed according to Kendall Correlation. In the settings menu, different scanning options are available. When the indicator find a match, start painting future candles from the current candle to the right, also from the current candle to the left as well, showing you the candle pattern what the actual signal is based on. The left side candle are option

The result as the name explain, displays the result of a swing. Sometimes weis waves show a big effort, but a little result... The weis waves result is a better revelation about the volume, if united with weis waves. it is a volume indicator, but it is different from a conventional volume indicator, this indicator came from the wyckoff method, if you use the result you will have a different view of the market, regardless of which asset is operating.

Llama Crazy Pro MT5 is a trading robot for the trading on forex. This is a complete system with 11 Strategy in 1 EA . This Robot opens a large number of orders .
Important Information Revealed By purchasing this Expert Advisor you are entitled to receive a free copy of Scorpion Crazy Pro MT5 ! (All future updates included) -> To Receive it, Please Contact me by mql5 message or email !
This Expert advisor not use arbitrage or breakout, then we see an high resistance to slippage L

This EA is easy to use, it does not have too complicated settings and algorithms for performing trading operations. It’s not optimized for long, it may appeal to those who recently decided to engage in trading on the exchange with the help of advisers, or who do not want to understand the settings for a long time. The basis of his work is several indicators (moving average, RSI, stochastic, ATR). Despite its simplicity, it has a custom trailing stop function, which can reduce the risks for a dep

The presented Damon expert system works with the EURUSD currency pair and only with it. This system implemented the principle of five orders - that is, a maximum of five orders can be placed in one direction, after which the total position of the series must be closed by stops, either real or virtual. The trading system is designed to work separately with a series of buy orders and separately with a series of sell orders. which makes the trading system versatile enough. The expert passes all ty
This MQL5 Expert Advisor is an adaption of the trading strategy made famous by trading legend Larry Conners. The EA essentially buys on the dips and sells on the rises. Buy Signal
Current candle is above the 55 EMA
RSI 2 period is below 10 Sell Signal
Current candle is below the 55 EMA
RSI 2 period is above 90 This strategy has been adapted into a scalping strategy. Default settings are for EURUSD 1H time-frame 2018/01/01 - 2020/05/30
FREE

Features: The Expert Advisor pronounces current prices at a set interval. It speaks Russian and English. The file voice_dict.csv contains the rules of pronunciation (language, other rules). See an example below The Google cloud server is used for pronunciation, so the expert should be allowed to go to "https://texttospeech.googleapis.com" (see Tools\Options\Expert Advisors Allow WebRequest for...) Restrictions: Only 2 symbols
Example of a pronunciation rule (voice_dict.csv file in the Fil
FREE

The Get Trend indicator was created to neutralize temporary pauses and rollbacks. It analyzes the behavior of the price and, if there is a temporary weakness of the trend, you can notice this from the indicator, as in the case of a pronounced change in the direction of the trend.
Currency pairs never rise or fall in a straight line. Their rises and falls are interspersed with pullbacks and turns. Every growth and every fall is reflected in your emotional state: hope is replaced by fear, and w

Skiey - Indicator of easy solutions! Using this indicator is very simple, since the simplest is to look at the chart and act according to the color arrows. Such a calculation option takes into account intraday price fluctuations and focuses on measuring the "candlestick" share in the trend.
The algorithm takes into account the measurement of prices, this method also emphasizes the measurement of each of the price drops (H / C, H / O, LC, LO) - which gives more detailed information but also mo
MT4 Version Available Here: https://www.mql5.com/en/market/product/48040
Telegram Channel & Group : https://t.me/bluedigitsfx
V.I.P Group Access: Send Payment Proof to our Inbox
Recommended Broker: https://eb4.app/BDFXOsprey
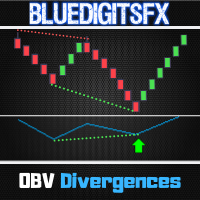
* Non-Repainting Indicator To Trade Divergences for any Newbie or Expert Trader ! BlueDigitsFx's OBV Divergence draws divergence lines on the chart and on the On Balance Volume (OBV) Indicator. Performs Amazingly at significant price areas such as support

Spread Indicator MT5 - NS Finanças. (http://www.nsfinancas.com.br) Auxiliary tool to give Spread visibility to all types of currency pairs and timeframes. The labels are well positioned in the upper right corner of the chart so as not to disturb the visualization during the trade, however it is also possible to drag the indicator to the best place on your screen. In addition to the current spread, this indicator also monitors the minimum, maximum and average spread of the selected currency pair
FREE

The Hulk v1.15, expert advisor is configured to trade with default settings on three currency pairs and the H1 time frame: CHFJPY,USDCAD and CADJPY . If you intend to test or use this robot on multiple symbols, assign a unique magic number to each of them to ensure the robot understands its tasks. The default risk is set at 0.01, but you have the option to activate the MM system and manually determine the risk level for each position.
This robot encompasses 50 independent strategies that can

Price activity indicator showing the trend zone - flat, not redrawing previous values. The indicator is very sensitive to current price activity and displays signals quite well. The state of the market, the phase of its movement largely determines the success of the trader and his chosen strategy. The color version of the indicator signals a trend change. The indicator allows you to see a rising or falling trend. In addition to the trend direction, the indicator shows a change in the angle of in

Despite the apparent simplicity of the indicator, inside it has complex analytical algorithms with which the system determines the moments of inputs. The indicator gives accurate and timely signals to enter and exit the transaction that appear on the current candle.
The main purpose of this indicator is to determine the moments of entry and exit from transactions, therefore, the Trend Revers indicator will display only the trend line and entry points, that is, displays the entry points to the
Channel Master is unique indicator for automatic channel finding. This indicator is fully adjustable by user. User can also put more instances of Channel Master to one chart with different channel size for better trend filtering. To find more information visit the 747Developments website. Features
Easy to use (just drag & drop to the chart) Fully adjustable Accessible via iCustom function Possible to use with any trading instrument Possible to use on any time-frame
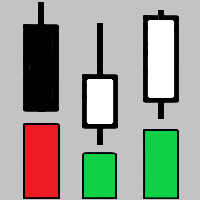
The indicator shows key volumes confirmed by the price movement.
The indicator allows you to analyze volumes in the direction, frequency of occurrence, and their value.
There are 2 modes of operation: taking into account the trend and not taking into account the trend (if the parameter Period_Trend = 0, then the trend is not taken into account; if the parameter Period_Trend is greater than zero, then the trend is taken into account in volumes).
The indicator does not redraw .
Settings Histo

Советник для скальпирования фьючерса BR на ММВБ. Внутридневный, в 23=45 закроет позицию. Работает на 15-ти минутках. По появлению отфильтрованного индикаторами сигнала на покупку/продажу выставляет отложенный ордер. Более короткий вариант таймфрейма выбирать не рекомендую из-за введенных ограничений для переменных в примененных индикаторов. Мартингейл не применён, EA тестирован на ММВБ на срочном рынке и только на фьючерсах BR. Для демонстрации результатов на склейке, параметры дооптимизи
FREE
At its most basic, the "Average Directional Movement Index Wilder" (ADXW) can be used to determine if a security/index/currencie is trending or not. This determination helps traders choose between a trend-following system or a non-trend-following system. Wilder suggests that a strong trend is present when ADXW is above 25 and no trend is present when ADXW is below 20. There appears to be a gray zone between 20 and 25. ADXW also has a fair amount of lag because of all the smoothing techniques. Ma

機械学習用のデータを用意するスクリプトです。 ストラテジーテスターで使用します。(気に入ってくれたら寄付感覚で購入お願いします) ファイルは「C:\Users\<ユーザ名>\AppData\Roaming\MetaQuotes\Tester\***アプリのID***\Agent-*\MQL5\FIles\」配下に出力されます。 (環境によって異なる可能性があります)
項目名 説明 MaPeriod 基本となる移動平均線の期間 PredictPeriod 予測対象となる未来の期間、(1時間足)30であれば30時間後 InputRange 過去~現在時刻までの幅 出力されるファイルの例: https://gist.github.com/tonarino210/26cdd8a3573fb71a3458616cbf99150e

This indicator will show the the change of volumes via 2 lines of SMA: . Fast line (default is 5 candles) . Slow line (default is 13 candles) We can use the crossing point of fast line and slow line to know investors are interesting in current price or not. Pay attention: The crossing point is not signal for entry. Absolutely that we must use in combination with other indicators for sure. Parameters: . Fast line periods: the periods (candles) to calculate SMA of fast line . Slow line periods: th
FREE

Media Móvel Grátis para uso em conjunto ao Diamond Indicator Atenção. Essa é a mm para conjugar ao indicador. Esse não é o indicador. Comprem o indicador que está tendo ótimos resultados. A seguir informações sobre o indicador: Indicador Para Opções Binarias. Usa dois gales. Instalar em mt5 Esse indicador é para ser usado no tempo de vela de 5 minutos e em M5. Este também funciona em M1, porém é mais eficiente em M5. Só descompactar e copiar os arquivos na pasta de dados do seu MT5. Arquivos
FREE

Только что открыли позицию, а цена резко пошла в другую сторону..Что делать? Просто потерпеть, усредниться или отстопиться (закрыться) и снова войти в сделку, но уже в противоположную сторону? Как поступить...а может просто снимать сливки и торговать по разворотным импульсам ….в этом Вам поможет и подскажет Индикатор тенденций и разворотов на базе коллекции паттернов советника ReversMartinTral https://www.mql5.com/ru/market/product/28761
который кроме рекомендаций и сигналов реверса вклю

This Indicator draws Fibonacci Extension levels in two different ways. You can select whether to draw Fibonacci Extension levels based on your favourite ZigZag settings or you can let the indicator to draw Fibonacci Extension level based on given number of Bars or Candles. You can also set Mobile and Email notification for your favourite Extension levels individually. With this indicator you will not have to feel lonely as the it can generate Voice alerts, which will keep you focused on your
This utility tool shows the intraday price variation as a percentage. It just works on any symbol and timeframe. Inputs: Font Size: You can change the font size of the price variation. Defaults to 15. Corner Location: You can choose between "Left upper chart corner", "Left lower chart corner", "Right upper chart corner", "Right lower chart corner" to show the information.

Indicador Para Opções Binarias. Indicator for Binary Options Usa dois gales. Instalar em mt5 Esse indicador é para ser usado no tempo de vela de 5 minutos e em M5. Este também funciona em M1, porém é mais eficiente em M5. Só descompactar e copiar os arquivos na pasta de dados do seu MT5. Arquivos indicator na pasta MQL5 - Indicator. Baixe também a Media Movel totalmente gratis:
https://www.mql5.com/pt/market/product/50400
Esse Indicador é para a próxima vela. Apareceu a seta, só aguardar a pr

The indicator displays 05 important parameters for traders 1. Display Bid -ASK price in big font 2. Display currency pair name and large time frame 3. TradeTick parameters 4. Swaplong and SwapShort 5. Point parameters used to calculate the price of SL or TP Indicators include 02 files supporting MT4 and MT5, You can download the link below. And follow the instructions of the video.

This indicator supports fast drawing of trendlines 1. Support drawing the next peak higher than the previous peak 2. Support drawing the lower peak after the previous peak 3. Support drawing the lower bottom of the bottom. 4. Support to draw the lower bottom higher than the previous bottom. 5. Support drawing trendline across the price zone. Peak connected vertex 6. Support drawing trendline across price range. Bottom connected Link to download and use for free. Including 02 files s

The Raschke Oscillator (LBR-RSI) indicator is the famous oscillator described in the book " Street Smarts: High Probability Short-term Trading Strategies " This indicator is perfect for a variety of researchs and it can be suitable to be used in combination with your own strategy just for trend trading or range-bound trading. The personal preference is to use it when the trend is not too strong, for example you can combine it with ADX to measure the strength of the trend and use it when ADX is b

Indicador Para Opções Binarias. Indicator for Binary Options Usa dois gales. Instalar em mt5 Esse indicador é para ser usado no tempo de vela de 5 minutos e em M5. Este também funciona em M1, porém é mais eficiente em M5. Só descompactar e copiar os arquivos na pasta de dados do seu MT5. Arquivos indicator na pasta MQL5 - Indicator. Baixe também a Media Movel totalmente gratis:
https://www.mql5.com/pt/market/product/50400
Esse Indicador é para a próxima vela. Apareceu a seta, só aguardar a pr

The strategy which is applied in finance market all around the world is known as CTA strategy. A successful CTA always includes multi-strategies, multi-instruments and multi-timeframe. The series of Multi Instruments TrendSystem (MITS) provide a profitable strategy which can be used in different instruments with different timeframe. Multi Instruments TrendSystem 7 LB (Level Break) MT5 is a fully automated multi-instrument Expert Advisor. This EA works well in BTCUSD. This EA is one of our trend
***Please Give Some Feedback and Reviews*** This is an indicator which shows the direction and the strength of the selected Symbol based on the two outputs, Signal and Value. The Signal indicates the directions as Buy equals 2(Blue) and Sell equals 1(Red). The Value output indicates the strength of the signal between -100 to 100. This indicator is both trend and fast preliminary indicator by choosing appropriate parameters. Indicator uses the Normalized ADX value as the hitting catalyst, which

Elite Tacticsは、安全で完全に自動化されたエキスパートアドバイザーであり、市場で最も重要なレベルを分析し、保留中の注文と取引して最速の執行を実現します。すべての注文はStopLossで保護されており、このEAは、スプレッドおよびスリッページ保護とともに高度なフィルタリング機能を実装しています。このEAは、マーチンゲール、グリッド、アービトラージなどの危険な戦略を使用していません。エリートタクティクスは、ユーザーが完全にカスタマイズできます。
このEAは、取引ペアや時間枠によって制限されません(EURUSDH1の時間枠で使用することをお勧めします。EliteTacticsのデフォルト設定もEURUSDH1用に最適化されています。
エリートタクティクスは、実際の取引口座を持つ両方のプラットフォーム(MT4とMT5)で検証され、可変スプレッドとシミュレートされた実行遅延を伴うMT5の100%実ティック、および可変スプレッドを備えたMT4の99.90%実ティックでテストとシミュレーションに合格しました。
すべての詳細情報、セットファイルの例、追加情報、最適化の推奨事項

多数の取引を行う非指標グリッドアドバイザー。 Expert Advisorは常に市場に出ており、チャートにインストールされると、すぐに2つの反対方向のポジションを開き、組み込まれているアルゴリズムに従って作業を開始します。ポジションをクローズするには、ストップロス、テイクプロフィット、損益分岐点、トレーリングストップ機能を使用できます。貿易統計がチャートに表示されます。エキスパートアドバイザーは、経験豊富なトレーダーと初心者の両方に適しています。最も不安定なペアは仕事に適しています:GBPUSD、USDCAD、EURUSD、USDJPY、USDCHF、AUDUSD、NZDUSD。
オプション:
START_LOT-天びんの各Nの開始ロット(パラメーターSTART_LOT_BALANCE); START_LOT_BALANCE-ロット計算の基本通貨のN単位。 MIN_INTERVAL_SEC-新しい注文を開始する間隔(秒単位)。 ORDER_OPEN_STOP-注文間のグリッド注文を開くためのステップ。 ORDER_OPEN_STEP-注文を開くための現在の価格からのオフセット

This application exports all completed operations to a text file delimited by <TAB>, comma, semicolon or any character defined by the user, also including the comments and magic number of the operations which can be easily exported to EXCEL or Google Spreadsheets.
The files are generated in the "files" folder, individually separated by month with the name in the format: 999999-AAAA BBBB- [9-9999] where:
999999 = MT5 Trading Account Number
AAAA BBBB = Trading Account User Name
[9-9999]

MT5 の ALPHA TRADER インジケーターは、 Average Directional Movement Index と ATR インジケーターの有効性を活用するインジケーターであり、市場トレンドと、反転シグナルに命を与えるそれぞれの売られすぎおよび買われすぎゾーンへの確かな洞察を提供できます。したがって、投資家に反転シグナルを視覚的に提供できるインジケーターを作成するために使用される信じられないほど信頼できるリソースです。結局、このインジケーターは、色付きの矢印を使用して入力シグナルを正確に発信するためです。取引チャート。 <:p><:p> 下の赤い矢印は売りのシグナルを示し、青い矢印は買いのシグナルを示しますが、トレーダーは通常のルーチンを破棄してはならないため、このインジケーターを盲目的に使用しないようにする必要があります。テクニカル分析と弱気のトレンドでは、トレーダーは売りシグナルのみを優先することを決定でき、強気のトレンドでは、トレーダーは買いシグナルのみを優先することを決定できます。これにより、トレーダーはリスクを大幅に削減できます。インディケータとトレーダーが間

Um especialista poderoso e profissional que permite gerar lucros estáveis com risco mínimo. IMPORTANTE! As instruções (na captura de tela) mostram as configurações para EURUSD. As configurações para outros pares de moedas serão otimizadas e adicionadas no futuro! IMPORTANTE! A frequência das ofertas de abertura pode variar de 1 em alguns dias a 5 em 1 dia. Depende diretamente do estado do mercado e do algoritmo para procurar sinais de entrada! IMPORTANTE! Recomendamos o uso das configurações e

The Fibonacci Trader MQL5 expert advisor uses the Fibonacci levels to determine a buy or sell trade with the MACD as confirmation. The Fibonacci levels work as follows: Above 61.8
SELL if MACD trend is SELL Trading Range (Ability to select trading input parameters)
BUY if MACD trend is BUY SELL if MACD trend is SELL Below 23.6
BUY if MACD trend is BUY
Default settings are configured for EURUSD on M5 Chart. To work with the news server, you must add the URL ‘ http://ec.forexprostools.com/ ’
FREE

MT4 Version Available Here: https://www.mql5.com/en/market/product/43555
Telegram Channel & Group : https://t.me/bluedigitsfx
V.I.P Group Access: Send Payment Proof to our Inbox
Recommended Broker: https://eb4.app/BDFXOsprey *All In One System Indicator, Breakthrough solution for any Newbie or Expert Trader! The BlueDigitsFx Easy 123 System makes it easy to identify important areas of market structure. It alerts you to changes in market structure which typically occur when a revers
MetaTraderプラットフォームのためのアプリのストアであるMetaTraderアプリストアで自動売買ロボットを購入する方法をご覧ください。
MQL5.community支払いシステムでは、PayPalや銀行カードおよび人気の支払いシステムを通してトランザクションをすることができます。ご満足いただけるように購入前に自動売買ロボットをテストすることを強くお勧めします。
取引の機会を逃しています。
- 無料取引アプリ
- 8千を超えるシグナルをコピー
- 金融ニュースで金融マーケットを探索
新規登録
ログイン