YouTubeにあるマーケットチュートリアルビデオをご覧ください
ロボットや指標を購入する
仮想ホスティングで
EAを実行
EAを実行
ロボットや指標を購入前にテストする
マーケットで収入を得る
販売のためにプロダクトをプレゼンテーションする方法
MetaTrader 5のための新しいエキスパートアドバイザーとインディケータ - 134

Loss Recovery 3 is an Expert Advisor for recovering losses of positions that were opened in the wrong direction (that were opened by another EA or manually). This EA recovers your loss and closes your position on Break Even or with determined profit.
Trading Strategy:
Loss Recover3 EA try to Recover Wrong Positions, by using Averaging method. There are various features on the EA to control risk of the strategy.
Using EA :
The EA is very simple and without complicated input para

As médias coiote automatizam a leitura de analise de médias rápidas e lentas no saldo do volume e preço. Quando as médias estão em modo compra, a coloração do candle fica azul.
Quando as médias estão em modo venda, a coloração do candle fica magenta. Quando a coloração fica verde ou vermelho, temos a tomada das médias no volume mas não no preço, quando isso ocorre é um sinal de atenção.
A concepção do indicador é ser utilizado para operações em saída de consolidações na direção da tendencia d
FREE

One Direction Pro is a combination of hedging, Grid averaging, pyramiding, lot martingale - anti martingale strategies, which aims to enter and exit the market as quickly as possible so as not to be trapped by unexpected market changes. Bot Explanation & Setfile | MT4 version
Expert parameters:
1. Manage Open Positions
Trade Buy: allow buy Trade Sell: allow sell Select Entry Method Period in bars for indicators : Average period Distance from High & Low Bands & Envelopes(in pips) : Distan
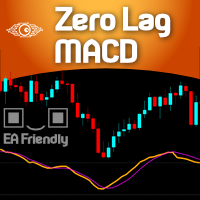
For those who are fans of the traditional MACD ( Moving Average Convergece/Divergence ) indicator, here it is a way faster indicator that could be very useful for intraday trading. Of course it could be used in higher timeframes, with the proper settings. Here at Minions Labs we always encourage traders to calibrate every single indicator you have to extract and distill every drop of good information it has for you. And this is the case with this speedy friend... This Zero Lag MACD could be used

Overview The Expert Advisor sends notifications to a mobile phone, via e-mail or plays a sound in case any changes are detected on the trading account: opening/closing positions, changing order or position parameters, balance or leverage. Also, the Expert Advisor can inform that Equity on the trading account has dropped below a specified value or Free Margin is small compared to Margin. The Expert Advisor does not trade, it only monitors your account.
Launching the Expert Advisor You should al

Perseverance. It is an Ea that seeks the best window of opportunity to enter the market.
If the entry is wrong, the system exits by stop lost.
If the entry is correct, once the point of no return is exceeded, an aggressive follow-up system begins.
Can used this EA whit 500$ in your account Perseverance IS IDEAL FOR SMALL ACCOUNTS Perseverance IS ONLY AN OPEN OPERATION. Perseverance IS VERY LOW RISK OF MARGIN CALL
You can download the demo and test it yourself.
Very stabl

評価してください!
トレンド方向に押し目買い・戻り売りのタイミングでエントリーするEAです。 トレンド方向はエンベロープで判断。 押し目買い・戻り売りのタイミングはローソク足のサイズで判断します。
逆行時のみ追加でエントリーを行いますが、トレンド方向へのエントリーなので大体助かります。
取引通貨: BTCUSD 取引スタイル: スキャルピング 取引時間足: 5分
パラメーター MAGIC : マジックナンバー Lots : MMを使用しない場合のロット ExitRatio : 口座残高N%でポジションクローズ MaxPosition : 最大ポジション数 MM : マネーマネージメント機能の使用設定 MaxRisk : MM使用時の最大リスク BreakPeriod : ローソク足計算期間 BreakDeviation : ローソク足サイズ EnvPeriod : エンベロープ期間 EnvDeviation : エンベロープ偏差

GIVE A LOOK TO MY OTHER PRODUCTS ! 100 % PER MONTH PROFIT---- MY NEW SIGNAL HERE -------> https://www.mql5.com/en/signals/2162238?source=Site+Signals+My#
The Parabolic SAR (PSAR) helps trader identifying direction of the stock movement and also provides them with the entry and exit. This indicator on the chart appears as a series of dots either above or below the price bars. When the Dots are below the price bar is then the price movement is considered to be bullish and when the Dots are a
The Moving Average Convergence Divergence Indicator (MACD) is both a trend–seeking and momentum indicator which uses several exponential moving averages set to closing prices to generate trading signals. This Version brought to you the Stochastic confluence filtering the signals, this set ups amazing entries on índices and stock futures trading.
We added many types of alerts plus the Delay Cross Filter to aid in your search for better opportunities in the market.
Product Features Sound aler

SHADOW vous donne des signaux d'achat et de vente solides avec un risque minimal. Vous pouvez voir dans quelle direction le prix évolue et la force du mouvement. Shadow filtre le bruit du marché et améliore radicalement les performances des traders.
Points forts: Détection visuelle efficace des tendances. Bruit du marché des filtres Ne repeint ni ne recalcule jamais. Signaux strictement sur "fermeture du bar". Fonctionne dans tous les symboles. Pop-up intégré, e-mail, notification push e
FREE
Risk Calculator is a panel for order size calculation according to stop loss and allowed risk per trade. The calculation is performed for the symbol the expert is launched at. Risk Calculator tells you how many cost to trade based on: Given stop-loss take-profit levels for "Instant Execution" and "Pending Order" Account currency Price of the quote currency (when different from account currency) Risk Calculator can place order like one click trading
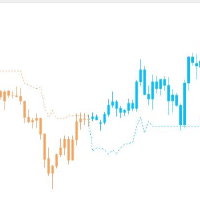
Stable trend index without clutter The index optimizes the moving average and removes the unstable clutter It can also be used in any other commodity It is best used in mainstream currencies such as EURUSD, USDJPY, GBPUSD and AUDUSD
The time period is 1 hour
I only know a little English, please forgive me if you don't understand I will always improve this indicator
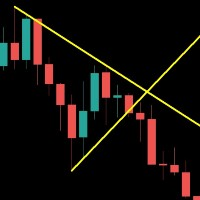
Save your time . Select area and the trend line will draw automatically . Draw a support and resistance line for the selected range with two mouse clicks . If you need to, you can also draw a line for support and resistance based on separate areas.
The resistance trend line is drawn based on the first and last highs inside the selected area; The support trend line is drawn based on first and last lows inside the selected area;

EVOLUTION NIGHT SCALPER
Evolution Night Scalper is an expert advisor trend follower that work on any currency pairs,but performs on EURUSD M5 . The EA uses Take Profit and a money Stop Loss. Average positions are opened when the market goes in the opposite direction but all closed at the maximum loss entered or take profit hit. Default setting are optimized by "Forward Test" to reduce overfitting from 2014 to 2021 and has the right compromise between initial lot and max loss but each one can m

-25% discount ($149 -> $111) Everything for chart Technical Analysis indicator mt5 in one tool Draw your supply demand zone with rectangle and support resistance with trendline and get alerts to mobile phone or email alert - Risk reward indicator mt5 Video tutorials, manuals, DEMO download here . Find contacts on my profile .
1. Extended rectangles and trendlines Object will be extended to the right edge of the chart when price will draw new candles on chart. This is rectangle extend

これはMT5のインジケーターで、再描画なしで取引に参入するための正確なシグナルを提供します。 外国為替、暗号通貨、金属、株式、インデックスなど、あらゆる金融資産に適用できます。かなり正確な見積もりを提供し、取引を開始して終了するのに最適な時期を教えてくれます。1つのシグナルを処理しただけでインジケーターの元が取れた例の 動画 (6:22)をご覧ください。Entry PointsPro インジケーターの助けを借りたほとんどのトレーダーの最初の1週間の結果が改善しています。 Telegramグループ に登録してください。Entry Points Proインジケーターのメリットは次の通りです。 再描画のないエントリーシグナル
再描画されるインジケーターでは一度表示されたシグナルが削除されて大きな金銭的損失につながることがありますが、これと異なり、表示されて確認されたシグナルは消えることがありません。
エラーなしの取引開始
インジケーターアルゴリズムによって取引を開始する(資産を売買する)理想的な瞬間を見つけることができます。それを使用するすべてのトレーダーの成功率が向上します。

キャンドルタイマーカウントダウンは、現在のバーが閉じて新しいバーが形成されるまでの残り時間を表示します。 時間管理に使用できます。
MT4バージョンはこちら !
機能のハイライト 現地時間ではなくサーバー時間を追跡します 構成可能なテキストの色とフォントサイズ シンボルの日次変動のオプションの視覚化 CPU使用率を削減するために最適化
入力パラメータ
毎日の変化を表示:true / false テキストフォントサイズ テキストの色
それでも質問がある場合は、直接メッセージで私に連絡してください。 https://www.mql5.com/ja/users/robsjunqueira/
これが私たちが継続的に進化することができる唯一の方法であるため、改善のための提案に気軽に連絡してください。
FREE
修正価格変動のスイングトレードのための高度なツール。継続方向のトレンドロールバックに作用し、必要な修正のサイズは、商品の現在のボラティリティによって、またはトレーダーが手動で決定します。現在のトレンドに沿って修正を検出した後、EAはシグナルが修正を完了してトレンドを継続するのを待ち、その後ポジションを開きます。 アドバイザの仕組みに関する説明-> こちら /MT4バージョン-> こちら 利点: 内蔵オートロット 注文開始のシグナルのカスタマイズ 手動注文を追加する機能を備えた完全に自動化された取引システム トレンドフィルタリング バスケットの動的ピッチ さまざまな種類の注文アニメーション ビルトインオーバーラップ すべての種類の通知 ボラティリティに基づく動的リトレースメントサイズ。 入力設定: 主な設定 最初の注文のサイズ-最初の注文を開くためのボリューム 自動ロット計算を有効にする-自動ロットを有効にする 0.01ロットあたりのオートロットデポジット-オートロット使用時の0.01ロットあたりのデポジット量 SIGNAL-操作用の信号を設定する エントリの最小ステップレ

Setup Tabajaraは、「ウォール街の鬼」として知られるブラジルのトレーダーによって作成されました。
この設定のアイデアは、トレーダーに価格の現在の傾向とグラフで探す必要のある操作のタイプを示すことです。
手術 これは、ろうそくの閉まりとVWAPを午前10時40分まで配置し、その後20期間の算術平均で、ろうそくを4つの可能な色でペイントすることによって行われます。 緑->上昇傾向の価格上昇(購入のエントリポイントを検索) 黒->強気トレンドでの価格修正(購入のためのエントリーポイントの検索) 赤->価格が下落傾向にある(販売用のエントリポイントを検索) 白->下降トレンドでの価格修正(販売のエントリポイントを検索) さらに、次のインジケーターもスクリプトに追加しました。 8期間の指数平均:短期的な価格変動を特定するため 50期間の算術平均:中期的な価格変動を特定する 80期間の指数平均:中期的な価格変動を特定する 200期間の算術平均:長期的な価格変動を特定する
それでも質問がある場合は、ダイレクトメッセージで私に連絡してください: https://www.mql
FREE

Place price Alerts on extended Rectangles and Trendlines - Risk reward indicator mt5 Extend Rectangles & Trendlines to the right edge Mark your supply demand zones with extended rectangle and draw support resistance lines with extended trendline. Find detailed manuals here . Find contacts on my profile . MT4 Rectangle extender indicator will simplify and make it easier for you to analyze markets and stay notified about important events. When you extend rectangle or trendline the a
Chart State Saver for MT5 is utility which helps to save states of all your charts even if they will be closed. And then all saved charts' states can be easily loaded back to charts.
It stores templates for each particular currency pair and automatically applies them to charts once they will be opened at next time. Also they can be applied to the charts by your own needs. Thus you can close any chart at your MT5 without scaring to lose chart's data like drawls, messages, chart styling and so o

キャンドルカウンターは、その日の最初のキャンドルからのキャンドルの数を印刷するインジケーターです。 その日の最初のキャンドルは1番になり、新しいキャンドルはこのカウントで1ずつ増えます。
入力パラメータ 偶数、奇数、またはすべてから選択します ろうそくから数字を印刷するまでの距離 テキストのフォントサイズ テキストフォントの色
それでも質問がある場合は、直接メッセージで私に連絡してください。 https://www.mql5.com/ja/users/robsjunqueira/ ------------- これが私たちが継続的に進化することができる唯一の方法であるため、改善のための提案に気軽に連絡してください。
FREE

RENKO PRICE ACTION ATRは、レンコチャートの作成を通じて開発された「エキスパートアドバイザー」であり、各BRICKは、ユーザーが選択した期間のATRによって計算されたサイズを持ちます。 レンコチャートは、マイナーな価格変動を除外するように設計されているため、トレーダーは重要なトレンドに集中しやすくなります。 価格動向の検出効率が高いため、支持と抵抗、および上下の相違を明確に識別して、取引機会をより有効に活用することもできます。
手術 RENKO PRICE ACTION ATRは、どの通貨ペアでも機能します。 RENKO PRICE ACTION ATRは、優れたリアルタイム更新パフォーマンスを備えています。
設定 ATR計算時間枠:ATRの平均を適用し、各BRICKのサイズを計算/再計算するためのRENKO PRICE ACTIONATRのユーザー選択期間。 ATR計算平均化期間:各BRICKのサイズ計算を実行するためのRENKO PRICE ACTIONATRのATR平均化のユーザー選択期間。 ATRサイズのパーセンテージ:各BRICKの形成に使用され
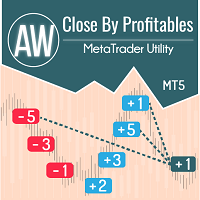
アルゴリズムはアカウントで最も収益性の低いポジションを見つけ、プログラムは損失をカバーできる収益性の高いポジションを決定します。この利益は決算に使用されます 自動モードでの不採算注文。システムは、最も遠い不採算の注文を処理したり、手動で選択して特定のチケットに従ってそれらを選択したりすることができます。つまり、ユーティリティは、勝ち注文の1つまたはグループを使用して負け注文をクローズします。 機会:
現在のシンボルまたはすべてのシンボルの成約注文 一度に1つまたは複数の不採算注文をクローズする機能 マジックナンバーとクロージングチケットの選択 お金、ポイント、またはパーセンテージでの収益性の高い注文と収益性の低い注文の選択 購入または販売の注文のみを閉じるか、すべての注文を閉じる バスケット内の収益性の高い注文の最大数を選択する 損失をカバーするために Troubleshooting, appeal to the author - > https://www.mql5.com/en/blogs/post/741436
MT4 version
Inp

コーシー分布は、ファットテール分布の典型的な例です。太い尾は、確率変数が中央の傾向から逸脱する確率が非常に高いことを示しています。したがって、正規分布の場合、確率変数の数学的な期待値からの3標準偏差以上の偏差は非常にまれであり(3シグマルール)、コーシー分布の場合、中心からの偏差は任意に大きくなる可能性があります。このプロパティは、市場の価格変動をシミュレートするために使用できます。したがって、コーシー分布は、予期しないおよび/または予測できない要因によって引き起こされる大きくて急激な価格変動を除外することができます。 インジケーターを使用すると、使用する価格を選択できます。また、そのインジケーター操作は、次のパラメーターを使用して構成されます。 iPeriod-計算するバーの数 PercentLvl 1-3-レベルの偏差(パーセント)、許容値は0より大きく100未満(デフォルトでは-50、20、10パーセント) Shift-レベルの継続を右に トレーディングでのこの指標の使用は、価格が最高または最低レベルを超えた後、平均値に戻る可能性が高いという仮定に基づいています。つまり、価格が

BlastWave is a fully automated EA designed to trade EURUSD only. Please hang the EA on the H1 chart. The idea of EA is to use a smaller stop loss to gain a larger profit-loss ratio, and set up automatic protection under the premise of reaching a certain profit. BlastWave does not pursue a beautiful funding curve, a perfect curve does not exist in actual transactions. If you use AutoLot mode, you may have a larger drawdown, but in the long run, explosive profits will still exist. Every t
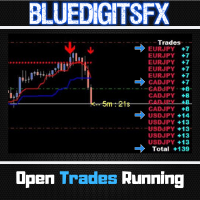
MT4 Version Available Here: https://www.mql5.com/en/market/product/43528
Telegram Channel & Group : https://t.me/bluedigitsfx
V.I.P Group Access: Send Payment Proof of any of our Paid Products to our Inbox
Recommended Broker: https://eb4.app/BDFXOsprey * The Most Sought After Pip Counter for Metatrader ! Features
Will show Currency Symbol in BLUE for Buy positions. Will show Currency Symbol in RED for Sell positions. Will Show pips in BLUE Color for Positive Pips Will Show pips in
FREE

Setup Tabajara was created by a Brazilian trader known as "The OGRO of Wall Street" .
The idea of this setup is to indicate to the trader the current trend of prices and the type of operation should be looked for in the graph.
Operation
It does this through the relation of the closing price position and the of 20 periods, by painting the candles in 4 possible colors : Green -> Price rising in upward trend (Search entry points for PURCHASE) Black -> Price correcting in Bullish Trend
FREE
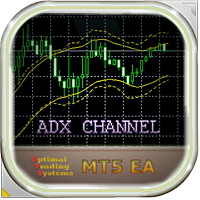
This EA forms a channel based on the readings of the ADX indicator (Average Directional Movement Index), and trades from the boundaries of this channel when the price reversals. This channel is displayed on the chart of the currency pair. A sell trade is executed when the price touches and bounces off the upper channel line, a buy - from the lower one. At the same time, it can filter entries to trades depending on the readings of other indicators: Stochastic, ATR and RSI. The channel drawn by th

TrendMeasurer indicator manual / TMi manual The indicator is designed to help the user to find the end point of a strong trending price movement. Important - END. Not start. How the indicator works The first price impulse and its subsequent pullback form a certain "critical mass" which acts as "fuel" for further price movement. The production of this fuel indicates the potential end of the trend. Both volume and indicator calculated in a certain way from price data can be the fuel. The amount of

TrendMeasurer indicator / TMi The indicator is designed to help the user to find the end point of a strong trending price movement. Important - END. Not start. How the indicator works The first price impulse and its subsequent pullback form a certain "critical mass" which acts as "fuel" for further price movement. The production of this fuel indicates the potential end of the trend. Both volume and indicator calculated in a certain way from price data can be the fuel. The amount of "fuel" can be

VWAP Fibo Bands RSJ is an indicator that traces the lines of the daily VWAP and from it creates bands using Fibonacci proportions. This spectacular indicator creates 10 band levels through the selected VWAP period using Fibonacci ratios.
It is fantastic how the prices respect each level of the bands, where it is possible to realize that almost every time the price closes above / below a level of the bands he will seek the next one. If close above will seek to reach the level above and if close
FREE

VWAP RSJ is an indicator that plots the Hourly, Daily, Weekly and Monthly VWAP Lines.
Large institutional buyers and mutual funds use the VWAP ratio to help move into or out of stocks with as small of a market impact as possible. Therefore, when possible, institutions will try to buy below the VWAP, or sell above it. This way their actions push the price back toward the average, instead of away from it. Based on this information I developed this indicator that combines 4 types of VWAP T
FREE

This indicator calculates the difference between the SELL aggression and the BUY aggression that occurred in each Candle, plotting the balance of each one graphically. Note: This indicator DOES NOT WORK for Brokers and/or Markets WITHOUT the type of aggression (BUY or SELL).
Be sure to try our Professional version with configurable features and alerts: Delta Agression Volume PRO
Settings
Aggression by volume (Real Volume) or by number of trades (Tick Volume) Start of the Aggression De
FREE

Bonus when buying an indicator or an advisor from my list. Write to me in private messages to receive a bonus. Manual Assistant MT5 is a professional manual trading tool that will make your trading fast and comfortable. It is equipped with all the necessary functions that will allow you to open, maintain and close orders and positions with one click. It has a simple and intuitive interface and is suitable for both professionals and beginners.
The panel allows you to place buy and sell orders
FREE

The indicator draws a normal chart by coloring it in colors based on prices calculated by the Heiken Ashi indicator algorithm.
That is, the shape of the candles does not change.
In fact, this is the same Heiken Ashi that does not distort the price chart.
Then there will be a drawing of a cat, because there is nothing more to write about the indicator. .
FREE

This simple indicator paints with a darker color on the volume bar when the quantity traded is above the average of select number of periods of the volume itself, highlighting the moments when there was a large volume of deals above the average. It is also possible to use a configuration of four colors where the color tone shows a candle volume strength. The indicator defaults to the simple average of 20 periods, but it is possible to change to other types of averages and periods. If you like
FREE

Profit Zone МТ5 The Expert Advisor analyzes more than 100 indicators. Thanks to this, he trades almost all week long. The Expert Advisor can trade either completely independently, or it is possible to open the first positions on its own, after which the Expert Advisor will independently bring the matter to its logical conclusion, that is, close the position or positions in a plus. FEATURES: The Expert Advisor can trade both in both directions at once, or only in one direction. It is used without

The delta indicator is used to display the difference between the volume that passed on the exchange at the Ask price and above (market buys) and the volume that passed at the Bid price and below (market sales). This indicator shows the delta of each candle on the timeframe of your choice. The data is displayed as a colored histogram in a separate indicator window. The indicator is calculated from the tick history, therefore, to speed up the calculations and reduce the load on the system, the n

The EA is based on a scalping breakout strategy , uses advanced exit algorithms and has built-in filters to filter out bad signals. Fully automatic trading with entry calculation based on the high / low breakout system. For trading, the advisor uses 4 currency pairs and the M30 timeframe. To create a strategy, we used historical data with a history quality of 99.9%, over the past 20 years. The EA has the following features: Uses a smart false signal filtering system. Uses a system for recognizi

https://www.sendspace.com/file/hrxcew - REPORT TEST DOWNLOAD
TESTED ON GBPUSD/ AND EURUSD
LOGIC:
Moving Averages Crossover, Macd Historigram and Adx
TRADING SIZE LOTS: (MARTINGALE)
OPENING LOTS START: 0.10
ADD/WINING POSITION: 0.05
PROTECTED ALWAYS WITH STOPLOSS, MAX STOPLOSS LIMITS AND TRAILING STOPS
TRADE WITH RIGHT RULES
/////N!%Drawdown??
///// really ?? you will want something like that for sure.... ALWAYS TRYING CHANGE THE MOTHERFUCKER GAME ...... by: WeeDFoX4_20P

Indicador en MQL5 que obtiene el promedio de 10 EMAS que son alineadas y procesadas según Fibonacci luego el promedio es suavizado" Se ingresa un número de 2 a N que multiplica los EMA-Fibonacci y por consiguiente aumenta los fibonacci, resultando un promedio. Se ingresa un número que suaviza los EMA-Fibonacci. Considerando los números 1/1 seria la suavización minima. Considerando los números 3/5 seria la suavización media. Considerando los números 10/30 seria la suavización alta.....etc

Tarcius EA is designed with “High-Low Breakout” strategy to find entries with the trend when price breaks from a key point of previous high-low candle. Features: Great “High-Low Breakout” strategy with promising win rate ( ≈ 60%) and low drawdown Risk Reward Ratio = 1 : 1 (SL = TP). Hidden SL and TP. EA monitors the price at all times and closes the position when the price level is reached.
No martingale, no grid, scalp or hedge Two options for Lot size management: Fixed Lot size Lot size bas

ProFactor is an indicator generating signals based price on the famous profit factor formula. The calculation is simply defined as gross GREEN BARS divided by gross RED BARS.
That's it in a nutshell, but sometimes the simplest things hold the most value.
So let's imagine your trading system's gross profit for the past year was $40,000 and your gross losses were $20,000. Your Profit Factor would be 2. The ProFactor calculation works on the price of the asset instead of the strategy out
FREE

Simple Stochastic Hedge Welcome to the Simple Stochastic Hedge Robot
The Robot works on all Pairs and all Time Frames.
With Stats on Screen + Timer +Spread Filter ===== -Balance -Equity -Spread -P7L -Buy Orders -Buy Lots -Buy Profit -Sell Orders - Sell Lots - Sell Profit This Robot is very easy to use . You can basically just download it and start trading. There is a easy Hedge Strategy built in to keep the risk as low as possible.
I wish everyone the most possible success with the

This indicator watch the Fibonacci retracement for levels and timeframes selected by the trader. In the workload of day trading, having your eyes on all the timeframes to validate some information, for Fibonacci traders, is really time consuming and requires constant focus. With this in mind, this tool allows you to have your attention on other trading details while this one monitors the retracements of each timeframe in real time. In the charts, this indicator data (retracement %, age of the r
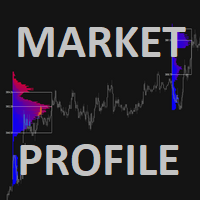
Concept of Market Profile was created at Chicago Board of Trade (CBOT) by trader Peter Steidlmayer and first published during the 1980s as CBOT product. Market profile by itself is not a stand-alone strategy, but a different way how you can view the market and make better trading decisions.
They have seen a market as an auction process which is affected by supply and demand the same way as every other auction, for example, development of prices of food, gas etc.
The price goes up as long th

TwoPairEA Work mainly on EURUSD and GBPUSD , in Timeframe H1 . The EA used Moving Averages Indicators. Moving Average with input parameters: : MaximumRisk = 0.02; // Maximum Risk in percentage DecreaseFactor = 3; // Descrease factor MovingPeriod = 12; // Moving Average period MovingShift = 6; // Moving Average shift
if you can not run a backtest, watch the video below. https://youtu.be/vW9dbwRG_JI

GIVE A LOOK TO MY OTHER PRODUCTS !
100 % PER MONTH PROFIT---- MY NEW SIGNAL HERE -------> https://www.mql5.com/en/signals/2162238?source=Site+Signals+My# Morning and evening star are 2 famous and reliable candlestick patterns, very helpful to understand an imminent change of trend. This indicator finds for you this patterns on your chart and send you an alert just when a pattern is 100 % formed. To make this indicator more reliable,y

This indicator provides an original mix of WPR, VSA, and volume delta. It shows ratio of buy/sell volumes scaled on 100% range based on total volume change for a selected period. The convetional VSA (Volume Spread Analysis) studies interconnections of price action and volume change in absolute values, whereas WPR (Williams Percent Range) offers a convenient approach of price moves normalization into the fixed percentage metric: 0 - 100%. Hence overbough and oversold states are easily spotted. N
KT Candlestick Patterns Robot is a 100% automated expert advisor based on the KT Candlestick Patterns indicator . After fetching the candlestick patterns and signals directly from the indicator, it performs some pre-checks and assessments to execute the trading positions efficiently. Entries: On the emergence of new candlestick patterns. Exits: The opposite pattern, Neutral pattern, Stop-loss, or Take-Profit.
All the dependencies are embedded in the expert advisor. It's not imperative to buy

An effective indicator that highlights candles with increasing volumes, overshadowing those with shrinking volumes. Also suitable for Forex because it uses tick_volume.
You can set the colors to your liking. It will be easier to spot trends and possible reversals. The increasing volumes indicate the presence of large investors and therefore determine the reliability of the candle under observation
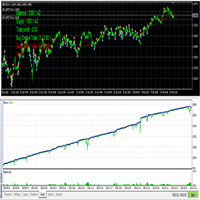
Hello This EA is depending on Guaranty strategy , it open same position by wide pips every time then will close in profit. it can make a continues profit (maybe little but continues) you can change all settings but don't be impetuous. note; (if you want make back test) make Work_in_Backtest_TF true
you can download it and make Back Test before buy it
good luck
السلام عليكم ورحمة الله وبركاته يعتمد هذا الاكسبيرت على إستراتيجية مضمونة ، فهو يفتح نفس المركز في كل مرة لكن على فترات متباعدة

What you have to know before using the LetsGrowUP EA : -The EA works only on EURUSD. -This EA works better with accounts with less than 15 spread broker, 1:500 levrage, 0.01 minimum lot amount, more than 1000$ balance. -The EA is based on a real strategy and a well studied methodology, so changing the timeframe on backtest will not change the result. -When you do a backtest choose « every tick based on real ticks » to get a reliable backtest, and do it with a $10,000 balance. -To get the best

This EA trades Initially on Price breakouts on Support and Resistance ----------------------------- (Please leave a review after you tested the demo)
Opening of Trade: Buy Trade will open if price crosses above Resistance. Grid Buy will also open if price crosses above resistance and if the distance from the last trade price is above average true range value.
Sell Trade will open if price crosses below Support.
Grid Sell will also open if price crosses below Support and if the distanc
Daily Percentage Change (MetaTrader indicator) — calculates the change of currency rate related to the previous daily close and displays it in percentage points in the main chart window of the platform. Additionally, it can display the weekly and monthly percentage changes. Different colors can be set for positive or negative price increases. Also, a small customizable arrow helps to visualize the price change direction. If your broker uses an unconventional time zone, the indicator can use

Description
Bitcoin Manager is the best indicator for trading Bitcoin cryptocurrency. It is calculated based on the price deviation from the moving average line channel. Ascending and descending arrows indicate potential points and levels for opening buy and sell positions.
How to use?
We strongly recommend using this indicator on the H1 timeframe. An up arrow indicates a buy level. Down Arrow - Sell Level.
Parameters
Maximum History Bars - maximum count of history bars to calculate

Please if possible consider the paid version which I will continue to develop (there will be no future updates for this free version).
This Expert Advisor identifies when a divergence occurs between price and an oscillator/indicator. It identifies both regular/classical (trend reversal) and hidden (trend continuation) divergences. It has RSI, bollinger, stochastics, moving average and ADX filter options which makes it possible to filter out only the strongest setups. The default settings ar
FREE

Smart Copy is an Easy-to-Use EA that supports Multi Copying Metatrader4 and Metatrader5 and Local/Remote Copying. (Remote Version is coming soon)
Free version is available on Smart Copy Local Free MT5
Specifications :
Real Time, Multi Terminal - Multi Account - MT4/MT5 trade copying Copy from netting to hedge and hedge to netting is supported.
Fast and instant copy
All settings are input visually. Easy modifying symbol names, prefix, suffix Enable/Disable
This expert is a pure volatility scalper working with market orders orders. Expert not use any indicator, only use prices action and volatility of price to generate signals. Using an algorithm to calculate the speed of price to generate the signals. There are three conditions for it to work: Tight spread Fast execution Stop level = 0 Please during the tests of this EA do not simultaneously use another EA in the same terminal because it affects the modification speed. Try expert on demo accoun
FREE

Fully automatic trading system that trades Renko bars and trend indicators. Renko bars are drawn in the indicator window below the chart. The signal to sell or buy is the intersection of renko and indicator signal. The default settings for the euro / dollar pair, t he EA has shown the best results for the pair GBPJPY and GOLD . The timeframe for trading is m1. There is a time filter. The EA has an autolot system. Our telegram channel After installing the EA, download the installation set
FREE

Magic EA is an Expert Advisor based on Scalping, Elliot Waves and with filters such as RSI, Stochastic and 3 other strategies managed and decided with the robot smartly. Large number of inputs and settings are tested and optimized and embedded in the program thus inputs are limited and very simple. Using EA doesn't need any professional information or Forex Trading Knowledge. EA can trade on all symbols and all time frames, using special and unique strategies developed by the author.
The EA

Elliot Waves Analyzer calculates Elliot Waves to Help Identify Trend direction and Entry Levels. Mainly for Swing Trading Strategies. Usually one would open a Position in trend direction for Wave 3 or a Correction for Wave C . This Indicator draws Target Levels for the current and next wave. Most important Rules for Elliot Wave Analysis are verified by the Indicator. This free version is limited for Analyzing one Timperiod Waves. Waves are Shown only in PERIOD_H4 and above. Not Useful for Intr
FREE

The Expert Advisor tool has been developed for Nasdaq, based on Vortex and pending orders. The stop loss is based on fixed pips. It has been backtested on more than 10-year long M1 data with high quality of modeling. The enclosed screenshots demonstrate the complexity and coverage of the test by Monte Carlo analysis with 200 simulations. T he Expert Advisor passed via Cluster Analysis, Optimization profile, System parameter Permutation. There is no need to set up parameters - all settings are al
FREE

Yes I Can - it is a Secure Automated Software for trade Forex market and indices.
Yes I Can Used Mars 10 Bars Signal indicator whit two way algorithm The architecture is a Fully Automatic Autonomous Robot Expert capable of independently analyzing the market and making trading decisions
Yes I Can It is an advanced trading system. This is a fully automatic Expert Advisor.
It is a 100% automatic system, the system controls both the inputs and the batches, the operator just

Smart Copy is an Easy-to-Use EA that supports Multi Copying Metatrader4 and Metatrader5 and Local/Remote Copying. (Remote Version is coming soon)
This is Free Version and can be used on Demo accounts only. Use the Full Version for real trading.
Specifications :
Real Time, Multi Terminal - Multi Account - MT4/MT5 trade copying Copy from netting to hedge and hedge to netting is supported.
Fast and instant copy
All settings are input visually. Easy modifying symbol
FREE

Auto SLTP Maker MT5 is an assistant for all those who forget to set StopLoss and/or TakeProfit in deal parameters, or trade on a very fast market and fail to place them in time. This tool automatically tracks trades without StopLoss and/or TakeProfit and checks what level should be set in accordance with the settings. The tool works both with market and pending orders. The type of orders to work with can be set in the parameters. It can track either trades for the instrument it runs on, or all

The indicator highlights in color the places on the chart where the price moves in one direction continuously from the selected number of candles.
You can specify the number of points from the beginning of the movement to select only movements from this amount.
It can be useful for looking for reversals or sharp impulses.
I also recommend purchasing this utility to determine local weekly / monthly trends and support and resistance lines. https://www.mql5.com/en/market/product/61401
FREE

Aver is a fully automatic multi-currency robot. The Expert Advisor uses the classic medium-term averaging model. Limit orders are used to open positions. Price data is taken from weekly charts, this allows you to minimize the distortion of the work of different brokers.
Monitoring: https://www.mql5.com/en/signals/912803
EA Aver It does not need to configure parameters. Automatic mode is ready to work on EURUSD, GBPUSD, AUDUSD, NZDUSD, USDJPY, USDCHF, USDCAD. You only need to decide on t
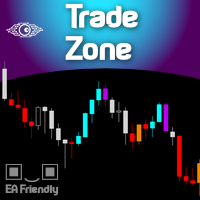
For those who are fans of Bill William's strategy, here it is the Trade Zone indicator filled with alerts and a better coloring system and EA ready (BUY & SELL buffers). And for those who don't know Bill Williams work, search Amazon for the title " Trading Chaos: Maximize Profits with Proven Technical Techniques ". This indicator internally uses the widely known Awesome Oscillator along with the Accelerator indicator, and when both are aligned it lights up the candles signaling a probable strong
MetaTraderマーケットは、他に類のない自動売買ロボットやテクニカル指標の販売場所です。
MQL5.community ユーザーメモを読んで、取引シグナルのコピー、フリーランサーによるカスタムアプリの開発、支払いシステムを経由した自動支払い、MQL5Cloud Networkなど、当社がトレーダーに対して提供するユニークなサービスについて詳しくご覧ください。
取引の機会を逃しています。
- 無料取引アプリ
- 8千を超えるシグナルをコピー
- 金融ニュースで金融マーケットを探索
新規登録
ログイン