YouTubeにあるマーケットチュートリアルビデオをご覧ください
ロボットや指標を購入する
仮想ホスティングで
EAを実行
EAを実行
ロボットや指標を購入前にテストする
マーケットで収入を得る
販売のためにプロダクトをプレゼンテーションする方法
MetaTrader 5のための新しいエキスパートアドバイザーとインディケータ - 101

Get a free complementary EA after your purchase! Contact me and ill provide it for you.
MT4 Version: https://www.mql5.com/en/market/product/67799
In this EA you will have two sources of income:
1- Direct trades
2- Rebates from your broker.
Thus insure to register under an IB that shares with you their revenues
Scalping! What a thrill!
Forex trading had been a source of income and thrill at the same time! (Forex is risky, you may loose all your capital)
With our new Expert Ad

KT Bullish Bearish shows the bullish/bearish regime of the market in the form of a colored histogram representing both of the market states alternately. Bull Market (Blue Histogram): A bull market indicates an uptrend when an instrument price rises over a continued period like days, months, or years. Bear Market (Red Histogram): A bear market indicates a downtrend when an instrument price rises over a continued period like days, months, or years.
Applications
It prevents trading against the

The KT Currency Strength Meter measures the individual currencies' strength and weakness by applying an aggregated mathematical formula over the major FX pairs. The strength is calculated using the bullish and bearish candles over a fixed period. After filling up the strength data, an algorithm sorts out the strongest and weakest currencies in a stack and updates their orders using the real-time incoming data.
Advantages
Improve your trading strategy instantly by filtering out the signals th
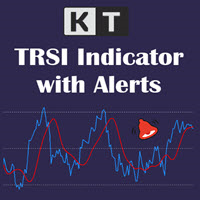
KT TRSI is an oscillator built using a combination of RSI (Relative Strength Index), EMA (Exponential Moving Average), and SMA (Simple Moving Average). Compared to the classic RSI, a TRSI is less susceptible to false signals due to the SMA's smoothing factor. Moreover, it is also equipped with all kinds of Metatrader alerts.
Simple Entry Rules
Buy: When the Blue line(RSI) crosses above the Red line(TRSI). Sell: When the Blue line(RSI) crosses below the Red line(TRSI).
Advance Entry Rules

KT Bollinger Bands Alert is a modified version of the classic Bollinger Bands added with price touch alerts and visible price tags for each band separately.
Alert Events
When the current price touches the upper Bollinger band. When the current price touches the middle Bollinger band. When the current price touches the lower Bollinger band.
Features Separate alert events for each band. Ability to specify a custom interval between each alert to prevent repetitive and annoying alerts. Added

KT SuperTrend is a modified version of the classic SuperTrend indicator with new useful features. Whether its Equities, Futures, and Forex, the beginners' traders widely use the Supertrend indicator. Buy Signal: When price close above the supertrend line.
Sell Signal: When price close below the supertrend line.
Features
A multi-featured SuperTrend coded from scratch. Equipped with a multi-timeframe scanner. The last signal direction and entry price showed on the chart. All kinds of MetaTra
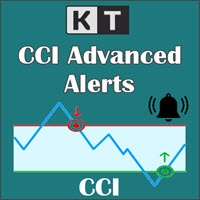
KT CCI Alerts is a personal implementation of the Commodity Channel Index (CCI) oscillator that provide signals and alerts on four custom events: When CCI enter in an overbought zone. When CCI exit from an overbought zone. When CCI enter in an oversold zone. When CCI exit from an oversold zone.
Features A perfect choice for traders who speculate the CCI movements within an overbought/oversold zone. Lightly coded without using extensive memory and resources. It implements all Metatrader alerts
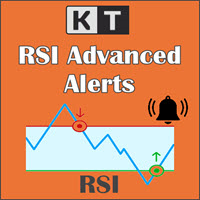
KT RSI Alerts is a personal implementation of the Relative Strength Index (RSI) oscillator that provide signals and alerts on four custom events: When RSI enter in an overbought zone. When RSI exit from an overbought zone. When RSI enter in an oversold zone. When RSI exit from an oversold zone.
Features A perfect choice for traders who speculate the RSI movements within an overbought/oversold zone. It's a lightly coded indicator without using extensive memory and resources. It implements all

The Vortex Indicator was first presented by Douglas Siepman and Etienne Botes in January 2010 edition of Technical Analysis of Stocks & Commodities. Despite its based on a complex implosion phenomenon, the vortex is quite simple to interpret. A bullish signal is generated when +VI line cross above the -VI line and vice versa. The indicator is mostly used as a confirmation for trend trading strategies. The Vortex was inspired by the work of Viktor Schauberger, who studied the flow of water in tur

Get a free complementary EA after your purchase! Contact me and ill provide it for you.
MT4 Version: https://www.mql5.com/en/market/product/79920
Time frame: M1
Leverage : Higher the better
Spread: Lower the better
Account type : All types
(EA may enter hedge positions, if you want to disable this feature deactivate either Buy, or Sell from the setting)
Please please do not take unnecessary r
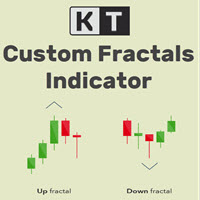
KT Custom Fractals is a personal implementation of the Fractal indicator first introduced by Bill Williams. With KT Custom Fractals you can choose a custom number of bars to allow to the left and right side of the fractal. For example, you can display the fractals that have "three" successive bars with the highest high in the middle and one lower high on both sides , or you can display the fractals that have "Eleven" consecutive bars with the lowest low in the middle and five higher lows on bot

KT Fractal Channel Breakout draws a continuous channel by connecting the successive Up and Down fractals. It provides alerts and also plots the Up and Down arrows representing the bullish and bearish breakout of the fractal channel.
Features
If you use Bill Williams fractals in your technical analysis, you must also include it in your trading arsenal. It can be very effective and useful for stop-loss trailing. A new market trend often emerges after a fractal channel breakout in a new directi

KT Forex Volume shows the buying and selling volume of a currency pair in the form of a colored histogram. The volume is made of buying and selling transactions in an asset. In FX market: If the buying volume gets bigger than the selling volume, the price of a currency pair would go up. If the selling volume gets bigger than the buying volume, the price of a currency pair would go down.
Features Avoid the bad trades by confirming them using the tick volume data. It helps you to stay on the si
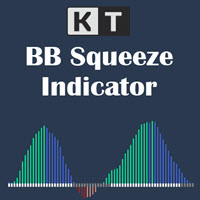
KT BB Squeeze measures the contraction and expansion of market volatility with a momentum oscillator, which can be used to decide a trading direction. It measures the squeeze in volatility by deducing the relationship between the Bollinger Bands and Keltner channels. Buy Trade: A white dot after the series of gray dots + Rising momentum above the zero line.
Sell Trade: A white dot after the series of gray dots + Rising momentum below the zero line. Markets tend to move from a period of low vol

Some disadvantages of Rollover Scalper: Currently the markets aren't that favorable for night scalping because of the fundamentals, so the next few months the EA might show 0% or even negative return. However, it happened in the past too and it was still profitable over all ~20 years. It's a scalper, so you'll need a broker with low spread and good execution time, preferably an ECN broker. ICMarkets would be a good choice. It's susceptible to slippage (which can't be backtested or limited on ECN
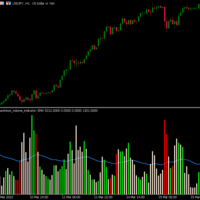
Hawkeye Volume Indicator contains a complex algorithm which executes over 300 calculations per bar in order to analyze the price action and associated volume, giving traders a tremendous advantage. Now Available in MT5 for U nlimited Use !
Volume is the only leading indicator which: .signals a price movement prior to it happening
.provides the fuel that drives the market Hawkeye Volume works in all markets and can be used in all timeframes for both tick and time charts – from longer term swing
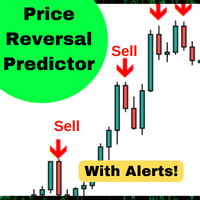
このアルゴリズムは、90%*の精度で価格の短期的な変化を予測します。 価格が信号キャンドルよりも高いか低いかを予測します。 より大きな時間枠で平均復帰取引、バイナリオプションや先物契約のための完璧な。 この指標は5年間のデータに基づいてバックテストされ、時間の経過とともに価格の逆転を予測するための90%の精度を持っています。
特徴:
簡単なセットアップ 任意のグラフにドラッグアンドドロップ アラートを有効にする(オプション) そして、あなたは完了です! 視覚的および音声的な警告 お使いの携帯電話に直接送信されるアラート 端末に送信されるポップアップ警告 高いwinrate 取引の最大90%を獲得 バックテストされた5年と複数の通貨。 (バックテストの詳細と分析については、ウェブサイトを参照してください)。 多数の信号 アクティブモードでは、シンボルごとに一日3-6信号を期待しています パッシブモードでは、シンボルごとに1日に2つの信号を期待しています。 *これは30分の蝋燭の表示器があればあります。 柔軟性 外国為替、指数、コモディティや株式に取り組んでいます。 任意の時間枠
FREE

このアルゴリズムは、86%*の精度で価格の短期的な変化を予測します。 ATRによって決定されるように大きな動きがある場合,買われ過ぎや売られ過ぎの状態の間に,インジケータはあなたに警告します. 価格が信号キャンドルよりも高いか低いかを予測します。 より大きな時間枠で平均復帰取引、バイナリオプションや先物契約のための完璧な。 この指標は5年間のデータに基づいてバックテストされ、時間の経過とともに価格の逆転を予測するための90%の精度を持っています。
特徴:
簡単なセットアップ 任意のグラフにドラッグアンドドロップ お好みに合わせてパラメータを調整(オプション) アラートを有効にする(オプション) そして、あなたは完了です! 視覚的および音声的な警告 お使いの携帯電話に直接送信されるアラート 端末に送信されるポップアップ警告 高いwinrate 取引の最大90%を獲得 バックテストされた5年と複数の通貨。 (バックテストの詳細と分析については、ウェブサイトを参照してください)。 多数の信号 シンボル*ごとに1日に2つの信号を期待しています。 *これは30分の蝋燭の表示器があればあ
FREE

DYJ Cashregistereaは、DYJ技術指標に取り組みます。市場が強いとき
このEAの発見は、安全市場での機会と貿易です。取引の安全な時間による一貫した収益。
EAはトランザクション・ボリュームを最小にして、利益閉鎖アルゴリズム戦略を最大にするために1オーダ・モードを使用します。
いいえグリッド取引。
裁量はない。
ヘッジなし。
マルチンゲール
Please download the setting file and the PDF file of the back test report in the product comment area
Recommendations
Broker Deriv. Developed for M1, Crash 500 Index. Backtest: Deposit $100 DD=0.53% 15 Months Profits= $30069 Developed for M1, Crash 500 Index. Backtest: Deposit $100 DD=2% 15 Months Profi

私たちのインジケーターは、複数のペアのスプレッドを同時に監視するスプレッドスクリーナーを提供します。また、キャンドルタイマーのカウントダウンは、現在のバーが閉じて新しいバーが形成されるまでの残り時間を表示します。
期間限定オファー:すべてのプレミアムインジケーターはわずか50ドルでご利用いただけます。MQL5ブログにアクセスすると、プレミアムインジケーターのすべての詳細を確認できます。 ここをクリック。
主な機能 同時に広がるマルチペアを監視します。 現地時間ではなく、サーバー時間を追跡します。 構成可能なテキストの色とフォントサイズ CPU使用率を削減するために最適化 ペアのパーソナライズされたリスト。 コンタクト ご不明な点がある場合やサポートが必要な場合は、プライベートメッセージでご連絡ください。
警告 警告すべてのインジケーターとツールは、公式のMetatrader Store(MQL5 Market)からのみ入手できます。
著者 SAYADI ACHREF、フィンテックソフトウェアエンジニアおよびFinansyaの創設者
FREE

KT Equity Protector EA consistently monitors the account equity and closes all the market and pending orders once the account equity reached a fixed equity stop loss or profit target. After closing all trading positions, the EA can close all open charts to stop other expert advisors from opening more trading positions.
Equity Stop-Loss
If your current account balance is $5000 and you set an equity stop loss at $500. In this case, the KT Equity Protector will close all the active and pending
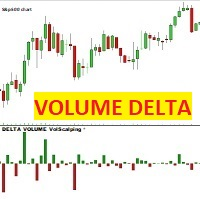
VOLUMEDELTAVolscalping このインジケーターは、価格キャンドルごとに、売買された契約の差であるデルタキャンドルを描画します。 ビッドで取引された(販売された)契約がアスクで取引された契約を超える場合、ろうそくは赤でマイナスになります。逆に、ASKで取引された(購入された)契約がビッドで取引された契約を超える場合、キャンドルは緑でポジティブになります。
注意:このインジケーターは、実際の市場データフローを提供し、契約をBIDとASKに分割するブローカーでのみ機能します。 外国為替、CFD、暗号通貨は合成市場に属しており、実際の市場データフローがないため、インジケーターは機能しません。 デモ口座があっても、預金なしで実際の市場データフローを提供するブローカーは、AMPFUTUREブローカーです。 インデックス、コモディティ、実際の市場で取引されるコモディティ(CME、EUREX、ICEなど)で動作します

The Supertrend indicator was originally created by a french fellow named Olivier Seban , and its goal is to identify the Primary Trend of prices . Its calculation is easy and based on the average of Highs and Lows and then we add the volatility of a custom period, plus a multiplier. This way we get the Supertrend Line. You can find in the web several approaches and trading strategies using this very useful indicator.
HOW TO "READ" THIS INDICATOR
If the closing prices are above Supertrend Line
FREE
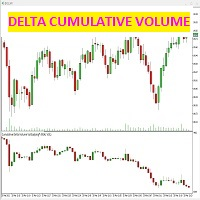
このインジケーターは、各ろうそくのビッドとアスク(アグレッシブ)で成立した契約の違いを検出します。
インジケーターは、価格チャートの下の専用ウィンドウに、販売された契約と購入された契約の違いによって正確に与えられたキャンドルを示します。これは、市場のボリュームの強さを生み出します。
累積ローソク足デルタチャートのみを選択する方法、またはキャンドル自体のトレンドラインを使用する方法も可能です。2番目のボックスu "NONE"を選択すると、トレンドラインは描画されませんが、色を選択すると、ボリュームキャンドルのトレンドラインは、それらと一緒にチャートに表示されます。
この指標は何のためのものですか?価格チャートをボリュームデルタチャートと比較すると、市場の真の強さを確認できます。2つのチャートの収束により、価格の正しい上昇/下降が決定されますが、価格とボリュームデルタの相違はシグナルアラートである必要があります。トレーダーにとっては、価格が逆転するはずだからです。この指標は、取引戦略と一緒に使用して、誤ったシグナルをフィルタリングし、価格と出来高の間の相違の段階で発生するシグ
概要:
ストラドルスカルパーは、特定の時間および/または日にまたがるEAオープニングです。 Take Profitは、ATR比率を使用して動的に生成されます。
要件:
ストラドルを開くには、ヘッジ口座が必要です。 (始値での)厳密な最適化は必須です。
ストラドルとは何ですか?
ストラドルは、買いと売りを同時に開くアクションです。
このEAはどのように機能しますか?
最適化に成功した後、EAは最適化によって指定された新しいバー(H1タイムフレーム)ごとにストラドルを開きます。 新しい取引を開始する決定は、必要な最小ボラティリティ(ATRによって測定され、取引履歴にわたって統計的に測定されます)に従って行われます。 テイク利益は、最適化によって計算されたATR比率に従って動的に配置されます。 同時に1つか2つの取引しかあり得ず、テイクプロフィットまたは新しいバーによってクローズされます。 このEAは、ヘッジ、グリッド、マルチンゲールのシステムを使用していません。
最適化する方法は? 写真を見てください。最適化セットファイルの基本設定を示しているものがありま
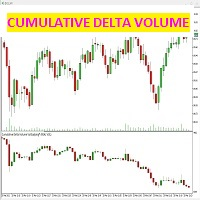
このインジケーターは、各ろうそくのビッドとアスク(アグレッシブ)で成立した契約の違いを検出します。
インジケーターは、価格チャートの下の専用ウィンドウに、販売された契約と購入された契約の違いによって正確に与えられたキャンドルを示します。これは、市場のボリュームの強さを生み出します。
累積ローソク足デルタチャートのみを選択する方法、またはキャンドル自体のトレンドラインを使用する方法も可能です。2番目のボックスu "NONE"を選択すると、トレンドラインは描画されませんが、色を選択すると、ボリュームキャンドルのトレンドラインは、それらと一緒にチャートに表示されます。
この指標は何のためのものですか?価格チャートをボリュームデルタチャートと比較すると、市場の真の強さを確認できます。2つのチャートの収束により、価格の正しい上昇/下降が決定されますが、価格とボリュームデルタの相違はシグナルアラートである必要があります。トレーダーにとっては、価格が逆転するはずだからです。この指標は、取引戦略と一緒に使用して、誤ったシグナルをフィルタリングし、価格と出来高の間の相違の段階で発生するシグ

THIS EA HAD A WINRATE OF 80% !!!
How to use: The EA must be attached to ONLY one chart Symbol must be EURUSD . Timeframe should be M5. Minimum deposit 100 USD. Recommended leverage 1:50 - 1:500. The EA should run on a VPS continuously. Recommended Inputs:
Use Risk Percent: true Risk Percent: 1 Lot Size: 0.01 Target Points: 100 Magic Number: 123456789
Recommended broker: XM or any broker that has a lower spread. If you choose XM as your broker please select MT5 for trading platform type
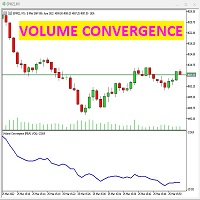
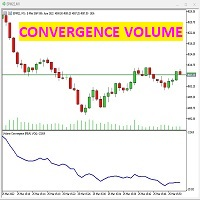
この指標は、価格に対する実際のボリュームの強さを示します。 価格チャートとボリュームトレンドが同じトレンドである場合、それはすべてが規則的であることを意味します。指標が価格チャートから逸脱している場合、それは反転が近いことを意味します。 価格が上昇し、「ボリュームコンバージェンス」チャートが下がると、それはお金が市場から出て、売り手が上昇して売り、価格がすぐに急落し始めることを意味します。 逆に、「出来高収束」グラフが上昇し、価格グラフが下降した場合、それは買い手がマイナス面で購入していることを意味し、価格は逆転するはずです。 インジケーターは、同じの誤ったシグナルをフィルタリングするために有効な取引戦略と組み合わせる必要があります。
注意:インジケーターは、実際のボリュームデータフローを提供するブローカーでのみ機能し、BIDANDASKで契約が分割されます。 CFD、暗号通貨、外国為替は合成の規制されていない市場に属しているため、これらの情報はなく、その結果、インジケーターは機能しません。
デポジットを必要とせずにデモ口座で実際のデータフローを提供するmt5と互換性のあ

TradersToolboxOverwatch-すべてのTradersToolbox実行中のインスタンスの監視ユーティリティです。
これは、シンプルなチャート切り替えユーティリティであり、すべての Traders Toolbox ランニングチャートのマーケットウォッチです。
特徴:
1.カスタマイズ可能なボタンの色、行、列。
2. 3つのシグナルタイプ(ホールド-イエロー/セル-レッド/バイ-グリーン)
3. Traders Toolbox の新規またはクローズされたインスタンスに応じてボタンリストを動的に更新します
4.シングルクリックボタンは、関連するチャートを前面に表示します。
5.売買シグナルは、 Traders Toolbox チャートシグナルと一致するパーセンテージでシグナル強度を示します。
注意:ユーティリティは、 Traders Toolbox / Traders Toolbox Lite と組み合わせてのみ使用でき、独立して機能することはできません。
Traders Toolbox との取

For more detailed description of the inputs please enter our comunnity ( https://discord.gg/UjxeJK9SsN )
Automatic calculation of Stop Loss and Take Profit based on Volatility. You can configure 5 stops and 5 takes difereent volatilities. You can choose between a variable account (Lots gonna go up or down based on the account capital) or a fixed account based on the input. In case you want a currency conversion between account and symbol, example USD account to EUR symbol, or another currency
FREE

The Analytical cover trend indicator is a revolutionary trend trading and filtering solution with all the important features of a trend tool built into one tool! The Analytical cover indicator is good for any trader, suitable for any trader for both forex and binary options. You don’t need to configure anything, everything is perfected by time and experience, it works great during a flat and in a trend.
The Analytical cover trend indicator is a tool for technical analysis of financial markets

According to Sir Isaac Newton's 3rd law, every action has its reaction and every movement must be compensated by an opposite movement of equal magnitude. The market cannot be oblivious to this physical principle, so when the force of gravity in the market of the big sharks hides like the sun behind the horizon, the night session allows us to see this law in all its splendor. This EA takes advantage of this movement to trade in the night session . Newton´s third law is designed to operate in the
Smart Moving Averages Indicator Smart Moving Averages is an exclusive indicator for Metatrader platform.
Instead of calculating moving averages for the selected chart time frame, the Smart Moving Averages indicator gives you the opportunity to calculate moving averages independently from the chart time frame.
For instance you can display a 200 days moving average in a H1 chart.
Inputs of the indicator are:
Timeframe : timeframe to be used for the calculation of the moving average Perio

Bar Strength Divergence Indicator BarStrength Indicator is an exclusive indicator to trade Forex, Stocks, Indices, Futures, Commodities and Cryptos.
BarStrength Indicator shows the strength of each candle.
The indicator shows in a separate windows candles relatively to 2 price levels representing resistance and support in the market.
Once candle is near resistance it is highly probable that price movement will change direction and will go down in the next candles.
Once candle is near sup

OBOS indicator
OBOS Indicator is an exclusive indicator to spot entries based on price action.
The OBOS Indicator is both effective and user friendly.
Indicator uses simple color codes and levels to indicate Overbought and Oversold conditions. No more headache.
The OBOS Indicator will only gives you indication when there are possible entries. Means you only get useful information.
Inputs of the indicator are:
MaxBars : number of bars to display in your chart Smoothing period : numb

Good afternoon, dear traders! I am glad to present you my new trading system - Cat Scalper MT5! The launch price of the EA is now reduced! Last week of discounted prices! The adviser's strategy is evening trading using a dynamic channel. The EA trades one trade using stop loss and take profit. Multicurrency Expert Advisor. You can test your symbols by entering their names in the parameters. I recommend using the default settings. The working timeframe (including for tests) is M15 only!

HighLow Arrow Indicator HighLow Arrow is a simple indicator to be used to signal major lows and major highs in your chart.
This indicator is not intended to be used to trade alone but more as an alert that a turning point might be forming.
In this case the HighLow Arrow indicator signals that a new high or a new low is forming and that traders can prepare for seeking new signals.
The formation of the High or the Low is confirmed after 2 bars have been closed. In the meantime, the alert ca
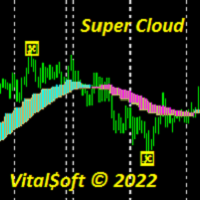
The Super Cloud indicator helps to determine the direction of the trend when trading. Shows on the chart signals about a possible upcoming trend change. The indicator provides an opportunity to detect various features and patterns in price dynamics that are invisible to the naked eye. Based on this information, traders can anticipate further price movement and adjust their strategy accordingly. Works on all timeframes except MN.

Tick imbalance bars (TIB), described in the book Advances in Financial Machine Learning (2018) by Marcos López de Prado. Indicator that show candlestick bars with an different sampling method than time fixed. Real time data is sourced to the indicator and it may be used as substitute of the default graph. Each bar is formed when a predefined tick balance is exceeded, showing in the graph the OHLC of this cluster of ticks. The input variable is the amount of ticks of each bar. The indicator may
FREE
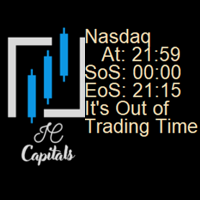
This indicator shows you the time of the opening and close of the trading time of every symbol. If it's out of the trading time it will show you a message in the screen, you can choose "PT-BR" or "ENG". For future updates i want to trigger a sound alarm in the preset value by the client for the opening of positions and closement of all positions.
If you want anything more than that just message me in the community ( https://discord.gg/P5mcttvXgw ) and I will update it for you!
FREE

Assistant_for_Reopen - an Expert Advisor that helps to re-set pending orders. Many brokers force the order to expire at the end of the trading session or at the end of the trading day. Therefore, a trader has to restore all pending orders manually every time at the beginning of a new trading session. Assistant_for_Reopen frees the trader from this routine work. It controls expiration by the order expiration time and resets it if the trader ticked the checkbox. The maximum number of orders the EA
FREE

NO MARTINGALE, NO HEDGE, NO GRID, NO SCALP, YES TP/SL , YES Pending Order This EA takes 200-300 Trades per year Best results are on Low Spread ECN Broker
TF: H1 Pair: XAUUSD Leverage: 1:100
Settings: (All settings in screenshot) mmLots= 0.1 - Fix lot setting ExitAtEndOfDay = false - enable or disable exit end of day ExitOnFriday = true - enable or disable exit on Friday FridayExitTime = 19:00 - time exit on Friday

Daily Pivots Multi Indicator Daily Pivots Multi is an exclusive indicator to draw your pivots levels and much more.
Most indicators draw daily pivots for the day. Daily Pivots Multi is able to draw levels for different days.
The indicator can do the calculation for unlimited number of days backward. It means that you can draw the levels for today but also for the past days.
This is very useful if you want to study a strategy with Pivots levels over a period of time.
Another problem is th
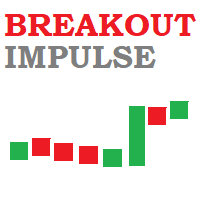
Breakout Impulse Indicator Breakout Impulse Indicator is a pattern recognition indicator for Forex, Stocks, Indices, Futures, Commodities and Cryptos.
The Breakout Impulse is a multi-bar pattern.
The purpose of the pattern is to identify a fast change in momentum.
This type of change can announce the start of a big directional move.
Inputs of the indicator are:
Distance : distance in pixel relative to top or bottom of candle to display the arrow symbol MaxBars : number of bars back u
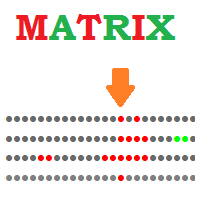
Matrix Indicator Matrix Indicator is a simple but effective indicator.
Matrix indicator displays usual oscillators indicators in a user friendly color coded indicator.
This makes it easy to identify when all indicators are aligned and spot high probability entries.
Inputs of indicator are:
Indicator: RSI, Stochastic, CCI, Bollinger Bands Param1/Param2/Param3: usual settings for the indicator ValueMin: Oversold level for oscillator ValueMax: Overbought level for oscillator The indicator

This EA allows you to manage support and resistance zones on MetaTrader 5…but not only: To your buying and selling zones (you can configure 2 sellings zones and 2 buyings zones),
you can add 3 options (2 with multiframes) to enter a position:
Option 1: this is the option that enters a position without a signal: as soon as the price reaches the zone, the robot sends a trade.
Option 2: here the robot will wait for a break in the selected timeframe. Example: you put your zones on an H4 graph

Professional robot Move reliably , which implements the classic MACD trading strategy. The signal from the intersection of the signal line with the main MACD line. When the signal line crosses the main line from top to bottom, it will be a buy signal, if the signal line crosses the main line from bottom to top, it will be a sell signal. In other cases, the absence of a signal will be recorded. Also, the signal can be inverted. The principle of operation is very simple and reliable. Gives a smal

The indicator is a trading system for AUDUSD or NZDUSD currency pairs.
The indicator was developed for time periods: M15, M30.
At the same time, it is possible to use it on other tools and time periods after testing.
"Kangaroo Forex" helps to determine the direction of the transaction, shows entry points and has an alert system.
When the price moves in the direction of the transaction, the maximum length of the movement in points is displayed.
The indicator does not redraw, all actio

Meta Crypto Bot EA For For Binance Bot is a automatic trading Bot for Binance. EA use metatrader terminal to open trade on your Binance account. This is quantification system adopts a simple grid trading strategy, to make trade everyday. Users only need to select the corresponding investment style and click a key to start, and they can realize smart fool-style financial management. The system will intelligently match the corresponding quantification strategy according to the market situation. Cu

Trend Direction ADX indicator Trend Direction ADX is part of a serie of indicators used to characterize market conditions.
Almost any strategy only work under certain market conditions.
Therefore it is important to be able to characterize market conditions at any time: trend direction, trend strength, volatility, etc..
Trend Direction ADX is an indicator to be used to characterize trend direction:
trending up trending down ranging Trend Direction ADX is based on ADX standard indicator.

Trend Strength MA indicator Trend Strength MA is a part of a series of indicators used to characterize market conditions.
Almost any strategy only works under certain market conditions.
Therefore, it is important to be able to characterize market conditions at any time: trend direction, trend strength, volatility, etc.
Trend Strength MA is an indicator to be used to characterize trend strength:
Up extremely strong Up very strong Up strong No trend Down strong Down very strong Down extrem

Trend Direction Up Down Indicator Trend Direction Up Down is part of a series of indicators used to characterize market conditions.
Almost any strategy only works under certain market conditions.
Therefore it is important to be able to characterize market conditions at any time: trend direction, trend strength, volatility.
Trend Direction Up Down is an indicator to be used to characterize trend direction (medium term trend):
trending up trending down ranging Trend Direction Up Down is ba

Please enable this site https://openexchangerates.org/ on webrequest options on Tools -> Options -> Expert Advisors
this utility has it's function as a updater of your's database with the currency conversions of the day, all the days, and all the Currency Pairs. My Expert Advisors and Indicators who make auto calculation to show the lot take this data to guide their calculation, in relation to a account currency and a pair curreny who isn't the same as the account. Sample account in USD and

KT Coppock Curve is a modified version of the original Coppock curve published in Barron's Magazine by Edwin Coppock in 1962. The Coppock curve is a price momentum indicator used to identify the market's more prominent up and down movements.
Features
It comes with up & down arrows signifying the zero line crossovers in both directions. It uses a simplified color scheme to represent the Coppock curve in a better way. It comes with all kinds of Metatrader alerts.
Applications It can provide

A new box will be added, if the closing price is higher than the maximum (lower than the minimum) of the current box series no less than for the specified value. Reversal will be made, if the closing price is higher (lower) than the last box on a value no less than the specified.
T his is a trend indicator and it can be used as an alternative for the trend definition instruments which use averaging.
FREE
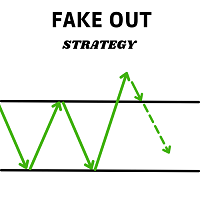
This expert advisor finds and operates the Fake out pattern, the search algorithm and its management can be adjusted from the Bot's configuration parameters.
Features: - Designed to operate with any type of asset.
- It is possible to set the time range in which the expert advisor will operate.
- Trailing stop managed internally by the algorithm.
- Partial position closing (partial profit taking), when the price has moved in favour of the position.
- Take profit automatically adjusted

KT Volume Profile shows the volume accumulation data as a histogram on the y-axis providing an ability to find out the trading activity over specified time periods and price levels.
Point of Control (POC) in a Volume Profile
POC represents a price level that coincides with the highest traded volume within the whole volume profile histogram. POC is mostly used as a support/resistance or as an essential price level where market retest before going in a specific direction.
Features Very easy

Alert System You use function keys to create horizontal lines for alerts. 1. Allow set horizontal line properties (line color, line style, line width, ...) for alerts. 2. Allow add text to horizotanl line. You can hide or show text when you need. You can change text and its price, but time of text will be set in input named "text_time" (0 is current time, you should test this input with -1, -2, -3 or lower). 3. It has 2 types of alert: above and bellow. You can set key to create them. If price i
FREE
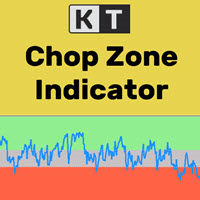
It's a well-known fact that most of the financial markets trend only 30% of the time while moving in a closed range rest 70% of the time. However, most beginner traders find it difficult to see whether the markets are trending or stuck in a range. KT Chop Zone solves this problem by explicitly highlighting the market phase into three zones as Bearish Zone, Bullish Zone, and Chop Zone.
Features
Instantly improve your trading by avoiding trade during the sideways market (Chop Zone). You can al

KT Trend Magic shows the trend depiction on chart using the combination of market momentum and volatility. A smoothing coefficient is used to smooth out the noise from the signal.It can be used to find out the new entries or confirm the trades produced by other EA or indicator.
Features
Drag n drop MTF scanner which scans for the new signals across multiple time-frames. Find new entries in the trend direction. Improve the accuracy of other indicators when used in conjunction. Can be used as a

Highly configurable Relative Vigor Index (RVI) indicator.
Features: Highly customizable alert functions (at levels, crosses, direction changes via email, push, sound, popup) Multi timeframe ability ( higher and lower timeframes also) Color customization (at levels, crosses, direction changes) Linear interpolation and histogram mode options Works on strategy tester in multi timeframe mode (at weekend without ticks also) Adjustable Levels Parameters:
RVI Timeframe: You can set the lower/highe
FREE

主要城市的时间。北京时间、东京时间、悉尼时间、惠灵顿时间、纽约时间、法兰克福时间、伦敦时间、迪拜时间。 城市时间可选择开启或者关闭。 点差变色提醒。设置点差提醒点数,例如,设置100点,点差大于100点,文字会变红色。 Time in major cities. Beijing time, Tokyo time, Sydney time, Wellington time, New York time, Frankfurt time, London time, Dubai time. City time can be turned on or off. Dot difference color change reminder. Set the point difference reminder points. For example, set 100 points. If the point difference is greater than 100 points, the text will turn red.
FREE

Only 5 copies of the EA at $30! Next price --> $45 This robot works on the basis of bowling band and has stepped entrances at safe points.
benefits:
Works on all instruments and time series,
It has excellent inputs for position management that can avoid a lot of risk.
Input settings:
Volume: Selects a fixed volume for the trade that uses its own risk management if it is zero.
Risk for all positions: The amount of risk for all positions in one direction,

Demo Version can be run only in Strategy tester.
Breakout with Zigzal Recommended trading indicators 1. Calculate breakout point from zigzag 2. You can adjust the zigzag parameters. 3. Calculate Takeprofit and Stoploss 4. Calculate Open Order Point 5. The indicator uses a custom proprietary non-redrawing ZigZag for determining patterns, therefore the indicator never repaints its signals. 6. You can adjust Zone of SideWay in Zigzal.

Ea correlation ,
MT5 : 51099762 Pass : McTrader9 Sever : Peperstone Markets-MT5-Live01
The robot is designed to issue orders in two pairs simultaneously. using the principle of difference of currency pairs. The robot will find the difference of two currency pairs. as we fill out and issue orders. Can work in two currency pairs simultaneously. and close orders in two pairs at the same time. Able to close a variety of orders as we define.

BEHOLDD!!!!!!!
Investogenie is now in the Market. The Profound Algorithm designed in investogenie helps in scalping in the quiet time at night with a Stop Loss. The Markets conditions help the EA to decide taking the entries and exits at the proper time. Backtests and results are evident of the strength of the product.
Live results will be updated soon.
RECOMMENDATION
PAIRS: All Currency pairs
TIMEFRAME: This is Designed on M5 only
Use the set file in comment 3 or DM me
LI

DreamlinerEA Live Results: https://www.mql5.com/en/signals/1459431
DreamlinerEA MT4 version: https://www.mql5.com/en/market/product/72691 DreamlinerEA is a fully automated Expert Advisor based on the author's trading strategy. During a period of low market volatility, when liquidity is not enough for the formation of a trend and breakdown of important levels, the system trades in the Channel and use small TP values (scalping) to quickly fix profit and re-enter the market, which sign

KT Risk Reward shows the risk-reward ratio by comparing the distance between the stop-loss/take-profit level to the entry-level. The risk-reward ratio, also known as the R/R ratio, is a measure that compares the potential trade profit with loss and depicts as a ratio. It assesses the reward (take-profit) of a trade by comparing the risk (stop loss) involved in it. The relationship between the risk-reward values yields another value that determines if it is worth taking a trade or not.
Featur
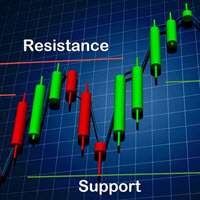
Be sure to consult with me before buying.
The robot trades based on support and resistance levels. You can use weekly and monthly times for less risk. More risk in daily and 4-hour times. Be sure to disable the robot at news times.Works on all currency pairs, indices, commodities and metals. Only observing the trade at the time of news will make this robot profitable. Automatic news management will be added in future versions.
benefits:
Works on all instruments and time series,
MetaTraderマーケットは自動売買ロボットとテクニカル指標を販売するための最もいい場所です。
魅力的なデザインと説明を備えたMetaTraderプラットフォーム用アプリを開発するだけでいいのです。マーケットでプロダクトをパブリッシュして何百万ものMetaTraderユーザーに提供する方法をご覧ください。
取引の機会を逃しています。
- 無料取引アプリ
- 8千を超えるシグナルをコピー
- 金融ニュースで金融マーケットを探索
新規登録
ログイン