YouTubeにあるマーケットチュートリアルビデオをご覧ください
ロボットや指標を購入する
仮想ホスティングで
EAを実行
EAを実行
ロボットや指標を購入前にテストする
マーケットで収入を得る
販売のためにプロダクトをプレゼンテーションする方法
MetaTrader 5のための有料のテクニカル指標 - 837

簡単に本当の市場の強さを見抜く — 初心者でも安心。
MSI(モメンタム・シャドウ・インジケーター)は初心者にもプロにも最適です。
市場に本当に勢いがあるかどうかを示してくれるので、自信を持って「買い」や「売り」の判断ができます。 迷わない。推測しない。
本物かどうかを教えてくれるシンプルなラインだけ。 とても使いやすい — すべてのレベルに対応
明確な売買シグナル
20分以上のチャートで最も効果的、スキャルピングにも対応 合成ボラティリティ指数で最も効果を発揮します。ニュースの影響を受けないため、純粋なモメンタムシグナルを得られます。
仕組み:
チャート上に3本のラインを表示: 短期トレンドライン(黄色) 長期トレンドライン(青色) 過去の価格を追うモメンタムシャドウライン(白色) 上昇シグナル:
価格が黄色と青色のラインを上抜け、シャドウも上にある場合:
強い上昇モメンタムを示し、買いのチャンス。 下降シグナル:
価格が両ラインを下抜けし、シャドウも下にある場合:
強い下降モメンタムを示し、売りのチャンス。 シャドウが価格と一致していない場合、モメンタムが

The Accumulation and Distribution indicator is a volume-based indicator that was essentially designed to measure underlying supply and demand. This is accomplished by trying to determine whether traders are actually accumulating (buying) or distributing (selling). This is accomplished by plotting a cumulative total of the money flow volume for each period. This indicator can reveal divergences between volume flow and actual price to primarily affirm a current trend or to anticipate a future reve

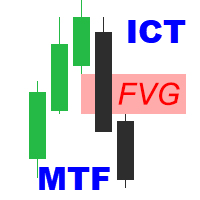
ICT Fair Value Gaps MTF Unlock the power of Fair Value Gaps (FVGs) across multiple timeframes using the ICT Fair Value Gaps Multi - Timeframe Indicator —a precision tool built for traders who follow the Smart Money Concept (SMC) . Key Features : Multi-Timeframe FVG Detection : Automatically identifies Fair Value Gaps from higher timeframes (M15, H1, H4, etc.) and plots them on your active chart for immediate insight. Break of Structure (BOS) & Change of Character (CHoCH): Clearly marked BOS

When there is no position, when changing the color, you can consider opening an order. With the fluctuation of the market, when the current color changes again, you need to close the position and leave. Suitable for different cycles, the trading rules are simple and require friends to explore on their own.
I hope friends who use this indicator can make a lot of money, rolling bigger and bigger like a snowball. thank you!

The TrendKiller Oscillator is a custom MetaTrader 5 (MT5) indicator designed to help traders analyze price deviations from a moving average, displayed in a separate window. It calculates the difference between a chosen price (e.g., close) and a moving average (default: 14-period SMA), producing a detrended value that oscillates around a zero line. Dynamic maximum and minimum levels, computed over a user-defined period (default: 50 bars), provide context for identifying overbought/oversold condi

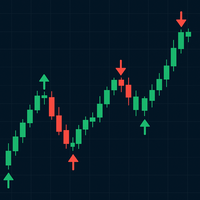
Trend Mark is a versatile trading indicator designed to highlight high-probability entry points using visually intuitive arrows directly on the chart. It analyzes price action and market momentum to identify potential trend reversals or continuations, displaying upward or downward arrows when specific trade conditions are met. Suitable for both beginners and experienced traders, Trend Mark can be used across multiple timeframes and instruments, making it a powerful tool for scalping, day trading
MetaTraderマーケットはトレーダーのための自動売買ロボットやテクニカル指標を備えており、 ターミナルから直接利用することができます。
MQL5.community支払いシステムはMetaTraderサービス上のトランザクションのためにMQL5.comサイトに登録したすべてのユーザーに利用可能です。WebMoney、PayPal または銀行カードを使っての入金や出金が可能です。
取引の機会を逃しています。
- 無料取引アプリ
- 8千を超えるシグナルをコピー
- 金融ニュースで金融マーケットを探索
新規登録
ログイン