YouTubeにあるマーケットチュートリアルビデオをご覧ください
ロボットや指標を購入する
仮想ホスティングで
EAを実行
EAを実行
ロボットや指標を購入前にテストする
マーケットで収入を得る
販売のためにプロダクトをプレゼンテーションする方法
MetaTrader 5のための有料のテクニカル指標 - 7

** All Symbols x All Timeframes scan just by pressing scanner button ** *** Contact me after the purchase to send you instructions and add you in "M W Scanner group" for sharing or seeing experiences with other users. Introduction: Double Top(M) and Double Bottom(W) is a very repetitive common type of price reversal patterns. Double Top resembles M pattern and indicates bearish reversal whereas Double Bottom resembles W pattern and indicates a bullish reversal that they have high win r

I recommend you to read the product's blog (manual) from start to end so that it is clear from the beginning what the indicator offers. This multi time frame and multi symbol supply and demand zone dashboard indicator sends alerts when the price has reached a supply/demand zone. It is also possible to use it to be alerted about regular double tops/bottoms instead of zones. It can be used with all time frames from M1 to MN. Maximum 9 time frames can be shown in the dashboard at the same time.

ゴールドターゲットは最良のトレンド指標です。 このインジケーターの独自のアルゴリズムは、テクニカル分析と数学的分析の要素を考慮して資産価格の動きを分析し、最も収益性の高いエントリーポイントを決定し、矢印の形でシグナルと価格レベル(買いエントリー/売りエントリー)を発行します。 注文を開きます。 このインジケーターには、ストップロスの価格レベルとテイクプロフィットの 5 つの価格レベルもすぐに表示されます。
注意: このインジケーターは非常に使いやすいです。 ワンクリックでチャートにインジケーターをインストールし、そのシグナルと価格レベルに基づいて取引します。
インジケーターの利点:
1. インジケーターは高精度の信号を生成します。 2. インジケーター信号は再描画されません。 価格が各ラインを超えた場合に音声通知(アラート&メッセージ)を搭載しています。 3. どのブローカーの MetaTrader 5 取引プラットフォームでも取引できます。 4. あらゆる資産(通貨、金属、暗号通貨、株、指数など)を取引できます。 5. 任意の時間枠で取引できます (M15-M30

Harmonic patterns are characteristic series of price movements with respect to Fibonacci levels, which statistically precede price reversals. This indicator searches for harmonic patterns. It is capable of recognising 26 classical and non-classical harmonic patterns : Classical Gartley Butterfly Alternate Butterfly Bat Alternate Bat Crab Deep Crab Three Drives Non-classical Shark Alternate Shark Cypher 5-0 Anti Gartley Anti Butterfly Anti Alternate Butterfly Anti Bat Anti Alternate Bat Anti Crab
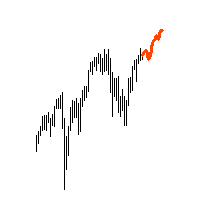
"AV Forecast MT5" is a preview or forecast indicator for MetaTrader 5, which draws forecast future price changes on the chart based on historical data. To do this, it primarily uses the everyday rhythm and the seasonality of the year. For timeframes below H1 closer dates can be selected. The lines for calculation can be made visible.
Settings:
- Draw line for x candles: draw x candles in the future
- Show all lines: yes/no
- Look back years or mixed (> H1 same): one year back or less b

The indicator show Higher timeframe candles for ICT technical analisys Higher time frames reduce the 'noise' inherent in lower time frames, providing a clearer, more accurate picture of the market's movements.
By examining higher time frames, you can better identify trends, reversals, and key areas of support and resistance.
The Higher Time Frame Candles indicator overlays higher time frame data directly onto your current chart.
You can easily specify the higher time frame candles yo

Elliot Waves Analyzer Pro calculates Elliot Waves to Help Identify Trend direction and Entry Levels. Mainly for Swing Trading Strategies. Usually one would open a Position in trend direction for Wave 3 or a Correction for Wave C . This Indicator draws Target Levels for the current and next wave. Most important Rules for Elliot Wave Analysis are verified by the Indicator. The Pro version analyzes Multiple Timeframes and shows the Subwaves and Target-Levels. For an Overview " Elliot Waves Anal

The Breakout Line in technical analysis serves as a crucial tool for understanding market dynamics and potential shifts in price direction. It's designed to highlight rapid accelerations or declines in the market's trajectory. Unconventional Analysis : The Breakout Line is not your typical technical indicator; it's tailored to capture swift market movements, offering a unique perspective on price trends. Angle of the Breakout Line : The sharper the angle formed by the Breakout Line, the stronger

Description Helps you detect the structure of the market, using different types of Smart Money concepts. This should help you to upgrade your trading strategy in every way. Smart Money Features: Color candle to signal the type of structure Shows CHOCH and BOS Equal Lows and Highs Order Blocks Internal and Swings Weak and strongs high and lows Fair Value Gaps High and Lows in daily weekly and monthly timeframes Premium and discount Zones KEY LINKS: How to Install – Frequent Questions - All

KT Momentum Arrows Indicator is based on a momentary breakout which is calculated using the bands deviation and emerging volatility in a certain direction. A buy signal is generated when the price closes above the upper band and a sell signal is generated when the price closes below the lower band. A magnitude coefficient is used as the input which affects the band deviation and volatility at the same time. The coefficient value should be carefully selected and analyzed based on the instrument a

Trap Play refers to a market situation where price initially makes a new high or low, luring traders into believing a strong trend is forming. However, the price quickly reverses and invalidates the breakout, trapping those traders who entered positions based on the initial move. This sudden reversal often results in a rapid exit of positions, leading to significant price movement in the opposite direction. Trap plays can occur in various financial markets and timeframes and are characterized

KT Supply and Demand indicator identifies and plots key supply and demand zones. It achieves this by analyzing swing points and integrating them with a multi-timeframe analysis, ensuring that only the most crucial supply-demand zones are highlighted. This advanced method highlights the regions where prices are likely to reverse, stemming from significant supply-demand zones established by recent price movements.
Features
Precision Analysis: Our refined algorithm is designed to accurately pi

Brilliant Reversal Indicator for MetaTrader 5 - Your Ultimate Alert-Driven Trading Solution Unlock unparalleled trading success with the "Brilliant Reversal Indicator" tailored for MetaTrader 5. This powerful tool has been meticulously designed to empower traders by identifying critical reversal opportunities with lightning-fast alerts. Key Features: Precise Reversal Detection: The Brilliant Reversal Indicator for MT5 specializes in pinpointing potential trend reversals, providing you with a str

Market volume profile indicator. It works on almost all instruments - currency pairs, stocks, futures, on real volumes and on ticks. It can be set as automatic determination of the range of building a profile, for example, for a week or a month, etc. and set the range manually by moving the borders (two vertical lines red and blue). Shown as a bar graph. The width of the histogram at a given level means, conventionally, the number of trades made on it. With the "Mode level line color" para

M & W Pattern Pro is an advanced scanner for M and W patters , it uses extra filters to ensure scanned patterns are profitable.
The indicator can be used with all symbols and time frames.
The indicator is a non repaint indicator with accurate statistics calculations.
To use , simply scan the most profitable pair using the statistics dashboard accuracy , then enter trades on signal arrow and exit at the TP and SL levels.
STATISTICS : Accuracy 1 : This is the percentage of the times price hit

Flag Pattern pro is a Price Action (PA) analytical tool that scans the continuation patterns known as "Flag and Pennant Patterns" .
Flag and Pennant patterns are continuation patterns characterized by a move in a previous trend direction after a shallow retracement usually below 50% of the original move . Deep retracements can however be sometimes found at the 61.8 % levels. The original move is know as the flag pole and the retracement is called the flag.
Indicator Fun

Ultimate Reversal Scanner (Multi Pair And Multi Time Frame) : ---LIMITED TIME OFFER: NEXT 25 CLIENTS ONLY ---46% OFF REGULAR PRICE AND 2 FREE BONUSES ---SEE BELOW FOR FULL DETAILS Reversal patterns are some of the most widely used setups in the institutional trading world.
And the most (statistically) accurate pattern of them all is called the ' Three Line Strike '. According to Thomas Bulkowski ( best selling author and a leading expert on candlestick patterns ),
the ' Three Line Strike '

This multi indicator/oscillator (hereafter indicator), multi time frame and multi symbol indicator identifies when a divergence occurs between price and one, two or three indicators. It identifies both regular/classical (trend reversal) and hidden (trend continuation) divergences. It has RSI and MA trend filter options which makes it possible to filter out only the strongest setups. Combined with your own rules and techniques, this indicator will allow you to create (or enhance) your own powerfu

MT5のアラート付きの自動固定範囲ボリュームプロファイル
この指標は、価格がより多くの時間を費やした場所を示し、取引に使用できる重要なレベルを強調しています。
また、特定の取引セッションの最も重要な価格レベル、バリュー エリア、およびコントロール バリューの概要を示す、経時的な価格密度を示すことができます。 このインジケーターは、M1 と D1 の間の時間枠に添付でき、日次、週次、月次、さらには日中のセッションの市場プロファイルを表示します。 時間枠が短いほど、精度が高くなります。 可視性を高めるには、より長い時間枠をお勧めします。 フリードローの長方形セッションを使用して、任意の時間枠でカスタム マーケット プロファイルを作成することもできます。 プロファイルのブロックを描画するために、6 つの異なる配色を使用できます。 プロファイルを単色ヒストグラムとして描画することも可能です。 または、強気/弱気バーに基づいてプロファイルを色付けすることもできます。 このインディケータは裸の価格アクションに基づいており、標準的なインディケータは使用しません。
バリュー エリアの高値

Volume Gives Depth To Price Action! Volume Critical can accurately locate the cheapest areas to place trades. Enter reversals as early as possible to get the best Risk Reward setups!
Features Aggressive algorithm that anticipates reversals Volume Classifications Gray Histograms - Normal Volume, average market activity Orange Histogram - Trending Volume, increased market activity Pink Histograms - Overbought Volume, we can wait for further confirmation to sell Blue Histograms - Oversold Condit

This product contains following indicators: (Lines + LineSAR + Channels + BTL + Ladder) Phi Lines - special EMAs, similar to MIMAs from Phicube; Phi LineSAR - erase and highlight Phi Lines in support or resistance. Similart to MIMASAR from Phicube; Phi Channels - show support and resistance, similar to Phibo from Phicube (Green and Read Lines); Phi BTL - candles color following Phi Lines alignment; Phi LADDER - Indicator that allow you to visualize possible targets.
FUTURO Tool Future to

Aiトレンドスポッター(Dオリジナルズ)。
外国為替の崩壊。
私たちはよく「 証券会社はどうやってお金を稼いでいるのですか? 」と尋ねますが、私たちは小さな取引で勝ったことを祝います。
しかし、(D Originals) を使用した後は、「どうやって一晩で金持ちになったのか?」と自問するでしょう。
とても深いので、行動は声よりも雄弁です。
Ai Trend Spotter を使用すると、次のことを恐れる必要はありません。
*市場操作
*相場反転
* スナイパーの登場と存在
*キャンドルジャンプ
このインジケーターは MT5 プラットフォームで取引可能なすべてのペアに対応しており、98.9% の取引能力を強化する 3 年間のプロジェクトです。
ぜひ手に入れて、使って、後で私に感謝してください。
あなたのスターがやって来ました
The idea of this trading system from the EMA with a Mediante price from the EMA indicators is based exactly 100% from Ripster47 trading system, me is just the person to create it on the MT5 platform, but with alerts for your own buy/sell settings. Hereby I make a copy from Ripster47 explanation for using that system: " EMA Cloud By Ripster
EMA Cloud System is a Trading System Invented by Ripster where areas are shaded between two desired EMAs. The concept implies the EMA cloud area

A must-have tool for any strategy based on divergence detection. 10 different oscillators can be used to detect divergences and can be combined with Double Top/Bottom patterns to confirm reversal signals. SCANNER is included . Now with Scanner you can find trading opportunities and setups easily and faster.
Features Easily detect strong reversal signals. 10 different oscillators are available for divergence detection. Divergence & Top/Bottom detection can operate independently or combined. Get
This indicator improves the "DMI Trend" so that the trend signal reacts faster than before.
---The indicator allows you to simplify the interpretation of signals produced by the classical ADX indicator.
The position of the hight bars of the histogram relative to zero and the histogram coloring indicate the direction of price movement determined by the intersection of DI+ / DI-.
The position of the hight bars of the histogram relative to zero and the color indicate the strength of the pric

To get access to MT4 version please click here . - This is the exact conversion from TradingView: "Hull Suite" By "Insilico". - This is a light-load processing and non-repaint indicator. - You can message in private chat for further changes you need. Here is the source code of a simple Expert Advisor operating based on signals from Hull Suite . #include <Trade\Trade.mqh> CTrade trade; int handle_hull= 0 ; input group "EA Setting" input int magic_number= 123456 ; //magic number input double fixe

To get access to MT4 version please click here . - This is the exact conversion from TradingView: "CM Super Guppy" by "FritzMurphy" - This is a light-load processing indicator. - This is a non-repaint indicator. - This is not a multi time frame indicator. - Buffers are available for the lines on chart. - You can message in private chat for further changes you need. Thanks for downloading
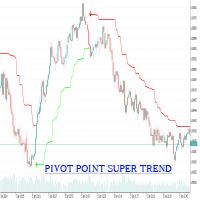
Introducing the Pivot Point SuperTrend MT5 version of the Trading View indicator by LonesomeTheBlue.
A revolutionary script designed to optimize your trading strategies by combining the power of Pivot Points with the precision of SuperTrend indicators. This unique algorithm offers an enhanced approach to identifying and staying within trends, delivering unparalleled performance in today's dynamic markets.
Key Features: Enhanced Trend Identification: By integrating Pivot Points and calculat

Display your Local Time on your charts
Now available for MT5 with new features! Display your local time instead of (or along with) MT5 server time.
Display crosshair to highlight current candle time.
Automatically adjusts based on chart zoom (zooming in or out).
Displays on every timeframe (M1 - Month, including all MT5 timeframes), and auto-adjusts as chart timeframe is changed.
Handles special ½ hour time zones , such as India.
Renders fast (no lag) as you scroll charts.

Displays multiple indicators, across multiple timeframes and symbols to give a comprehensive overview of the market. Uniquely, the indicators are configurable and can include custom indicators, even those where you just have the ex4 file or those purchased from Market. Standard indicators can also be selected, the default being ADX, CCI, market price above/below Moving Average (MA), Moving Average Cross (MAX), MACD, Momentum (MOM), OsMA, RSI, Parabolic SAR, William's Percentage Range (WPR). Use
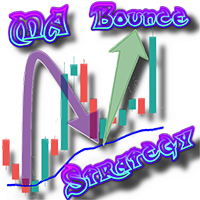
The MA Bounce Strategy is a strategy that seeks to long FX pairs on a strong uptrend as they bounce off their MA support and shorting FX pairs on a strong downtrend as they bounce off MA resistance. The best suitable periods of moving averages for that strategy are 18, 30, 50. This indicator helps to identify and find place for potential market entry by MA bounce strategy. More information about MA Bounce Strategy can be read by this link https://www.mql5.com/en/blogs/post/743037 . By defau

This indicator converted from 5 min Buy and Sell Range Filter - guikroth version on TradingView Popularity of the Range Filter
The Range Filter is a very popular and effective indicator in its own right, with adjustments to the few simple settings it is possible to use the Range Filter for helping filter price movement, whether helping to determine trend direction or ranges, to timing breakout or even reversal entries. Its practical versatility makes it ideal for integrating it's signals into
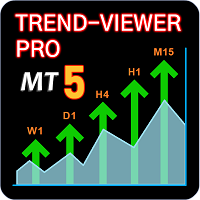
SEE THE TREND ON EVERY TIME FRAME. INTELLIGENT INDICATOR READS PRICE ACTION TO SPOT TRUE MARKET CYCLES AND TREND. This advanced multi-currency and multi-time frame indicator, reads trend in real-time so you always know the trends of the markets you want to trade.
Trend-Viewer Pro has been specifically designed to read the trend of every time frame and every market , simultaneously, making it much easier for you to find markets with time frame correlation , so you can focus on t

*Non-Repainting Indicator Bruce Webb Explains How To Use Bruce's Price Predictor In Detail And Free Forex Strategy https://youtu.be/hfoB1tZZpTo Bruce's Price Predictor is an indicator that shows precise price reversals. A great arsenal to add to any chart. Bruce's Price Predictor points price reversals with high degree of accuracy and it is great for scalping on the 1min time frame, Or swing trading on the 1hr time frame. Buy and sell arrows are shown on the chart as for entry signals. They do

What is the Volume Weighted Average Price (VWAP)? The volume weighted average price (VWAP) is a trading benchmark used by traders that gives the average price an instrument has traded at throughout the day, based on both volume and price. It is important because it provides traders with insight into both the trend and value of the instrument.
What is the Difference between VWAP and AVWAP? While VWAP is having as starting point the beggining of the day,week,month etc. in the AVWAP you can p
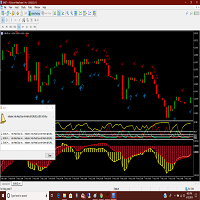
Adx and Macd are powerful indicators which can warn you of a change of direction. Put them together with this great indicator that will warn you of impending changes long before any ma lines cross. More screen shots on the MT4 version. Arrow indicates a solid macd cross and the check marks show the adx movements. You can trade the long term with the macd crosse and scalp the adx changes while you hold the main trend. Thanks for checking out my indicators.

NakaSideをご紹介します - あなたの究極の市場機会指標!
利益の出る取引の機会を見逃すことにうんざりしていますか?取引を次のレベルに引き上げる準備はできていますか?もう探す必要はありません。NakaSideが登場し、取引方法を革命へと導きます!
NakaSideは単なる一般的な指標ではありません。複雑な金融市場を自信を持ってかつ正確に航海するための秘密兵器です。高度なアルゴリズムと先進的なテクノロジーを駆使して、NakaSideは上昇トレンドと下降トレンドの両方でトレンドの変化を検出し、利益の出る機会を見つけるように設計されています。
NakaSideが上昇トレンドの変化を検出すると、鮮やかな緑色のドル記号が表示され、購入の機会があることを示します。逆に、トレンドが反転すると、目立つ赤いドル記号が表示され、売却の機会があることを示します。
しかし、ここでNakaSideが本当に際立つのは、トレンドの特定に留まらないところです。他の人が苦労する横ばい市場では、NakaSideが光を放ち、チャート全体に複数のドル記号を散りばめ、多数の潜在的なエントリーポイントを示

流動性と移動平均に依存する指標>これにより、正しい意思決定の98%が売買されます。そして取引を閉じる時間。 価格は時々上昇します>そして最初のEAがいつ起動するかはこの指標に依存して2k以上になります。 1-いつ買いポジションまたは売りポジションをオープンするか(2本の線Xのクロスに依存し、ポイント計算は選択したフレームに依存します) (十字架は色付きの領域の外側にある必要があります)ろうそくは十字架の間または(1番目または2番目から5番目まで)十字架に触れなければなりません 十字架の下で最後の状態が直接確認されたときにカウントされたポイント(スクリーンショット付きの表を参照してください。プラスツールを使用して面積をカウントします) 2-次のエリアの外側の黄色い線の開始カーブがポジションを閉じるためのシグナルである場合 3-フレームで動作します(1m 5m 10m 15m 30m 1h 4h毎日および毎月)(すべてのペア>およびすべての商品)メジャー推奨 4-ゲインの..(55%)を獲得した後にトレイルストップを置く 5-1000 $スタックの取引ごとに推奨ロット0.01 異なるペア

範囲の枯渇は、価格が現在の期間の予想される範囲を満たすか超えると発生します。これらのレベルでは、価格は期間の初期に比べて勢いを失い始めるため、新しいポジションをとっていないことを確認するのに良いポイントです. このインジケーターは、チャート上でこれが発生する可能性が高い場所を示し、日次、週次、月次の期間のレベルを示します。 価格がこれらの枯渇レベルを超えている場合は、動きの背後にある勢いが非常に強く、より高い時間枠レベルに向かっている可能性が高いことを示しています. インジケーターは、好みに応じて、Average True Range (ATR) または Average Range (ADR) 計算を使用できます。デフォルトでは、外国為替チャートでよりうまく機能することがわかっているため、ATR を使用しますが、ADR は株式ベースのインデックスとシンボルで優位に立っています。 インジケーターには、以下で説明するいくつかの描画モードがあり、ニーズに合わせて調整できます。
設定
計算モード レベルの計算には、AverageTrueRange (ATR) または AverageDai

This indicator provides the ability to recognize the SMC pattern, essentially a condensed version of the Wyckoff model. Once the pattern is confirmed by RTO, it represents a significant investment opportunity. There are numerous indicators related to SMC beyond the market, but this is the first indicator to leverage patterns to identify specific actions of BigBoy to navigate the market. The SMC (Smart Money Concept) pattern is a market analysis method used to understand the behavior of "smart

このボラティリティインディケータは、死んだ市場を検出するのに便利です。ユーロのボラティリティーを測定するEVZ指数に基づいています(ただし、外国為替市場全体に適用することもできます)。高い値は、市場での高いボリューム/ボラティリティを表します。7以下の場合は、ボリュームが少なく、取引時のリスクが大きいことを示しています。 No Nonsense Forex(NNFX)手法を使用しているトレーダーにとって、このインジケーターはアルゴリズムのバックテストやEVZが与える影響を測定するのに役立ちますし、取引の際にチャートで直接読み取ることもできます。 このインジケーターが正しく動作するために必要なデータを取得するには、 EVZ Reader (無料)をダウンロードしてください。
特徴
このインディケータは、プログラム「EVZリーダー」によって取得されたデータを読み取るもので、このインディケータが動作するために必要なものです。このリーダーが1つのチャートで有効であれば、EVZはほぼリアルタイムで更新されます。 このインジケーターの複数のインスタンスを複数のチャートに配置しても、パフォーマ

Force Index に Average True Range (ATR) チャネルを追加することは、Kerry Lovvorn によって提案されていました。 これらのチャネルを追加すると、Force Index が中間のトップとボトムを識別するための優れたツールになります。 ATR チャネルを使用した Force Index はすべてのターンを捕捉するわけではありませんが、識別されたターンは非常に真剣な注目に値します。
注: Average True Range の「true」という言葉は、価格ギャップに対処することを指します。 Force Index にはギャップがないため、ここでは ATR は Average Range と同じになります。
フォース インデックスが 3-ATR チャネルを上回ったり下回ったりするたびに、ティッカーが持続不可能な極端な領域に到達したことを示します。 そこで上昇も下落も疲弊し、価格が反転する傾向にあります。 これは、上部領域と下部領域の両方を同等に効率的に呼び出すことができる数少ないツールの 1 つです。 エルダーディスクは、フォースイン
The DYJ SignalSourceOfWPR is based on WPR indicator. It can be used for any currency pair and timeframe. The WPR recommends Indicator values ranging between 80 and 100% indicate that the market is oversold. Indicator values ranging between 0 and 20% indicate that the market is overbought. The entry signal of this indicator is a turning point in the trend.
The indicator uses analog trading technology,
Provide you with indicators to evaluate the overall profit of the opening signal and clo

バイナリ オプションの可能なコールおよびプット エントリを生成する人工知能に基づくインジケーター。
このインジケーターは 3 つの異なる戦略で機能します。
1) 出来高を読み取ることで、価格が反転する時期にシグナルを送信します。
2) 価格と出来高の乖離を通じて、トレンドが継続するか反転するかを知らせます。
3) 価格と出来高の収束を通じて、トレンドが継続すべき時期にシグナルを送信します。
この指標はすべての時間枠で機能しますが、最良の結果は 3 分または 5 分の期限で得られます (制度的な攻撃は短い時間枠で見られるため)。
最も流動性の高い時間帯、つまりグリニッジ標準時 7 時からグリニッジ標準時 18 時までが最適です。
このインジケーターは正しいシグナルの 70% 以上を生成しますが、価格を操作する機関同士の争いに遭遇したり、相互に拒否したりして、一連の誤ったシグナルが生成される可能性があります。そのため、適切な資金管理を使用することをお勧めします (Masaniello の例) )

Crash Spike master is the future for trading Crash markets. It has been designed to run on Crash 300 , 500 and 1000 markets on the 1 minute timeframe. It has 2 different trading modes (Aggressive and Normal) Aggressive mode will plot Yellow and blue arrows. 2 different conditions to help you make the right choice. Enter first trade on yellow arrow and second trade on blue candle. SL in this mode will be 10 Candles from the blue arrow. Normal mode will only plot red arrows on the chart. This mode

このマルチタイムフレームとマルチシンボルインジケーターは、ピンバー、朝/夕方の星、巻き込み、ピンセット、スリーラインストライク、インサイドバー、ペナントとトライアングルをスキャンします。 インジケーターはシングルチャートモードでも使用できます。このオプションの詳細については、製品の ブログ 。 独自のルールとテクニックを組み合わせることで、このインジケーターを使用して、独自の強力なシステムを作成(または強化)できます。 特徴
マーケットウォッチウィンドウに表示されているすべてのシンボルを同時に監視できます。インジケーターを1つのチャートに適用し、市場全体を即座に監視します。 M1からMNまでのすべての時間枠を監視し、パターンが識別されるとリアルタイムのアラート(ポップアップ、プッシュ、またはメール)を送信します。 RSIとボリンジャーバンドをピンバー、朝/夕方の星 、巻き込み、ピンセットの形成の フィルターとして使用して、潜在的な逆転を適切に特定できます。 主要なトレンドフィルターとして移動平均を使用し、ボラティリティフィルターとしてADXを使用できます。 インジケー

I recommend you to read the product's blog (manual) from start to end so that it is clear from the beginning what the indicactor offers. This multi time frame and multi symbol divergence dashboard indicator sends an alert when one or two different divergences have been identified. It can be used with all time frames from M1 to MN. Maximum 9 time frames can be shown in the dashboard at the same time. It is possible to enable moving average, RSI or Bollinger bands trend filter to filter out on
Unique trend trading algorithm with advanced filtering and many features which should become a part of your trading arsenal. This indicator can give you also trading advisors (with take profit target), success rate scanner and much more. TrendMagiX PRO comes with built-in multi-pair and multi-timeframe scanner which is fully adjustable. User can select own symbols and time-frames to monitor. + ALL the features of standard TrendMagiX indicator
Important information For additional detailed infor

Introduction to Fractal Pattern Scanner Fractal Indicator refers to the technical indicator that makes use of the fractal geometry found in the financial market. Fractal Pattern Scanner is the advanced Fractal Indicator that brings the latest trading technology after the extensive research and development work in the fractal geometry in the financial market. The most important feature in Fractal Pattern Scanner is the ability to measure the turning point probability as well as the trend probabil

The indicator displays peak levels of activity formed by the maximum volume, tracks the correlation of the candles on all timeframes (from the highest to the lowest one). Each volume level is a kind of key trading activity. The most important cluster is inside a month, week, day, hour, etc.
Indicator operation features A volume level receives Demand status if the nearest volume level located to the left and above has been broken upwards. A volume level receives Supply status if the nearest vol
Volatility Crusher Indicator is a Non-Lag MT5 indicator which detect trades on any time frame. The indicator has alerts to buy and sell once a trade has been detected. It will also send pop-up signal to your mobile phone and you can trade anywhere you are with your phone while its generating signals for you on PC connected to VPS. Its recommended on m5 to h4 time frame on any pair on Deriv MT5 Broker. Pairs recommended: Volatility Index 10, Volatility Index 25, Volatility Index 100 Volatility I

This LEGIT Indicator Can Accurately Predict the Outcome of One Bar.
Imagine adding more filters to further increase your probability!
Unlike other products, Binary Options PRO can analyze past signals giving you the statistical edge.
How Increase Your Probability
Information revealed here www.mql5.com/en/blogs/post/727038 NOTE: The selection of a Good Broker is important for the overall success in trading Binary Options.
Benefits You Get
Unique algorithm that anticipates price weaknes

Gold Levels MTF - this is a fine stock technical indicator. The indicator algorithm analyzes the movement of the asset price, displays price levels of support and resistance from all time frames (TF) using the Murray method based on the Gann theory. The indicator indicates overbought and oversold fields, giving an idea of possible reversal points and at the same time giving some idea of the strength of the current trend.
Description of levels: (Extreme Overshoot) - these levels are the ultimat

Meta Trend Indicator is an efficient way to forecast and detect the trend in any market. It reveals the trend, support and resistance levels, volatility and the maximum potential target, all in one indicator. To adapt to the price and to decrease consecutive trend failures, the internal trend detector algorithm studies the market and dynamically chooses the right values for the internal parameters. This indicator is a perfect trend filter for any strategy or expert advisor. Features Super Adapti

MT4版 | Valable ZigZagインジケーター | FAQ エリオット波動理論 は、価格チャート上の波の視覚的なモデルに基づいて、金融市場のプロセスを解釈するものです。この理論によれば、現在市場で優勢なトレンドは、上昇と下降のどちらであるかを正確に知ることができます。 Valable ZigZag インディケーター は、 市場の波動構造 を表示し、現在の時間枠で現在のメイントレンドの方向を示します。便利なことに、 Trend Monitor VZ インジケーターは、取引する通貨ペアの全リストについて、すべての時間枠のチャート上にトレンド方向を表示します。 1 つのチャートですべての商品の市場状態の全体像を把握し、正しい取引判断を下すことができます ! Valable ZigZag インジケーターは 非常に安定しており 、古典的な ZigZag のように頻繁に方向転換してトレーダーを混乱させることはありません。これは、インジケーターの波のプロットにフラクタルを使用することで実現されています。 Valable ZigZag インジケーターは、何よりもまずトレンドイ

この指標は、指定されたバー数の作業ヒストグラム上の最大および最小価格ボリューム(市場プロファイル)のレベルを検索します。 合成のプロフィール。 ヒストグラムの高さは完全に自動化されており、あらゆる計測器と時間枠に適応します。 著者のアルゴリズムが使用され、よく知られている類似体を繰り返さない。 二つのヒストグラムの高さは、ろうそくの平均高さにほぼ等しい。 スマートアラートは、ボリュームレベルに関する価格を通知するのに役立ちます。
コンセプトSmart Money 。 Low Volume - Imbalance. は、良い市場の文脈を見つけ、市場の構造を決定し、バイナリオプションのフィルタとして使用されます。 それは価格のための磁石です。 High Volume - Liquidity. は、累積を終了するときのテストに使用されます。
入力パラメータ 。
基本 。 Bars Count - カウントして表示するバーの数 。 Signal Fractal = 5 (色信号のレベルのために)。 レベルは、次の条件の下で信号になります:それを超えない上部と下部に五つのヒストグ

トレンド チーフは、市場のノイズを除去し、トレンド、エントリー ポイント、および可能なエグジット レベルを決定する高度なインジケーター アルゴリズムです。 スキャルピングには短い時間枠を使用し、スイング取引には長い時間枠を使用します。 Trend Chief は、通貨、金属、暗号通貨、株式、指数など、すべてのメタトレーダー シンボルに最適です。
* トレンド チーフ インジケーターの使用方法: - 日足チャートとH4チャートを見てメイントレンドを把握 - トレンドが上昇している場合は、m15 のような短い時間枠に移動し、取引を行う前に価格がメインのグリーン ラインを超えるまで待ちます。他のすべてのラインもグリーンである必要があります。 - トレンドが下降している場合は、m15 などの短い時間枠に移動し、価格がメインの赤い線を下回るまで待ってから取引を行います。他のすべての線も赤である必要があります。 - ラインの色が変わったら取引を終了
私の信号と他の製品はここにあります

この指標の背後にある考え方は、すべての時間枠でマレーレベルを見つけ、それらを組み合わせて、強力なマレーレベルに基づくシグナルレベルを含むコンボレベルにすることです (+2, +1, 8, 4, 0, -1, -2) 。 時間枠が短いほど、コンボレベルをすぐに確認する必要がある可能性が高くなります。 色で強調表示されます。 任意の番号にカーソルを合わせると、レベルが属する時間枠にヒントが表示されます。 ただし、常に現在の時間枠が左端の時間枠として表示されます。 スマートアラートは、シグナルコンボレベルに関連する価格を伝えるのに役立ちます。
ビデオのダッシュボードは宣言された機能ではなく、ここには含まれていません! まだ開発中です。
推奨される取引 テクニカル分析を追加することなく、コンボ水準からの反発を取引することは推奨されない。 青と赤のレベルからの反発の確率が高い。 価格はコンボレベルに磁化されているが、このレベルはまだ試されていない(ローソク足128本前)。この場合、レベルテイク(一段高・一段安)を用いたトレンド戦略を推奨する。 価格が赤または青のレベルに向かっ

この強力なツールは、トレンドラインを自動的に識別し、取引戦略を合理化し、より多くの情報に基づいた決定を下すのに役立ちます。 mt4バージョン
重要な機能 自動トレンドライン検出 :「基本的なトレンドライン」インジケーターは、潜在的なトレンドラインの市場をスキャンし、チャートに即座に表示します。これにより、貴重な時間を節約し、重要な傾向を見逃すことはありません。 ユーザーフレンドリーパネル :私たちのインジケータには、さまざまなトレンドラインを簡単に描画できる美しく直感的なパネルが付属しています。パネルは、すべてのエクスペリエンスレベルのトレーダー向けに設計されているため、数回クリックしてトレンドラインを追加、編集、または削除できます。 お気に入りのトレンドラインを保存して管理 :あなたにとって最も重要なトレンドラインを追跡します。私たちのインジケータを使用すると、好みのトレンドラインを保存し、チャートを再訪するたびに常に利用できるようにします。 汎用アプリケーション :外国為替、株、または暗号通貨を取引しているかどうかにかかわらず、「基本的なトレンドライン」インジケーターはさまざま

This is a multi timeframe version of the Supply and Demand indicator . It allows you to analyze a chart using the law of supply and demand on three different timeframes at a time. You will see zones of sales and purchases and determine the most profitable points to open positions. The indicator is based on the principle of market fractality. Supply and demand zones show places where a strong buyer or seller has made the price reverse and change its direction. The indicator has several types of

The Gann Box (or Gann Square) is a market analysis method based on the "Mathematical formula for market predictions" article by W.D. Gann. This indicator can plot three models of Squares: 90, 52(104), 144. There are six variants of grids and two variants of arcs. You can plot multiple squares on one chart simultaneously.
Parameters Square — selection of a square model: 90 — square of 90 (or square of nine); 52 (104) — square of 52 (or 104); 144 — universal square of 144; 144 (full) — "full"

Non standard attitude to the standard moving average indicator. The essence of the indicator is to determine the strength and speed of the price direction by determining the tilt angle of the moving average. A point is taken on the fifteenth MA candle and a point on the last closed MA candle, a straight line is drawn between them, it is movable and on a hemisphere shows an angle of inclination from 90 degrees to -90. above 30 degrees is the buying area, below -30 degrees is the selling area. abo

Unlock the Power of Market Analysis with Precision Are you ready to take your trading to the next level? The "Institutional Volume Profile" indicator is here to empower your trading decisions like never before. Key Features: Custom Volume Profiles : Plot volume profiles effortlessly by simply adding horizontal lines or Fibonacci tools on your MetaTrader 5 chart. There's no limit to how many profiles you can create. Insightful Visualization : The indicator beautifully displays crucial information

Detect divergence (classic, hidden) price and all oscillator indicator include: RSI, CCI, MACD, OSMA, Stochastic, Momentum, Awesome Oscillator (AO), Accelerator Oscillator (AC), Williams Percent Range (WPR), Relative Vigor Index (RVI), Rate of Change (ROC). Confirm reversal with dochian channel for to improve signal quality. Divergence is when the price of an asset is moving in the opposite direction of a technical indicator , such as an oscillator, or is moving contrary to other data. Diverge

The FFx Universal MTF alerter shows on a single chart all the timeframes (M1 to Monthly) with their own status for the chosen indicator. 9 indicators mode (MACD-RSI-Stochastic-MA-ADX-Ichimoku-Candles-CCI-PSAR). Each can be applied multiple times on the same chart with different settings.
Very easy to interpret. Confirm your BUY entries when most of the timeframes are showing green color. And confirm your SELL entries when most of the timeframes are showing red color. 2 Alert Options : input to

Currency Strength Meter is the easiest way to identify strong and weak currencies. This indicator shows the relative strength of 8 major currencies + Gold: AUD, CAD, CHF, EUR, GBP, JPY, NZD, USD, XAU. Gold symbol can be changed to other symbols like XAG, XAU etc.
By default the strength value is normalised to the range from 0 to 100 for RSI algorithm: The value above 60 means strong currency; The value below 40 means weak currency;
This indicator needs the history data of all 28 major curre

BeST_Hull Single MA Strategy is an Metatrader Indicator based on the famous indicator Hull Mov.Average . This indicator can display the Single HMA Strategy of just 1 Hull MAvg. It uses added internal filters locating the most likely Entries while it can be used as a standalone system or as an add-on to other ones.
Generally the Hull Moving Average (HMA - developed by Alan Hull) is a directional trend indicator . It captures the current state of the market and uses recent price action to determi

The indicator is designed for pair trading with 2 highly correlated instruments.
Indicator charts can be displayed as lines or histograms. There is an MTF mode, the maximum and minimum deltas for the calculated number of bars are displayed with a check for a specified minimum value. It is possible to enable the calculation of trade operations with checking the current correlation coefficient for the minimum specified, the current delta in points or percent of the maximum (minimum) delta and

The market price usually falls between the borders of the channel .
If the price is out of range, it is a trading signal or trading opportunity.
Basically, Fit Channel can be used to help determine overbought and oversold conditions in the market. When the market price is close to the upper limit, the market is considered overbought (sell zone). Conversely, when the market price is close to the bottom range, the market is considered oversold (buy zone).
However, the research can be used

Average Cost Price helps you keep track of your open positions on the chart. In doing so, it provides lines and explanations on the chart. This line is the average price value of the Bid or Ask.
If you wish, you can see the average cost price by adding SWAP and COMMISSION to the average price value.
*** You can add commission manually per lot.
The legend below the Average Cost Price line gives you: * Average Buy or Sell price line, * Swap Amount, * Commission Amount, * Total Profit or Los
MetaTraderプラットフォームのためのアプリのストアであるMetaTraderアプリストアで自動売買ロボットを購入する方法をご覧ください。
MQL5.community支払いシステムでは、PayPalや銀行カードおよび人気の支払いシステムを通してトランザクションをすることができます。ご満足いただけるように購入前に自動売買ロボットをテストすることを強くお勧めします。
取引の機会を逃しています。
- 無料取引アプリ
- 8千を超えるシグナルをコピー
- 金融ニュースで金融マーケットを探索
新規登録
ログイン