YouTubeにあるマーケットチュートリアルビデオをご覧ください
ロボットや指標を購入する
仮想ホスティングで
EAを実行
EAを実行
ロボットや指標を購入前にテストする
マーケットで収入を得る
販売のためにプロダクトをプレゼンテーションする方法
MetaTrader 5のための有料のテクニカル指標 - 47
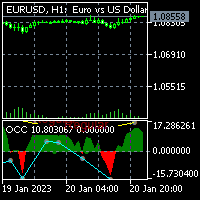
For MT4 version please click here . This is the exact conversion from TradingView: "Open Close Cross Alert R6.2 by JustUncleL" By "JayRogers". - This indicator implements Alerts as well as the visualizations but does not support multi-time frame. - Hidden/Regular divergences supported. - This is a non-repaint and light processing load indicator. - You can message in private chat for further changes you need.
これは、外国為替、暗号化通貨、貴金属、株式、指数などの金融資産に適用できます。正確な取引ポイントを提供し、開倉と平倉の最適な時間を教えます。 専門家と初心者共通 ステップユーザーガイドでは、インジケータを初めて使用しても、インジケータの操作方法を説明するために特別な例を使用します。 この指標は、時間、価格、平均二乗値の3次元の値を考慮している ポータル信号の再描画を禁止 信号が現れて確認されれば、消えることはありません。再描画インジケータとは異なり、信号を表示した後に削除できるため、重大な財産損失を引き起こす可能性があります。 エラーなしで開く 指数アルゴリズムは、市場への参入(資産の購入または売却)に理想的な時間を見つけるのに役立ち、各トレーダーの成功率を高めることができます。 理想的な切り口は何ですか。 市場に参入するための最良のポイントは、価格のある方向での開始または継続である。 この場合、不必要な損失を回避するために、保護性ストップリストをどこに設置するかを常に知っています。 私たちの指標は、トレンドの開始時にこれらの点を見つけるのに役立ち、リスクを最小限に抑え、利益を増やす

Unlock the power of the market with the Investment Castle Multi Time Frame Moving Average Indicator. Simplify your trading journey by easily identifying trends and pullbacks across multiple time frames on one convenient chart. This indicator is a must-have tool for any serious trader. Available for MT4 and MT5, and exclusively on the MQL5 market, customize your experience by adding as many indicators as you need on the chart, each with their own unique time frame or period. Enhance your strat

This powerful tool is designed to help traders identify key reversal patterns in their charts, including the hammer and star bar formations. With this indicator, you can quickly and easily spot these patterns as they form, allowing you to make well-informed trades and potentially increase your profits. The Hammer Start indicator is customizable, allowing you to set your own parameters for identifying patterns and alerts. Whether you're a seasoned trader or just starting out, the Hammer and Star
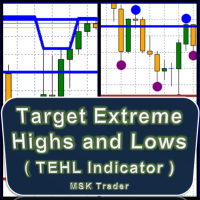
TEHL Indicator is an automatic indicator designed and optimized to highlight the highest highs and the lowest lows in several convenient ways. Using deep calculations, it spots the extreme highs and lows automatically, and facilitates to you defining the resistance and support levels. The indicator has several options for changing marking icon, drawing style, bars range (period) and more as will be detailed below. This indicator does very well along normal and consolidation (aggressive) zones.
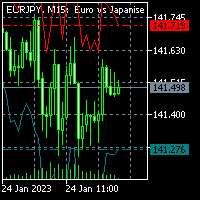
For MT4 version please click here . This is the exact conversion from TradingView: "Average True Range Stop Loss Finder" By "veryfid". - This indicator implements a deviation channel. - The channel determines trend direction as well as stop loss placement. - This is a non-repaint and light processing load indicator. - You can message in private chat for further changes you need.
The ORB The Opening Range Breakout or the OPR 'Open Price Range' MT5 Indicator is a powerful tool designed to enhance your trading experience by automatically tracking market openings range, custom ranges, sessions, and Asian ranges. This dynamic indicator is perfect for price action traders, offering unparalleled precision and accuracy without any manual effort. Key Features: London ORB The Opening Range Breakout : Automatically displays the London open price range. New York ORB The Openin

All 11 indicators quickly turn off and turn on quickly!
Set of indicators:
2 indicators "TREND" :
- fast = line 4 colors - slow = dots 4 colors
The coloring of the indicators depends on the direction of the trend and the RSI indicator: 1) uptrend and RSI<50% 2) uptrend and RSI>50%
3) downtrend RSI<50%
4) downtrend RSI > 50% Set indicator periods for each timeframe: M5 M10 M15 M30 H1 H2 H4 H6 H12 D1 W1 MN
Do not enter trades if at least 1 of the indicators is horizontal. For a

Stochastic Professional 3 in 1! It is an indicator programmed to operate professionally! and very easy to use where it gives you alerts, marks sales and purchases, sending you alerts at any time, where you reconfirm the entry with green and red arrows for sale and purchase very effective for scalping and lengths! suitable for Forex and synthetic indices! Good profit! World Investor.
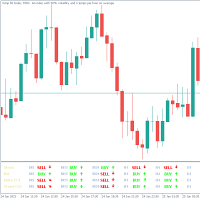
The Trend Assistant indicator is a technical analysis tool that helps traders identify the current trend of a financial instrument by analyzing different timeframes on a chart.
The indicator shows the trend based on M1 (1 minute) , M5 (5 minutes) , M15 (15 minutes) , M30 (30 minutes) , H1 (1 hour) , H4 (4 hours) , D1 (1 day) , W1 (1 week) , and MN1 (1 month) timeframes. The trend is represented by a colored arrows on the sub window chart, with a bullish trend shown in green and a bearish tre

The EMA Engulfing Cross indicator is an indicator for the MetaTrader 5 platform that signals potential buy and sell opportunities based on an engulfing candle pattern after a recent exponential moving average cross. You can adjust how recently the trend change must have occurred using the PASTemaCROSS input. The RSI oversold/overbought function is used to confirm the signals generated by the moving averages. It takes into account the previous bar before the engulfing bar, and it is best used wi

MULTI MARKET SPEED INDICATOR FOR MARKET FLOW & PERFORMANCE CATEGORIZING Specially developed for pattern detection and multi market and cross / intermarket research, volatility , and performance research. Measure in real time, speed & performance on multi markets Detect price and time cycles , squeezes, performance, pattern in structure, pattern in price and structure, patterns over different individual markets and how they move together, time and price action and of course upcomin

Introducing our new Indicator: "Draws the Open Price Line for every Timeframe Automatic" ...an essential tool for any trader looking to improve their visual perception and establish patterns in their trading behavior and strategy. This indicator is designed to work on all timeframes that MetaTrader 5 supports, and can be individually activated and customized according to your preferences. The indicator draws the open price line of a new starting bar in different colors for each timeframe, making

This indicator allows the trader to see what is difficult to see and recognize with the eyes.
The indicator naturally recognizes and visualizes all processes in the behaviour of a trading instrument, which will be an excellent assistant for a trader who likes to make decisions on his own.
This indicator draws a set of approximating channels in all sections of history with different periods. Formed channels form naturally and form their own hierarchy of channels by seniority (length and width

Arrows Scalp Oscillator indicating buying and selling, It is added with arrows that indicate sell and buy, moving average crosses where they indicate the break to enter better being the sale or the purchase! perfect for scalping! in the Forex markets and synthetic indices! It also works for crypto! Suitable for any period of time, it can also be used for lengths! Good profit! World Investor.

Renko Gold! clearly indicates the floors and ceilings where it goes from 4 lines, the line below that marks the floor in green confirming with the thinnest line clarifies the purchase entry, the same is for sale, the top line marks the ceiling and the thinnest red line marks the sale, This indicator works for all temporalities! For Forex and Synthetic Indices markets! It also works for crypto markets! Good profit! World Investor.

Professional Channel! indicator that clearly marks the bullish and bearish channels also marking support and resistance! the line has 3 colors where the green color marks buy! the blue line is rebound and the red line is the one that marks the ceiling, that is, the sale! works for all seasons for forex markets and synthetic indices also for crypto markets! good profit World investor.

The Rubdfx swing indicator is a useful tool for traders looking to identify trend changes in a particular instrument they are trading. It is designed to draw a line on the main chart, and the signals are indicated by color changes with signal alerts. The color green is used to indicate a bullish trend, while the color pink is used to indicate a bearish trend. These colors can be customized to fit the trader's preferences or theme. The Rubdfx swing indicator has the ability to spot both long-te

URガンマ (機械学習システムで見られる同様の計算を利用)
UR Gamma は、従来の WaveTrend インジケーターを新しく改善したものを提供する最先端の財務分析ツールです。 高度なデジタル信号処理技術を組み込むことにより、UR Gamma は、従来の WaveTrend アルゴリズムの制限の一部に対処し、価格行動の傾向を特定および測定するためのより正確で堅牢で動的なアプローチを提供します。
UR ガンマを使用する利点:
ミニマルなセットアップ すべてのデータはバックグラウンドで計算されており、ユーザー向けの出力は 1 つだけで、明確かつ適切です。 疲労を示唆する背景レベル あらゆる種類のアセットに調整されます。 ツールの最新情報を入手できる特別な電報チャットがあり、何か不足していると感じた場合はリクエストを送信することもできます!
なぜURガンマ?
目標は、0 を中間点として、-1 と 1 の間で確率分布を振動させることです。 これを実現するために、アクティベーション関数と呼ばれる機械学習の手法を使用してデータを変換します。 そのような関数の 1 つ

Ichimoku technic . is a candlestick indicator, which captures bullish and bearish trends according to its sail color! where there are breaks, it also captures with candle colors, The 2 most important colors to hunt trends are red and aqua, where clearly by color it tells you when it goes up or down, Serve for all seasons! It works for the forex markets and synthetic indices, also crypto! World Investor. Good profit!

Supply and demand Professional. It is an indicator of supply and demand clearly, It indicates with colors where it marks the different areas of supply and demand, trading volume. support zone low , support zone high , resistance zone low , resistance zone high works for all seasons works for forex markets and synthetic indices! It works for scalping and longs! World Investor Good profit!

Parabolic Professional. is a parabolic sar indicator, programmed better to better catch the entries, where it throws red dots, gives upload input, where it puts gray dots, gives point of sale, perfect for making lengths of H4, and H1 It is also used for scalping, It works at any time. suitable for forex and synthetic indices, also crypto, World Investor , Good profit

Step ma, It has a band indicator where it gives you inputs, when the candle leaves the band, it's called step ma, It is used in all temporalities, ideal for scalping, long can also be done It has 2 colors of bands on the lower side and red on the upper side and the rebound line is blue. works for forex markets works for synthetic index markets ! for all pairs! World Investor, Good Profit!

ATR Professional. is an indicator similar to the bollinger, but this back is more advanced to scalp and long in h4 or h1, It has its bands, the strategy is that it marks entry when the candle leaves the band, or does it bounce on the upper roof or lower floor, works for all seasons! works for forex markets and synthetic indices also crypto! Good profit! World Investor.

The rubdfx divergence indicator is a technical analysis tool that compares a security's price movement. It is used to identify potential changes in the price trend of a security. The indicator can be applied to any type of chart, including bar charts and candlestick charts.
The algorithm is based on MACD, which has been modified to detect multiple positive and negative divergences. Settings
___settings___ * fastEMA * slowEMA * signalSMA *Alerts: True/False
#Indicator Usage
B

ICT Core Content Concepts turned into indicator plus all previous tools known from the Position Smart Indicator . This makes it the Full PSI Private Version ( read more ) restricted up to now but available only after the Mentorship Core Content was made public on YouTube. You will find many price action study tools like: Central Bank Dealing Range - CBDR Asian Range FLOUT Profiles and SD targets on the CBRD, Asian Range and Flout both on the wicks and on the bodies Seek & Destroy Prof
Think of an indicator that instantly shows you all supports, resistances and turncoats and can send a notification to your phone or an alarm on your computer. In addition to all these, it groups how many times it has entered each field and, accordingly, the strength of the field. Supply Demand And Turncoat is at your service. Setup for any TimeFrame and Chart you want and enjoy easy trading. Features: Ability to select the fields to be shown (weak, untested, turncoat, verified, proven) Merge fie

Macd Sar! is a gcd indicator combined with the parabolic sar indicator! It has the strategy of breaks, where the gray line crosses above the pink lines, and exchange of parabolic sar points, it is marking purchase for sale is vice versa, works for all seasons! It is good for scalping, and to do lengths suitable for forex markets and synthetic indices! Good profit! World Investor.

Super Treend! It is an indicator whose strategy is based on line breaks giving a signal for sale or purchase, How well it looks when you are marking a sale, it puts a red dot on you, when you make a purchase, it marks a green dot, Accompanying with blue lines that sets the trend for sale, and the aqua line that sets the shopping trend for you, works for all seasons works for forex markets and synthetic indices! Good profit! World Investor.

Range Move It is an indicator that clearly shows you the supports, resistances and trend lines. to each candle that is running, said changing, the lines are changing accommodating the trend to have a better entrance! the indicator is for forex markets for synthetic index markets ! and for crypto too! It is used in all temporalities! Good profit! World Investor.

Channel Oscillator It is an oscillator indicator, which goes from strategy marking the high points, and the low points where it is accompanied by a band that marks those points, where it marks you with a signal of a block in the upper band when it is for sale, and it marks you with a block in the bearish band when it is bought. works for forex markets and synthetic indices It also works for crypto markets ideal for scalping, good profit World Investor.
Quantile Moving Average Channels "KNOW WHERE OTHER MARKET PARTICIPANTS ACT"
General See where zones of interest exist with quantile MA channels. It plots three lines on the main chart: two outer lines and a mid line.
Most of all commonly used moving averages are between the upper and the lower band, if the input parameters are chosen properly.
This means that if the channel is relatively small, other market participants that rely on moving averages may act if the price action is near the mi

The Double Stochastic RSI Indicator is a momentum indicator which is based on the Stochastic Oscillator and the Relative Strength Index (RSI). It is used help traders identify overbought and oversold markets as well as its potential reversal signals. This indicator is an oscillator type of technical indicator which plots a line that oscillates within the range of zero to 100. It also has markers at levels 20 and 80 represented by a dashed line. The area below 20 represents the oversold area, wh

URバンド (機械学習システムで使用される式を使用)
UR Bands は、機械学習システムで使用されるものと原理的に類似した、市場のボラティリティを組み込んだ数式によって導出される指標です。 この市場状況の数学的表現は、金融市場固有のボラティリティを考慮して、価格動向とダイナミクスの正確な分析を提供します。 ボラティリティを変数として組み込むことにより、インジケーターは市場の状況をより正確かつ信頼できる形で表現し、トレーダーや投資家が情報に基づいた意思決定を行い、リスクを効果的に管理できるようにします。 さらに、ボラティリティベースの式を使用することで、インジケーターは市場の変化に非常に反応しやすくなり、潜在的な取引や投資の早期シグナルを提供します。
UR バンドを使用する利点:
視覚的に楽しくわかりやすいオンチャートバンド あらゆる種類のアセットと時間枠に適応 常にトレンドの上下を示すバンド トレンドまたは反転取引システムのための優れた追加およびスタンドアロンのインジケーター ツールの最新情報を入手できる特別な電報チャットがあり、何か不足していると感じた場合はリクエス

Macd diverge! It is a macd indicator where it goes with the divergence indicator and arrows that mark the sale and purchase of the pair! It is very easy to use and at first glance you can see that you don't have to do a lot of analysis since the divergence marks the sail too! It can be used in all seasons! It is used for scalping! works for forex markets for crypto and synthetic index markets too! Good profit! World Investor.

filling It is an oscillator indicator, where it clearly marks sale and purchase, It has two colors, red and blue. red marks you buy, and blue marks you for sale, ideal for scalping and lengths! works for forex markets works for synthetic index markets ideal for volatility and jumps! It also works for crash and boom! walk in all temporalities! Good profit! World Investor.

macd rsi It is a macd indicator added to the rsi to capture perfect entries in the average crossovers! As seen in the indicator, it has 2 lines, one of gold color and the other violet line, where the cross of the violet with the gold downwards is a sell signal when it crosses the violet up from the gold it is a buy signal! very good to make shorts works for forex markets and synthetic indices It is used in any temporality! Good profit! World Investor.
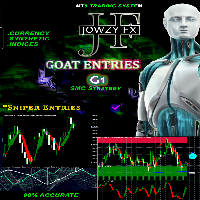
Jowzy Fx G1 is the indicator designed to detect swings in the direction of the trend and possible reversal swings. The indicator studies several price and time vectors to track the aggregate trend direction and detects situations in which the market is oversold or overbought and ready to correct. This indicator shows Swing that is a strong hint for an excellent entry point and finds immediately with alarm and notification and also has stop loss and entry point with candlestick checking for eas
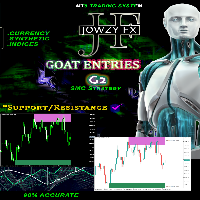
Jowzy Fx G2 support or resistance levels are formed when a market’s price action reverses and changes direction, leaving behind a peak or trough (swing point) in the market. Support and resistance levels can carve out trading ranges. The indicator identifies the Swing High and Swing Low based on X amount of bars ( Period ) defined in the indicator set.
Main Features: Detect the best and most successful point of trend or reversal trend
Easy-to-use and user-friendly indicator NO repaint Scan
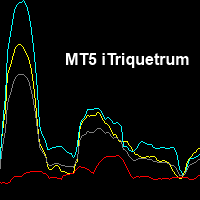
Индикатор показывает отклонения корреляции трех валютных пар, после резкой волатильности пар возвращает их к состоянию сбалансированости Выбор периода отклонения даст возможность наблюдать за более длительными отклонениями Цветные линии хорошо помогают распознать на какой валютной паре произошло отклонение цены, можно наблюдать как резко уходят цены по всем парам, и возвращаются к своему среднему значению
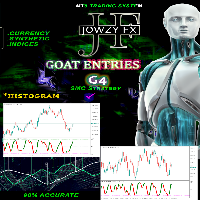
Jowzy Fx G4 indicator is a universal tool, suitable for scalping and medium-term trading. This indicator uses an innovative formula and allows you to determine the direction and strength of the trend. is not redrawn, so you can evaluate its efficiency using history data. suitable for M5, M15, M30, H1 and H4 is perfect for all Meta Trader symbols: currencies, metals, cryptocurrencies, stocks and indices
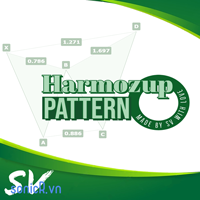
The concept of Harmonic Patterns was established by H.M. Gartley in 1932. Harmonic Patterns create by 4 peak (ABCD) or 5 peak (XABCD). In traditional, we have BAT pattern, Gartley pattern, butterfly pattern, crab pattern, deep crab pattern, shark pattern. Each pattern has its own set of fibonacci. In this indicator, we add more extended pattern named ZUP pattern. So we have total 37 pattern as follow This indicator detects all above patterns, takes fibonacci projections as seriously as you do,

Previous Period High Low . This indicator shows the previous Day, Week, Month and Years High and Low. It's great for price action strategies. : Provides clear and visible breaks in structure. : Easy to see breakout levels. : Easy to see gaps between previous high, low levels after breakouts have occurred. The indicator works on every time frame. Multiple periods can be selected and be seen on the same chart. Every line can be customized to Your liking. Color, style and thickness. Enjoy!
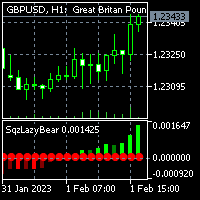
For MT4 version please click here . - This is the exact conversion from TradingView source: "Squeeze Momentum Indicator" By "LazyBear". - This is a non-repaint and light processing load indicator. - Buffers and inputs are available for use in EAs and optimization purposes. - You can message in private chat for further changes you need.
Thanks for downloading...

UR Vortex MT5
The Probabilistic UR Vortex Formula: An Accurate System for Predictive Market Analysis using Volatility and Standard Deviation Calculations. The UR Vortex MT5 indicator is a technical analysis tool that uses volatility and standard deviation calculations to predict potential tops and bottoms in a market. It measures the strength of a trend by calculating the distance between the current price and a moving average, and then standardizing this distance by dividing it by the average
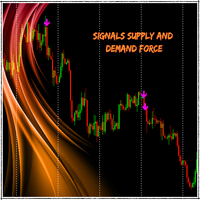
Este Indicador esta basado en el rebote de un soporte o resistencia fuerte con un indicador que tiene interno de fuerza de movimiento. Tiene la opción de ver el soporte y resistencia actual y ver la fuerza que tiene dicho soporte o resistencia.(Activando el parámetro Ver_Sop_Res ) Parámetros: Sop o Res, Fuerza Mayor a...: Con este parámetro podrás ajustar la fuerza del soporte o resistencia, con la cual el indicador evaluara si es una señal bajista o alcista. Velas Historial: Con este parámetro

Extreme indicator! is an oscillator that works with candle volume levels, where it consists of red and green colors, where you measure the sale and purchase! where it also comes with a line crossing format where it reconfirms the purchase or sale on this occasion, works for forex markets and for the synthetic index markets ! It works for all seasons! Good profit! World Investor.

Color range ! It is an indicator that indicates the volume of the candle giving you input or output depending on the color you touch on the candle! It works perfect for making H1 or H4 lengths! It also works for scalping but ideal for long! works at any time works for forex markets for synthetic index markets !!! also for crypto. Good profit!!!!!! World Investor.

extend ! is an oscillator indicator, Where you measure bullish and bearish trends ideal for scalping and lengths! The strategy consists of the crossing of lines, where it has 2 types of lines, one blue and one green! where the blue line crosses over the green line gives entry signal, where the green line crosses below the blue line gives a sell signal! It works for all seasons! Good profit! World Investor.

Swing Line! It is an indicator that easily captures a trend channel, be it bullish or bearish! being able to easily hunt the rebounds, long and short, as well as rebound support and resistance of the channel! The indicator is suitable for any temporality! very good for scalping and long! works for forex markets and synthetic indices also crypto! good profit World Investor .

Trendline! trend line indicator, support and resistance, ideal for hunting long and short! where it uses 2 lines, the red and the blue, the red one marks rebounds for sales, the blue one marks you rebounds for purchase And not only that, but it also marks you, the uptrend and downtrend. works for any season works for forex markets and synthetic indices! also crypto. Good profit! World Investor.

Stellar volume. is an oscillator, indicating the high ranges and the low ranges. marking the ceiling and floor of each trend on the oscillator, where the violet line crosses the gray line gives a purchase entry, where the violet line crosses the red line downwards gives a sell signal, very easy to use and very simple, works for forex markets and synthetic indices! and for any temporality to operate. Good profit! World Investor.

Ma Distance Parabolic! is a moving average indicator with parabolic sar ! ideal for hunting trends where there are two ideal points showing input there are 2 points where there are blue points that mark the rise and the other green point where it marks the drop The indicator gives you the entry signal when it gives the second point the position is taken. suitable for forex and synthetic indices, also crypto! Good profit! World Investor.

Zigzag Oscillator. it is an indicator programmed to hunt each point of the zigzag of the candle! as in the foreground of zigzag this oscillator takes you to simple measurements, to catch every bounce from floor to ceiling! Ideal for scalping and intraday. works for any season! for all forex pairs! for all pairs of synthetic indices ideal for volatility 75 and other jumps! Good profit! World Investor.

Oscillator Moving ! is an oscillator where it has 3 input points where is the orange line, the red line and the blue line where the orange line touches the ceiling of the blue line, it gives a buy entry signal. where the red line crosses the blue line gives a sell signal! very clear to see and very simple to use! It can be used at any time! can be used in Forex markets. In the synthetic and crypto index markets! good profit World Investor.

High Low Expert! It is an indicator where it marks the high and lows in the short and long term works like demand and supply and support and resistance too Ideal for scalping in M1, it also works for longs in H1 or H4! works for all temporalities, works for forex markets and for the synthetic index markets ! ideal for volatility pairs and jumps It also goes in crypto! good profit World Investor.

Bear Bull! It is an indicator that marks with Heikin Ashi candles but modified, the sales and purchases long and short trend! with 2 colors green marks the purchase, purple marks the sale, works for any type of temporality, works for forex markets and synthetic indices! ideal for any pair, it also works for crypto pairs, Good profit! World Investor - World Inversor -

Crash Scalper sign! is a programmed flag %100 for the crash , where it has the scalping function in M1 where it sends you input signals with the blue arrow and exit signs with the arrow board, Its principle is scalping from 2 to long candlestick trends, the exit arrow will always mark you, sending you a signal message, It also has a message for email and cell phone message where it sends you the signals! It works for all seasons! Good profit! World Investor.

Boom Scalper! is a programmed flag %100 for the Boom index, can be used on the boom 1000, 500 and 300 works for scalping M1 and longs at any time frame always sending you the signal with a purchase message and the sign where it is sold, It has the system to send email as a signal and message as signal In case you are not on your desktop PC so you do not miss any signal! Good profit! World Investor.
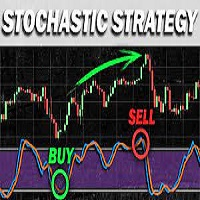
Stochastic cross alert signal overlay is indicator show signal buy and sell you can attach it easy in your chart mt5, it work all time frame it work all time frame Setting: input int KPeriod=5; input int DPeriod=3; input int Slowing=3; input ENUM_MA_METHOD MA_Method=MODE_SMA; Contact me immediately after the purchase to get the settings and a personal bonus!
UR パルススカルプ MT5 ペースの速い市場で究極の優位性を求めるスキャルパー向けの調整済み取引指標
UR PulseScalp MT5 は、ペースの速い市場で究極の優位性を求めるスキャルパー向けの最先端の取引ソリューションです。 この革新的なインジケーターは、ボラティリティ、マネーフロー、相対強度の力を組み合わせて、非常に正確で信頼性の高いシグナルを作成する、科学的に調整された式に基づいて構築されています。
UR PulseScalp MT5 を使用する利点:
快適なインタラクティブパネル M5 と H1 で高精度 初心者におすすめの EURUSD ペア 設定なし あらゆる種類のアセットに調整 すべての波をキャッチするわけではありません - それがその美しさです。 それを待たなければならない場合でも、最良のエントリを分析します。 ツールの最新情報を入手できる特別な電報チャットがあり、何か不足していると感じた場合はリクエストを送信することもできます!
UR PulseScalp MT5 を選ぶ理由
あなたがベテランのスキャルパーであろうと初心者であろうと、「

Mean Reversal Heikin Ashi Indicator calculates special trade reversal points based on Heikin Ashi candlesticks patterns. This indicator can be used on all symbols, even in Forex or B3 Brazillian Markets. You can configure just the position of each arrow. Then, after include the indicator on the graphic, pay attention on each arrow that indicates a long or short trade.

Multi-Timeframe Moving Average Indicator Provides you a simple edge. How? Let me explain.. Have you ever tried using Moving Average Strategy to trade but you find those entries too late? Have you ever tried to trade with moving averages on 1 Timeframe chart (example 4h) and when i try to lower the timeframe, moving averages change position? If you answered Yes to Both questions , This indicator is the solution for you! 1- You can visualize lower timeframes moving averages on higher timeframes ex
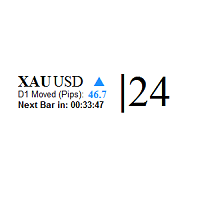
This indicator shows: The market spread Current candle time left to be closed and the pips of market movement from the beginning of the day play sound when candle is going to be closed This is an extremely useful tool for watching the spread rise and fall, allowing you to enter the market at just the right time. This indicator will help you stay out of the market when the spread begins to rise and help you get into the market as the spread begins to fall again.
very useful for day trading and
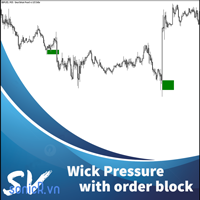
Multiple Wicks forming at OverSold & OverBought levels create Buying and Selling Pressure. This indicator tries to capture the essence of the buy and sell pressure created by those wicks. Wick pressure shows that the trend is Exhausted. Order block should display when buying or selling pressure wick. When price go inside buy order block and up to outside order block, trader should consider a buy order. If price go inside buy order block and down to outside order block, trader should consider a s

Price DNAは、複合比率加重移動平均を利用することで、遅れを少なく し、トレンドの早期発見を可能にするトレンド指標です。このインディケータは再描画されず、どのような時間枠の金融商品にも適用することができます。
プライスDNAの仕組みは? このインディケータは、現在の取引の方向を示す複数の 波を チャート上に表示します。 緑の5つの波と赤の5つの波は、それぞれ強い強気と弱気の傾向を示しています。 個々の取引スタイルに基づき、すべての波または特定の数の波がトレンドの反転を示したときに、ポジションをオープンまたはクローズすることを選択することができます。強気と弱気の波の数は、常に端末の左上隅に表示されます。
設定 個々のDNA波の周期を調整することで、Price DNAインジケータを、より積極的に、あるいはより慎重に、自分の取引スタイルに適合させることができます。 第1波の周期第1波の周期 第2波のピリオド第2波の期間 第3波のピリオド第3波の期間 第4波のピリオド第4波の期間 第5波のピリオド第5波の期間 乗算器複利の倍率
テストとインストール このインディケータをテスト
このインジケーターは、フィルタリングされた価格情報を表示します 3 つの色付きのヒストグラムと 1 つの共通の色付きの線の形式で。 これは非常にカラフルで美しいインジケーターです。 価格変動の強さと方向を判断するのに最適です。 このインジケーターの設定は非常に簡単です。 1) 指標を計算するための 3 つのオプションの選択: - オリジナル、 - デマーカー、 - バランスボリューム。 2) 5 つの異なる期間の選択。 3) 表示色の選択。 4) 精度の選択。 ///////////////////////////////////////////////////////////// この指標が取引の成功に非常に役立つことを願っています。
幸運を。

Sniper Zones are our best kept secret for trading the forex markets profitably and extremely simple ! After years of profitable trading we are launching it to the public !
After thousands of hours of testing, we have developed an indicator that simplifies trading to the point where anyone can become a profitable trader. There exists certain zones and areas in the market that are used by institutions to move price and cause retail traders to lose their money ! We have done the hardwork and m
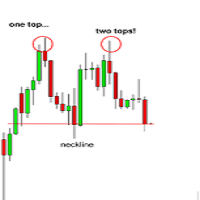
Hello all!
This is indicator 2 top and 2 bottom It will send alert to your phone when price hit top or bottom input uint InpMinHeight = 10; // Minumum Height/Depth input uint InpMaxDist = 20; // Maximum distance between the twin tops/bottoms input uint InpMinBars = 3; // Maximum number of bars after the top/bottom input string Inp_TOP_stringDOWN ="Signal Sell";// TOP: Level UP label input string Inp_BOTTOM_stringUP =
With dynamic Moving average, you can estimate the price movement, predict the next trend of price and have a better decision. Parameters setup: Period start <= Period Stop Period start >= 1
Maximum lines is 100 You can customize Moving average method: Simple averaging, Exponential averaging, Smoothed averaging, Linear-weighted averaging and price to apply: PRICE_CLOSE: Close price
PRICE_OPEN: Open price
PRICE_HIGH: The maximum price for the period
PRICE_LOW: The minimum price for the period
MetaTraderマーケットは、他に類のない自動売買ロボットやテクニカル指標の販売場所です。
MQL5.community ユーザーメモを読んで、取引シグナルのコピー、フリーランサーによるカスタムアプリの開発、支払いシステムを経由した自動支払い、MQL5Cloud Networkなど、当社がトレーダーに対して提供するユニークなサービスについて詳しくご覧ください。
取引の機会を逃しています。
- 無料取引アプリ
- 8千を超えるシグナルをコピー
- 金融ニュースで金融マーケットを探索
新規登録
ログイン