YouTubeにあるマーケットチュートリアルビデオをご覧ください
ロボットや指標を購入する
仮想ホスティングで
EAを実行
EAを実行
ロボットや指標を購入前にテストする
マーケットで収入を得る
販売のためにプロダクトをプレゼンテーションする方法
MetaTrader 5のための無料のエキスパートアドバイザーとインディケータ - 4

non-repaint free MT5 technical indicator works on all timeframes 1 minute to the monthly timeframe the trade vision buy and sell arrow is a multi currency and synthetic indicator Trade vision buy and sell arrow comes with Push Alerts purple arrow look for selling opportunities white arrow look for buying opportunities. wait for candle to close and arrow to appear before taking any trades.
FREE

Divergence Force ダイバージェンスインジケーター 1.0 説明 Divergence Force は、資産の価格とMACD(移動平均収束拡散)との間のダイバージェンスを識別するために設計されたインジケーターです。このインジケーターは、価格とMACDの高値と安値に自動的にトレンドラインを描き、潜在的な取引機会を強調します。 主な機能 ダイバージェンスの自動識別 : インジケーターは、価格とMACDの間の強気と弱気のダイバージェンスを自動的に検出します。 トレンドラインの追跡 : 価格の連続する高値と安値に自動的にトレンドラインを描き、MACDの高値と安値と比較します。 買いと売りのシグナル : ダイバージェンスが識別されると、グラフに明確に買い("Buy")と売り("Sell")のシグナルを表示します。ダイバージェンスが検出されない場合は"Neutral"を表示します。 標準MACDパラメータ : 標準のMACDパラメータ(12, 26, 9)を使用して計算し、信頼性のある認知された結果を保証します。 異なるタイムフレームとの互換性 : 1時間のタイムフレームで動作する
FREE

Dark Inversion is an Indicator for intraday trading. This Indicator is based on Counter Trend strategy but use also Volatility. We can enter in good price with this Indicator, in order to follow the inversions on the current instrument. Hey, I made an Expert Advisor based on this indicator, if you are interested: Dark Titan MT5
Key benefits
Easily visible Inversion Lines Intuitive directional arrows Automated adjustment for each timeframe and instrument Easy to use even for beginners Never
FREE
This indicator draw a watermark on the chart, with the timeframe and symbol name. You can change everything, including add a aditional watermark. Functions: Symbol watermark: Size - text size. Font - text font. Color - text color. Background text - watermark at foreground or background mode. Horizontal correction - x correction in pixels. Vertical correction - y correction in pixels. Separator period X symbol - what will separate the period from symbol. Aditional watermark: Enable custom
FREE

Metatrader 5 version of the famous Andre Machado's Tabajara indicator. If you don't know Andre Machado's Technical Analysis work you don't need this indicator... For those who need it and for those several friend traders who asked this porting from other platforms, here it is...
FEATURES
8-period Moving Average 20-period Moving Average 50-period Moving Average 200-period Moving Average Colored candles according to the inflexion of the 20-period MA
SETTINGS You can change the Period of all M
FREE
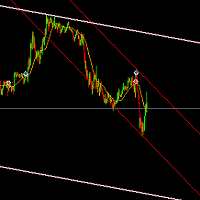
The indicator based on the trading channel in the MT5 trading terminal is a tool that automatically builds a channel formed by the peaks of the price chart in an upward and downward sequence. This indicator helps traders identify support and resistance levels, market trends, as well as set stop-loss and take-profit levels for optimal trade management. This version of the indicator is equipped with a basic trading logic, which can be disabled in the settings and used as an indicator for your tra
FREE

This indicator displays Pivot-Lines, preday high and low, preday close and the minimum and maximum of the previous hour. You just have to put this single indicator to the chart to have all these important lines, no need to setup many single indicators.
Why certain lines are important Preday high and low : These are watched by traders who trade in a daily chart. Very often, if price climbs over or falls under a preday low/high there is an acceleration in buying/selling. It is a breakout out of
FREE

This indicator is very useful for day traders or short term traders. (MT5 version) No need to calculate the number of pips manually, just look at the chart and you will see the Virtual Take Profit / Virtual Stop Loss target line and evaluate whether the entry point is feasible to reach the intended target or not.
Enter the intended Take Profit / Stop Loss pips for your trade. The indicator will display Virtual Take Profit / Virtual Stop Loss lines for you to easily see if the target i
FREE

ChartWall is intended for displaying and automatic changing of wallpapers on a chart. It supports JPG and BMP formats. A file and a display style are selected via the built-in panel, which can be opened by clicking on the application icon (hidden button) that appears in the bottom left corner of the chart (main window) as you move the cursor to that area. Using the built-in panel you can also set a period for the rotation of images in minutes. Image files are selected randomly from the folder t
FREE

Trend Master Chart、必要なトレンド指標です。 チャートをオーバーレイし、色分けを使用してさまざまな市場のトレンド/動きを定義します。 2 つの移動平均と異なるオシレーターを組み合わせたアルゴリズムを使用します。 これら 3 つの要素の周期は変更可能です。 どの時間枠やペアでも機能します。
上昇トレンドまたは下降トレンド、およびこのトレンドへのさまざまなエントリーポイントを一目で識別できます。 たとえば、顕著な上昇トレンド (薄緑色) では、このトレンド内のさまざまな市場インパルスが濃い緑色のローソク足で表示されます。 設定可能なアラートを使用すると、これらの衝動を決して見逃すことがなくなります。
MT4のバージョンです。
入力パラメータ:
Period 1: 高速期間移動平均。
Period 2: 低速期間の移動平均。
Oscillator period: オシレーター周期。
Sell/Buy alert: 市場衝動アラート、トレンドエントリーポイント。 Bullish/Bearish alert: トレンドが
FREE

OBV MACD
Calculating MACD based on OBV data Features
3 outputs: MACD & Signal & Histogram 4 Colored Histogram Smoothing factor show/hide option for MACD & Signal lines Description
Among the few indicators developed for working with volume data, OBV (On Balance Volume) is the simplest yet most informative one. Its logic is straightforward: when the closing price is above the previous close, today's volume is added to the previous OBV; conversely, when the closing price is below the previous cl
FREE

Cybele: The Less is More Do you ever think, if you really need to open many positions to make mo ney? Or have you ever thought that it could be better to open one position to make $80 instead of opening 80 positions to make $80. Which is better for you? In the first trading approach you take the risk only one time in a good quality trade setup. In the second approach, you take the risk 80 times in low quality trade setups. The most professional traders prefer the first approach and they patie
FREE

The Expert Advisor for this Indicator can be found here: https://www.mql5.com/en/market/product/115445 The Break of Structure (BoS) and Change of Character indicator is a powerful tool designed to identify key turning points in price movements on financial charts. By analyzing price action, this indicator highlights instances where the market shifts from a trend to a potential reversal or consolidation phase.
Utilizing sophisticated algorithms, the indicator identifies breakouts where the str
FREE

Fair Value Gaps (FVG) and Liquidity Voids are price ranges you can exploit for better entries and exits on your trades. They're similar concepts, so let's look at them from the top and break it down. Think of FVG and Liquidity voids as soft-spots in the market. They are paths of least resistance. That doesn't mean price will go through them, but price could go through them more easily.
To find and locate it is easy but tidiest to repeat the same thing all over again. This helps to boost your
FREE

クォンタムダウ・ジョーンズ クォンタムダウ・ジョーンズ 設定 シンボル: US30 時間枠: 5M ロット: ロット 取引あたりの平均利益 最大ドローダウン (MAX DD) 2年間の純利益 0.01 $0.20 $2.76 $240 0.10 $2.00 $27.6 $2,400 1.00 $20.0 $276 $24,000 10.0 $200 $2,760 $240,000 概要 クォンタムダウ・ジョーンズは、ダウ・ジョーンズで運用するために特別に設計された洗練された自動取引ツールです。週に平均45-50回の取引頻度で、このボットは先進的な機械学習アルゴリズムと価格行動の技術を組み合わせて、ユニークで非常に効果的な取引体験を提供します。 性能と信頼性 詳細については説明の画像を参照してください。 ドローダウンの削減: 非常に低いドローダウンを維持し、1%以下で、非常に慎重なリスク管理を保証します。 2年間のバックテスト: 厳格な2年間のバックテストを通じて、ボットは顕著な堅牢性と信頼性を示し、印象的な250%の利益を達成しました。 利益因子: 使用するブローカーによって変動する可
FREE

Time Session OPEN-HIGH-LOW-CLOSE This Indicator Will Draw Lines Of OHLC Levels Of Time Session Defined By User. It Will Plot Floating Lines On Current Day Chart. Time Session Can Of Current Day Or Previous Day. You Can Plot Multiple Session Lines By Giving Unique ID To Each Session. It Can Even Show Historical Levels Of Time Session Selected By User On Chart To Do Backdating Test. You Can Write Text To Describe The Lines.
FREE

This EA will make it Entry setup based on first FVG formed, and if the price come back it will open the Order You can set silver bullet time A.M or P.M based on your broker server time
Silver bullet time ( EST NY Time +4 ) London : 3 A.M. to 4 A.M. NewYork AM : 10 A.M. to 11 A.M. NewYork PM : 2 P.M. to 3 P.M.
Set the time for beginning setup.
For increace Accuracy you can set DAILY BIAS with BUY = True / False SELL = True / False You can learn from TTrades video daily bias
https://www.
FREE
This expert advisor trades using the famous super trend indicator: it is completely loyal to the original algorithm and implements many other useful features for the exigent trader, like customizable trading sessions, multi-timeframe filters and many others. [ Installation Guide | Update Guide | Troubleshooting | FAQ | All Products ] Easy to use and supervise Fully configurable indicator settings Customizable break-even, stop-loss, take-profit and trailing-stop settings Works for ECN/Non-ECN br
FREE

The indicator works to convert normal volume into levels and determine financial liquidity control points.
It is very similar in function to Fixed Volume Profile.
But it is considered more accurate and easier to use than the one found on Trading View because it calculates the full trading volumes in each candle and in all the brokers present in MetaTrade, unlike what is found in Trading View, as it only measures the broker’s displayed prices.
To follow us on social media platforms:
tel
FREE

BREAKOUT ALGO is a game-changing trading algorithm designed to capitalize on price breakouts with unparalleled precision and efficiency. This innovative algorithm leverages the power of Fractals to identify key highs and lows in prices while utilizing the simple moving average indicator to determine trend directions with accuracy.
Breakout Algo is engineered to empower traders with the ability to seize breakout opportunities in the market, enabling them to make informed decisions and maximiz
FREE

Volume and RSI-based sniper entry signals for Boom and Crash synthetics feature robust entry alert systems. For more advanced filter signals, consider the Harmonic Hybrid Pro. When trading spikes, three orders are strategically placed to manage risk, with the third order positioned close to the highest probability of a spike. Signals are no longer valid fifteen minutes after the final order, and any losses should be closed promptly. For take profit (Tp), it is advisable to exit shortly after a s
FREE

Just another Auto Fibonacci Retracement indicator . However, this is the most Flexible & Reliable one you can find for FREE. If you use this indicator and you like it, please leave a review/comment. If you are looking for a more advanced Fibo indicator, check this Free Trend-Based Fibo indicator . ### FEATURES ### Auto-calculate up to 7 Fibonacci levels on your customized frame. Adjust levels as your need. Use High/Low price or Open/Close price to calculate. Freeze the levels and don
FREE

マトリックスアローインジケーターマルチタイムフレームパネルMT5 は無料のアドオンであり、マトリックスアローインジケーターMT5の優れた資産です。これは、5つのユーザーがカスタマイズした時間枠と合計16の変更可能なシンボル/機器の現在のマトリックスアローインジケーターMT5信号を示しています。ユーザーは、マトリックスアローインジケーターMT5で構成される10の標準インジケーターのいずれかを有効/無効にするオプションがあります。マトリックスアローインジケーターMT5のように、10の標準インジケーター属性もすべて調整可能です。マトリックスアローインジケーターマルチタイムフレームパネルMT5には、16個の変更可能なシンボルボタンのいずれかをクリックすることで、現在のチャートを変更するオプションもあります。これにより、異なるシンボル間ではるかに高速に作業でき、取引の機会を逃すことはありません。
この無料の マトリックスアローインジケーターマルチタイムフレームパネルMT5 アドオンを使用する場合は、ここでマトリックスアローインジケーターMT5を別途購入する必要があります: https://
FREE

This is just a MACD with multi symbols, multi timeframes, and multi colors. features. different symbols and timeframes from the main chart. draw main line, signal line, and histogram. each line can be erased. the ascent and descent can be distinguished. Due to the above features, this MACD is suitable for multiple lineups in a single chart. This can be used in the same way as MiniCandles.
FREE

(Google 翻訳) 標準の 平均足 ローソク表現には、 指数に相当する始値があります。 合計価格 の移動平均 (EMA) 。 EMA の アルファ 値は固定されています 0.5 ( EMA 期間 3.0 に相当)。 この動的バージョンでは、期間を使用したい任意の値に変更できます。 マルチタイムフレーム分析を概算するか、低値または高値を一種のトレーリング ストップ ロスとして使用します。 の交差点 平均足 の始値を超える実際の 終値 も、変動のシグナルとして使用できます。 トレンド方向。
また、標準の EMA に加えて、このバージョンには Almost Zero-Lag EMA を使用するオプションもあります 代わりに、トレンド方向の変化をより迅速に検出できます。特に、より長い期間の 平均化。
インジケータをチャートに添付する場合、チャートを自動的に ただし、 折れ線グラフ モード とオプションで実際の 終値 を 折れ線グラフ から非表示にすると、 それがなければ、実際の 終値 価格と Heikin Ashi オープンバリュー。 (Original text) The stan
FREE

特徴
価格別の取引量を確認するためのインジケーターです。 主にEURUSDに適用され、他の通貨ペアでは機能しないか、計算に時間がかかる可能性があります。 スムーズな使用のために、「チャートの右端からチャート境界をシフトする」オプションをオンにします(スクリーンショットに表示されています)。 新しいバーが表示されると、データがリセットされます。
変数 COlOR: インジケーターの色の設定 WIDTH: インジケーターの幅の設定 PERIOD: データを計算するための期間の設定
---------------------------------------------------------------------------------------------------------------------------------------------------------------------------
FREE

The advisor "Your False Hope" is a fully automated strategy which trades several symbols, such as AUDUSD, EURUSD, USDJPY, USDNOK and some others. The set of symbols may change while the strategy is improved. I created this strategy as a parody of pipe dreams of Internet users about magical possibilities of machine learning for financial markets. The objective is to show that normalized inputs of any set of symbols can be learned by a neural network. Attention! The advisor uses Gold (Gold or XAUU
FREE
PRICE ACTION Semi-auto trade bot: (SPECIALLY DEIGNED FOR XAUUSD ) This is a simple quantitative model that trades GOLD(XAUUSD) using automatic price action analysis algorithms Place it on any symbol or timeframe. The position sizes are calculated by multiplying 0.01 per USD 500 on account to ensure low risk exposure and also leaving free margin for hedging positions that reduce the overall risk exposure . This is what leads to stability in the model though it is possible that the model like
FREE

The RenkoChart tool presents an innovative and highly flexible approach to visualizing market data in MetaTrader 5. This expert creates a custom symbol with Renko bricks directly on the chart, displaying accurate prices at the respective opening date/time for each brick. This feature makes it possible to apply any indicator to the Renko chart. Furthermore, this tool also allows access to historical brick data through native methods in the MQL5 programming language, such as iOpen, iHigh, iLow and
FREE

The indicator analyzes the volume scale and splits it into two components - seller volumes and buyer volumes, and also calculates the delta and cumulative delta. The indicator does not flicker or redraw, its calculation and plotting are performed fairly quickly, while using the data from the smaller (relative to the current) periods. The indicator operation modes can be switched using the Mode input variable: Buy - display only the buyer volumes. Sell - display only the seller volumes. BuySell -
FREE

Boom and crash Gold Miner v2 trend histogram which works in conjunction with the indicator above that has arrows as shown in the video. PLEASE Note: That the top indicator and the bottom indicator are two separate indicators. the top indicator is https://www.mql5.com/en/market/product/98066 the bottom one is free. which is the histogram at the bottom. the trend histogram trading tool that helps to easy detect the trend blue color indicates an uptrend. Orange color is a down trend.
FREE

これは非常にシンプルなインジケーターであり、誰にとっても使いやすいものです。 ただし、非常に視覚的で、便利で効果的です。 すべての外国為替シンボルと時間枠に適しています。 しかし、私のテストと調査から、時間枠 M1、M5、M15 での使用はお勧めしません。
設定。
- アラートのオン/オフを選択します (デフォルトはオン)。
- 2 つのアラート間の時間 (秒) を選択します。 デフォルトは 30 秒です
使い方?
- 上昇トレンド - バーの色が緑色の場合。 - 下降トレンド - バーの色がオレンジの場合。 - バーの色が変わると反転します。
使用上の推奨事項
上昇トレンドでの買いとバーの高値はほぼ同じです (緑色)。 下降トレンドでの売りとバーの高値はほぼ同じです (オレンジ色)。 反転が発生したときに市場に参入することは避け、2 または 3 バーの継続を検討してください。 必要に応じて、上昇トレンドと下降トレンドのバーの色を変更することもできます。
KPLスイングインジケーターと組み合わせれば完璧 KPL Swing Indicator
FREE
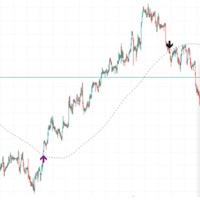
If the price is cutting above the slow length moving average, a breakout may occur. If the price is cutting below, a pullback may occur in the market. This was known for a long time, but there aren't many indicators which signal on the event. Candlestick pattern validation is also used in this indicator so that signals will not be drawn on doji candles or small "uncertainty" candles. The length of the moving average period can be defined by the user (default is 200). The number of price movement
FREE

This is Wilder's ADX with cloud presentation of DI+ & DI- lines. Features
4 standard lines of the ADX indicator: DI+, DI-, ADX, ADXR cloud presentation of DI+/DI- lines with transparent colors applicable to all time-frames and all markets
What Is ADX
J. Welles Wilder Jr., the developer of well-known indicators such as RSI, ATR, and Parabolic SAR, believed that the Directional Movement System, which is partially implemented in ADX indicator, was his most satisfying achievement. In his 1978 boo
FREE

ザ トレーダーのベストパートナー! 取引アシスタント: これは非常に機能が豊富な取引支援ツールです。 開発は簡単ではありません。Pro をサポートしてください。クリックしてジャンプしてください。
KトレードアシスタントプロMT5
取引アシスタントの操作手順
基本的な使用設定 基本: 言語選択スイッチをサポート (現在中国語と英語をサポート) 自動言語認識 バインディングをサポート ポジションを開閉するホットキー 、ショートカット キーを使用してポジションをすばやく開閉します... ポジションを閉じるためのショートカット キー。 ロック解除はほとんどの機能をサポートします リプレイ で使用できる操作 テスト環境 オープンポジションとクローズポジション: ワンクリックでポジションをオープン ( テイクプロフィットとストップロスの便利な設定、ロットサイズの自動計算などの便利な機能を含む) ワンクリックで閉じる (ロック)、ミニマリストスタイルのデザイン、クローズポジションのタイプ
FREE
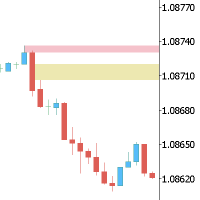
This Expert is the perfect companion for SMC/ICT users.
It allow to draw easily the Supply , Demand , Imbalance(fvg) zones as well set up MetaTrader alerts if price touchs the zone. Imbalance (fair value gap) have options to be displayed in full or based on the filling to the follwing candle, so you will never miss one.
You can also zoom on a clande with a specific period. Very usefull when you look at an 1h candle in the past and you want to see the details in M5.
How does it work ? Simpl
FREE

This Engulfing Candle Indicator as the name implies can detect engulfing candlestick patterns on the chart. The indicator alerts the user of the presence of an engulfing candle (Bearish engulfing candle and Bullish engulfing candle) by using visual representation of arrows on the chart. - Blue arrow for Bullish engulfing - Red arrow for Bearish engulfing Extra modifications can be added based on request.
FREE
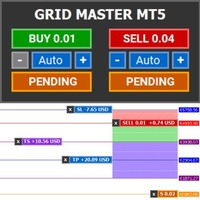
Introducing Grid Master MT5, your ultimate trading utility designed to revolutionize the management of single or multiple orders with unparalleled ease and effectiveness.
Evaluation version of Grid Master MT5 Some limitations are applied: - Maximum of 3 open positions and 1 pending order per side (Buy/Sell) - Trailing Stop feature disabled - Economic calendar and news protection disabled - Trade event push notifications disabled Features: Clean and user friendly UI: With the benefits of fellow
FREE
Introduction
Dynamic grid M5 expert for those who have grid systems as their favorite. Relatively very simple algorithm that can trade on most common Forex majors and minors on any time frame. There are no guarantees that the algorithm lives up to high expectations or that any positive historical results achieved in the strategy tester guarantee the same in the live/demo future trading. Traded time frame and symbol Any time frame Forex majors and minors Characteristic features Volume (lots)
FREE

Introduce: This Expert Advisor Is Hedging Style Buy or Sell Market Then Pending Buy with Hedge Distance Your Setup at begin if Sell site, Sell Pending if Buy Site. I recommend you if you want to use hedge robot please ask your broker first if they allow to use hedge trading so then you can use this robot. My default setup for XAUUSD,M15,1000usd Balance if you guys need to run with forex currency pairs just backtest seeking a best setup for each pairs because pips point are not the same each ot
FREE

The indicator plots a trend channel using the technique by Gilbert Raff. The channel axis is a first-order regression. The upper and lower lines show the maximum distance the Close line had moved away from the axis line. Therefore, the upper and lower lines can be considered as resistance and support lines, respectively. A similar version of the indicator for the MT4 terminal
As a rule, most movements of the price occur within a channel, going beyond the support or resistance line only for a s
FREE

Introduction to the Candle Time Indicator The Candle Time Indicator for MetaTrader 5 (MT5), helps users know how much time on a candlestick is remaining. This is a simple but incredibly powerful and useful tool. To download the Dagangduit CandleTimer.ex5 indicator, check the bottom of this post. It’s one of the best forex time indicators in its category. The function of the indicator will not change, even if you change the name of the indicator. The candlestick countdown timer will tell you how
FREE
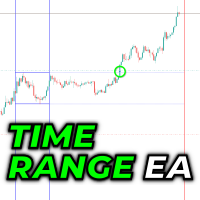
This is a simple Time Range Breakout EA with dynmaic lot size, trailing stop loss and day of week filter. The coding tutorial for the core logic is on my youtube channel.
If you have any questions or suggestions for improvement, you can write to me at any time.
Current components: Magicnumber Dynamic lot size (fix lots/fix amount/percent of account) Time range breakout entry signal
Day of week filter Trailing stop loss
FREE

移動平均線付き出来高は、移動平均線を使ったシンプルで分かりやすい出来高インジケーターです。
使い方は?
サポート/レジスタンス・レベルやトレンド・チャネルのボラティリティ・ブレイクアウトからエントリーする際のシグナルのフィルタリングに適しています。また、出来高によってポジションを決済するシグナルにもなります。
入力パラメータ
Volumes - リアルまたはティックの出来高。 MA_period - 移動平均期間。
移動平均線付き出来高は、移動平均線を使ったシンプルで分かりやすい出来高インジケーターです。
使い方は?
サポート/レジスタンス・レベルやトレンド・チャネルのボラティリティ・ブレイクアウトからエントリーする際のシグナルのフィルタリングに適しています。また、出来高によってポジションを決済するシグナルにもなります。
入力パラメータ
Volumes - リアルまたはティックの出来高。 MA_period - 移動平均期間。
FREE

前日の終値とバーのシフト - MetaTrader用のツール! 前日の終値とバーのシフトインジケーターは、テクニカル分析とトレードの意思決定を向上させるために設計されたツールです。このインジケーターを使用すると、任意のバーのオープン、ハイ、ロー、クローズの詳細な情報にアクセスでき、市場の動きを正確かつ包括的に分析することができます。 自分のチャート上でタイムフレームを重ねることができると想像してみてください。これにより、現在のタイムフレーム内でさまざまな時間枠の各バーを詳細に分析することができます。前日の終値とバーのシフトインジケーターを使用すると、この素晴らしい機能が手の届くところにあります。 前日の終値がサポートとレジスタンスとしての重要性は、トレーダーのコミュニティで広く認識されています。このツールを使うことで、前回の終値で価格が停止したレベルを明確かつ正確に確認できるため、購入と売却の意思決定に貴重な洞察を提供します。 インジケーターをチャートに適用すると、前日のオープン、ハイ、ロー、クローズの重要な情報にすぐにアクセスできます。これらの情報は視覚的に魅力的に強調表示されます。
FREE

インジケーターは現在のシンボルの利益(損失)を表示します。 線を自由にドラッグ&ドロップして現在の損益を表示できます。
パラメーター
Calculation in money or in points — 損益をポイントまたは金額で計算します。 Add pending orders to calculate — 計算では未決注文を考慮します。 Magic Number (0 - all orders on symbol) — 特定の注文を評価する必要がある場合のマジック ナンバー。 Offset for first drawing (points from the average price) — 最初の開始時の平均価格からのラインのオフセット。 Decimal places for calculating the Sum — 合計を表示するための小数点以下の桁数。 Decimal places for calculating the Percentage — パーセンテージを表示するための小数点以下の桁数。
Tuning チューニング Color of the
FREE

his is a custom indicator based on double-average crossing and arrow marking.
Make multiple lists when blue arrows appear up.
Make a blank list when the red arrow appears down.
When the pink line crosses the green line upwards, the pink line is above, the green line is below, the golden fork appears, and the blue arrow appears.
When the pink line crosses down through the green line, the pink line is below, the green line is above, a dead fork appears, and a red arrow appears.
This is
FREE

The Fibonacci Trader MQL5 expert advisor uses the Fibonacci levels to determine a buy or sell trade with the MACD as confirmation. The Fibonacci levels work as follows: Above 61.8
SELL if MACD trend is SELL Trading Range (Ability to select trading input parameters)
BUY if MACD trend is BUY SELL if MACD trend is SELL Below 23.6
BUY if MACD trend is BUY
Default settings are configured for EURUSD on M5 Chart. To work with the news server, you must add the URL ‘ http://ec.forexprostools.com/ ’
FREE

The Fractal Trend Master is an advanced Expert Advisor that applies the trading system developed by Bill Williams, combining the Alligator indicator with fractals to identify and follow market trends. It opens buy positions when an upper fractal forms above the Alligator's teeth line, and sell positions when a lower fractal forms below the Alligator's teeth line. This EA is ideal for traders seeking a robust, automated system based on solid technical analysis. You can use any timeframe; however,
FREE

This Indicator is based on 4 Exponential Moving Averages ie. 3 EMA-32 (applied to prices close, high & low), and EMA-200 (indicating trend direction). The EMA32-200 produces quality buy and sell entries indicated by arrows and signal alert that appears whenever the price moves above the EMA-200 and returns below the EMA-32s and returns to break above the previous swing high triggering a high probability buy entry. The Sell conditions are the opposite of the buy conditions.
FREE

Emulate TradingView drawing experience with magnet snap to the nearest price. A handy precision drawing tool for trading: ICT SMC (Smart Money Concept) Demand & Supply FVG (Fair Value Gap) Breakout Trend Following Reversal MTF (Multiple Timeframe) Price Action Support & Resistance Elliott Wave Supported drawing tools: Vertical Line Horizontal Line Trend Line Horizontal Ray (Angle Trend Line) Fibonacci Retracement Rectangle
Input: Threshold (px) : The distance in pixel unit to snap the
FREE

This is a conventional volume indicator, which displays the ticks or real volume (if available from your broker). But it has others features like: 5 color schemes: single, when crossing with moving average, when crossing a specific level, when having different volume between bars and when candle change color. Being hable to have a customizable moving average. Being hable to have a value indicator line. Many thanks to Diego Silvestrin for the ideas to version 1.1 and Konstantin Demidov for
FREE

BandPulse is a powerful trading expert that combines Martingale, Hedging, and Scalping strategies, simplifying the management of trading complexities. This EA uses advanced algorithms to maximize the strengths of each strategy while meticulously managing risks.
The balance-based risk management feature provides users with safety, and when used in conjunction with IAMFX-Agent , it can achieve both risk management and profit maximization.
This combination is designed to offer users the best p
FREE

Spike Catch Pro 22:03 release updates Advanced engine for searching trade entries in all Boom and Crash pairs (300,500 and 1000)
Programmed strategies improvements Mx_Spikes (to combine Mxd,Mxc and Mxe), Tx_Spikes, RegularSpikes, Litho_System, Dx_System, Md_System, MaCross, Omx_Entry(OP), Atx1_Spikes(OP), Oxc_Retracement (AT),M_PullBack(AT) we have added an arrow on strategy identification, this will help also in the visual manual backtesting of the included strategies and see h
FREE

Please if possible consider the paid version which I will continue to develop (there will be no future updates for this free version).
This Expert Advisor identifies when a divergence occurs between price and an oscillator/indicator. It identifies both regular/classical (trend reversal) and hidden (trend continuation) divergences. It has RSI, bollinger, stochastics, moving average and ADX filter options which makes it possible to filter out only the strongest setups. The default settings ar
FREE

GOLD ESCAVATOR TRADING BOT A trading bot for XAUUSD. Lot size is calculated by multiplying the lot factor by each 100 USD on account. NB: These are risky strategies which give good returns over time but also pose a risk of blowing up your account. Use on your own accord. LINKS Automatic Pattern and Trendline Analyst : https://www.mql5.com/en/market/product/88794 Automatic Price Action Level Plotter: https://www.mql5.com/en/market/product/94338 MQL5 SIMPLIFIED SUMMARY; learn how to code your
FREE

YOU CAN NOW DOWNLOAD FREE VERSIONS OF OUR PAID INDICATORS . IT'S OUR WAY OF GIVING BACK TO THE COMMUNITY ! >>> GO HERE TO DOWNLOAD
The Volatility Ratio was developed by Jack D. Schwager to identify trading range and signal potential breakouts. The volatility ratio is defined as the current day's true range divided by the true range over a certain number of days N (i.e. N periods). The following formula is used to calculate the volatility ratio: Volatility Ratio (VR) = Today's True Rang
FREE

ARCA bot - a full-featured, non-syndicated, automated system that uses a time-tested grid strategy adapted to modern conditions. This methodology has appeared since the inception of the financial markets and is still used by many professional traders and hedge funds, as it has shown good results for decades. The expert is fully automated and must be on 24 hours a day to work, so we recommend to use VPS-server, which will provide uninterrupted work of the expert.
Characteristics: Platform: MT
FREE

Ichimoku Trend Alert is the Ichimoku Kinko Hyo indicator with Alerts and signal filters.
Ichimoku Trend Alert features: Optional check of Ichimoku cloud, Tenkan sen(Conversion Line), Kijun sen(Base Line), Senkou span A, Senkou span B, and Chikou span relative to price, and more. Popup, email, and phone notification alerts for selected symbols and timeframes.
There are 9 classic Ichimoku trend filters you can enable/disable in settings: Price/Cloud Order: Checks the price position relative
FREE

Engulfing Candle Detector
Detectable pattern Double Candlestick Patterns Bullish Engulfing
The first candle is black candle. The second candle opens with a gap below the real body of the black candle but rallies upwards to close above the real body of the black candle. In other words, the second candle's real body completely engulfs the first candle's real body Bearish Engulfing
The first candle is white candle. The second candle opens with a gap above the real body of the white candle but
FREE

MT4 Version MA Ribbon MT5 MA Ribbon is an enhanced indicator with 8 moving averages of increasing periods. MA Ribbon is useful to recognize trend direction, reversals and continuation points in the market as well as potential entry, partial take profit and exit points. Entry points for long and shorts position can be found when the price entries or leaves the Ribbon, at retest or a defined number of MA crossovers. It offers a good combination with mostly any volume or momentun indicators to
FREE

Candle Time CountDown By BoakroTraderFx The Candle Timer Countdown Indicator is a versatile tool designed for the MetaTrader 5 (MT5) trading platform. It provides traders with a visual countdown of the remaining time for the current candle on a chart. The key features include:
Customizable Position: Place the countdown timer in any corner of the chart for optimal visibility. Default Text Color: Set to red for clear visibility, with options for further customization. Minimal Display: Shows onl
FREE

With this easy to set up indicator you can display and set alerts for the following candlestick formations: Bull Breakout, Bear Breakout, Hammer, Pin, Bullish Engulfing, Bearish Engulfing. Input parameters: ShortArrowColor: The color of the Arrows, displaying a Bearish candle formation LongArrowColor: The color of the Arrows displaying a Bullish candle formation BullishEngulfing: Disabled/Enabled/EnabledwithAlert BearishEngulfing: Disabled/Enabled/EnabledwithAlert Pin: Disabled/Enabled/Enabledw
FREE

What is MACD?
MACD is an acronym for Moving Average Convergence Divergence .
This technical indicator is a tool that’s used to identify moving averages that are indicating a new trend, whether it’s bullish or bearish.
There is a common misconception when it comes to the lines of the MACD.
There are two lines:
The " MACD Line " The " Signal Line "
The two lines that are drawn are NOT moving averages of the price.
The MACD Line is the difference (or distance) between two moving
FREE

VWAP, or volume-weighted average price, helps traders and investors observe the average price that major traders consider the "fair price" for that move. VWAP is used by many institutions to set up large operations.
In this indicator, you can enjoy the following features:
Daily VWAP, with option to display your current price next to the chart VWAP Weekly, with option to display your current price next to the chart Monthly VWAP, with option to display your current price next to the chart
FREE

KPL Swing インジケーターは、入出金を自動化する簡単なトrendフォローのメカニカルトレーディングシステムです。システムはハードストップロスとトレーリングストップロスを使用して利益トレードから出金します。ターゲットは与えられず、価格がどこまで(または低い)移動するか誰も知りません。トレーリングストップロスは収益をロックインし、トレードから感情を取り除きます。 Amibroker インジケーターから変換し、修正しました。 KPL Swing インジケーターは、入出金を自動化する簡単なトrendフォローのメカニカルトレーディングシステムです。システムはハードストップロスとトレーリングストップロスを使用して利益トレードから出金します。ターゲットは与えられず、価格がどこまで(または低い)移動するか誰も知りません。トレーリングストップロスは収益をロックインし、トレードから感情を取り除きます。 Amibroker インジケーターから変換し、修正しました。
と組み合わせれば完璧 KPL Chart Uptrend & Downtrend
FREE
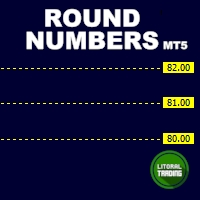
Round numbers (or key levels) is an amazing strategy. These numbers are strong support and resistance levels. So what this indicator does is draw horizontal lines on the chart to help you find these levels. Configurations: Key levels in pips - distance between the lines. Color - lines color. Style - lines style. Width - lines width. Display at background - draw lines in front or back of candles. Selectable - turn on or off the option to select the lines. Lines identification - identifica
FREE
Candle_Timer_and_Spread インジケーターは、選択したシンボルのスプレッドとともに、ローソク足の終了までの時間と価格変化の割合を 1 つのチャートに表示します。
現在の時間枠のローソク足の終わりまでの時間と、その日の始値に対するパーセンテージでの価格変化のタイマーは、デフォルトでチャートの右上隅に表示されます。 パネルには、選択したシンボルのその日の始値に対する現在の価格のスプレッドと変化率が表示されます。パネルはデフォルトで左上隅に配置されます。
入力設定: Candle_Time_Lable_Settings - ローソク足の終わりまでの時間と現在のシンボルの価格の変化に関するタイマーのタイプの設定。 Font_Size - フォント サイズ。 X_offset - 横軸に沿ってシフトします。 Y_offset - 縦軸に沿ってシフトします。 Text_color - フォントの色。 Multi_Symbol_Settings - マルチシンボル パネルの設定。 Symbols_to_work - パネルに表示するシンボルをカンマで区切って手動で入力し
FREE

Что такое Heiken Ashi? Heiken Ashi — это метод построения графиков, который можно использовать для прогнозирования будущего движения цены. Он похож на традиционные свечные графики. Однако в отличие от обычного свечного графика, график Heiken Ashi пытается отфильтровать часть рыночного шума для лучшего определения трендовых движений на рынке. Как рассчитать Heiken Ashi?
Heiken Ashi использует формулу COHL, которая означает «Закрытие, Открытие, Максимум, Минимум». Это четыре компонента, кото
FREE

BBTrend is a powerful trend analysis tool designed to provide a clear overview of market volatility and trends at a glance.
This indicator calculates the difference between two Bollinger Bands of different periods,
visually indicating the strength of upward or downward trends to traders. Clear Trend Visualization: The upward trend is represented in green, and the downward trend in red,
allowing traders to intuitively grasp the direction and strength of the trend. Standardized Percentage D
FREE
MetaTraderマーケットは、履歴データを使ったテストと最適化のための無料のデモ自動売買ロボットをダウンロードできる唯一のストアです。
アプリ概要と他のカスタマーからのレビューをご覧になり、ターミナルにダウンロードし、購入する前に自動売買ロボットをテストしてください。完全に無料でアプリをテストできるのはMetaTraderマーケットだけです。
取引の機会を逃しています。
- 無料取引アプリ
- 8千を超えるシグナルをコピー
- 金融ニュースで金融マーケットを探索
新規登録
ログイン