YouTubeにあるマーケットチュートリアルビデオをご覧ください
ロボットや指標を購入する
仮想ホスティングで
EAを実行
EAを実行
ロボットや指標を購入前にテストする
マーケットで収入を得る
販売のためにプロダクトをプレゼンテーションする方法
MetaTrader 5のための無料のエキスパートアドバイザーとインディケータ - 13

DESCRIPCION GENERAL * Bot automático * Bot de uso exclusivo de la plataforma binary.com donde se podemos encontrar los Sintéticos * Mercado de Sintéticos recomendado Range Break 200 * Deposito mínimo para el Bot 1 000 USD CONFIGURACION * No cambiar los valores de las Bandas de Bollinguer * En el parámetro TP_of_SL poner 100 * El stop loss es automático *Temporalidad de vela recomendada 1 minuto Como recomendación si quieres usarlo con menos capital se sugiere que cambies el parámetro de mu
FREE

After purchasing, you can request and receive any two of my products for free!
После покупки вы можете запросить и получить два любых моих продукта бесплатно! The fully automated algorithm is designed for long-term XAUUSD gold trading, does not require intervention and additional settings, without fairy tales and super profitability. The EA does not use dangerous trading methods like grid and averaging. The EA has four trading strategies based on Bollinger Bands, Moving Average, MACD and Chai
FREE

The purpose of using Smart money index (SMI) or smart money flow index is to find out investors sentiment. The index was constructed by Don Hays and measures the market action. The indicator is based on intra-day price patterns. The beginning of the trading day is supposed to represent the trading by retail traders. The majority of retail traders overreact at the beginning of the trading day because of the overnight news and economic data. There is also a lot of buying on market orders and shor
FREE

すべてのストラテジーをスキャンし、選択したアクティブのすべてのタイムフレームでの買いポイントと売りポイントを表示するスキャナーをお持ちになったことはありますか? それがまさにこのスキャナーが行うことです。このスキャナーは、 Rule Plotter: プログラミング不要のストラテジー作成ツール で作成した買いシグナルと売りシグナルを表示し、さまざまなアクティブとタイムフレームで実行するために設計されています。 Rule Plotterのデフォルトストラテジーは陽線と陰線だけです。つまり、Rule Plotter内に何のストラテジーも描かない場合、このスキャナーは選択したアクティブのすべてのタイムフレームでのキャンドルの色を表示します。キャンドルが陰線の場合は赤で、陽線の場合は緑です。 好きなだけストラテジーを作成 標準のストラテジーに制限されることはありません。Metatraderで利用可能なすべての指標を使用して従来のストラテジーを構築するか、お好きな指標を使用してカスタムストラテジーを構築できます。 このスキャナーはRule Plotterが提供するもののほんの一部であり、Rule
FREE

The SP_15_841517662_S_BB_CF_SQX is an algorithmic trading strategy for MetaTrader, tested on SP using the M15 timeframe from December 7, 2017, to June 2, 2023 . There is no need to set up parameters, all settings are already optimized and fine-tuned.
Recommended broker RoboForex because of EET timezone.
You can find the strategy source code for StrategyQuant at the link: http://quantmonitor.net/listing/sp500-pips-hunter/
Key details are:
MagicNumber: 841517662
Main Chart: Current
FREE

キャンドルボットのご紹介 - ローソク足パターンを認識しトレードするための究極の無料ツール!キャンドルボットを使用して、簡単に高値と低値の両方に認識できる牛さんと熊さんのエングルフィング、モーニングスター、イブニングスター、そしてハンマーシグナルを活かし、市場で優位性を得ましょう。特定の期間にわたる始値、高値、安値、終値から導き出されたローソク足パターンは、価格動向の視覚的な表現となり、トレーダーが市場センチメントを分析し、潜在的な逆転や継続を予測するのに役立ちます。 ローソク足パターンの理解: エングルフィングパターン: 二つのローソク足から成り立ち、二つ目のローソクが完全に最初のものを覆います。ベアッシュエングルフィングは下降トレンドの終わりにおいて上昇トレンドの反転の可能性を示し、ブルッシュエングルフィングは上昇トレンドの終わりにおいて下降トレンドの反転の可能性を示唆します。エングルフィングキャンドルの本体が大きいほど、そのシグナルは強力です。 ハンマーパターン: 一本のローソク足で、本体が上部近くに小さく、下部に長い尾を持つハンマーのような形です。ブルッシュハンマーは下降トレン
FREE

RSIBand Pro EA is a hybrid strategy that has been tested and optimized using 100% History Quality from 2012 to 2023. Its main signal is based on Bollinger Bands, with RSI as a confirming signal to identify trends.
Supported currency pairs: AUDCAD Recommended timeframe: M15
MT4 Version: Click Here
Backtest Modelling quality: 100% History Quality Spread: Variable Time Period: 2012 – 2023.10 Symbol: AUDCAD Timeframe: M15 Dynamic lot: Dynamically sets the lot size based on the current b
FREE

One of the best tools for analyzing volume,
Weis Wave was idelized by David Weis, to facilitate the reading of directional flow. For the VSA method disciples it is an evolution of the practices created by Richard Wycoff, facilitating a predictive reading of the market, always seeking an accumulation and distribution of the negotiated contracts.
Cumulative wave volume Range of wave ( removed) Average Wave volume Ref "Tim Ord lectures" ( removed)
FREE

Introduction
The RSI Plus is an innovative technical analysis tool designed to measure the strength and direction of the market trend. Unlike the traditional RSI indicator, the RSI Plus boasts a distinctive ability to adapt and respond to market volatility, while still minimizing the effects of minor, short-term market fluctuations.
Signal
Buy when the RSI plus has been in the oversold (red) zone some time and it crosses above the 20 level on previous candle close
Sell when the RSI
FREE

MaRSI Scalper & Trader The combination of moving averages and RSI This setting is flexible so it can be set with regards to user test uses 1. For scalping 2. For long time trading
features 1. Sends push notifications 2. Sends alerts on computers 3. Draws Arrows 4. Draws respective indicators (this feature will be edited in the future)
Have feedback https://t.me/Tz_Trade_Logics or just call +255766988200 (telegram/whatsApp) Head to discussion page to leave your comments Improvement are on t
FREE

Experience the exhilarating world of trading with Boom or Bust, the groundbreaking MT5 trading game that takes your skills to the next level. Get ready to embark on a thrilling journey of virtual trading, where you can test your strategies and immerse yourself in the dynamic world of financial markets—all without risking real money. Experience the exhilarating world of trading with Boom or Bust, the groundbreaking MT5 trading game that takes your skills to the next level. Get ready to embark on
FREE

Trendy Stock is a price following indicator that uses Stochastic to show when the price is out of the oversold or overbought areas. The algorithm allows you to stay longer in a trend where the bulls or bears are in control. The indicator changes color immediately the price exits oversold/overbought state. In short, the downtrend [red] bars start to paint when the buying pressure decreases while the uptrend [green] bars form as the buy pressure kicks in. For MT4 version, follow :: https://www
FREE

Adiciona marca d'água com nome do ativo em negociação. Pode ser ajustado definindo tamanho da fonte e coloração do texto. Testado com vários ativos do mercado B3 e Forex Adione ao gráfico e configure de acordo com a necessidade. Caso tenha problemas sinta-se a-vontade para nos avisar e providenciaremos a correção logo que possível. ______________________________
FREE

Airiamu ni aimashou. Kanojo wa māchingēru ya guriddo shisutemu o shiyō shite imasen. Tesuto wa EURUSD H 1 de okonawa remashitaga, hoka no tsūka pea mo kinō suru kanōsei ga arimasu. Watashi wa kono botto o sakusei suru tame ni nemurenu tsuki o nan-kagetsu mo tsuiyashimashitaga, tekisetsuna tesuto o hete hajimete, kyōyū suru junbi ga dekita to kanjimashita. Okonawa reta tesuto no sukurīnshotto ga fukuma rete imasu. Deforuto settei wa watashi ga shiyō shita monodesu. Gaikoku kawase torihiki ni wa t
FREE

Overview: The trading robot is an software designed to operate on the EUR/USD currency pair. It is optimized for an H1 (one-hour) trading timeframe, suitable for traders looking for a balance between short-term and medium-term trading strategies. Technical Indicators Used: Relative Strength Index (RSI): The robot incorporates the RSI to measure the velocity and magnitude of directional price movements. It helps identify overbought or oversold conditions in the trading of an asset. Bollinger Band
FREE

Always backtest before using.
MintyGrid is a simple EA that has an RSI indicator. On winning trades MintyGrid will take profit based on configuration. On losing trades MintyGrid uses a grid strategy to place resistance points using a martingale/reverse-martingale strategy to be prepared for when the market swings in the opposite direction. MintyGrid can be configured to run on many currency pairs simultaneously and will work as long as the pairs are similar in price. MintyGrid always trades w
FREE

McS Super Trend -This is one of the most popular classic trend indicators. It has a simple setting, allows you to work not only with the trend, but also displays the stop loss level, which is calculated by this indicator. Benefits:
Instruments: Currency pairs , stocks, commodities, indices, cryptocurrencies. Timeframe: М15 and higher. Trading time: Around the clock. Shows the direction of the current trend. Calculates the stop loss. It can be used when working with trading. Three types of n
FREE

Description: The Custom Moving Averages indicator displays three different moving averages on the chart: a 10-period Simple Moving Average (SMA10) in lime, a 21-period Simple Moving Average (SMA21) in red, and a 200-period Exponential Moving Average (EMA200) in thicker white. This indicator helps traders identify trends and potential entry/exit points based on the behavior of these moving averages. Features: Three moving averages in different periods: SMA10, SMA21, and EMA200. Customizable color
FREE

John Bollinger created this indicator in 2010 as a way to read the original indicator (Bollinger Bands) in a more "technical" way, shown as an oscillator. The typical range of the Bollinger Bands %B is 0 - 0.5 - 1.0, where "0" represents the lower band, the "0.5" the middle band, and "1" the upper band. The line on the indicator represents the Closing prices. As simple as that.
SETTINGS
Bollinger Bands period of analysis Standard Deviation multiplier Shift Price type to be analyzed
If you
FREE

Вилка Нео v5, разрабатывалась для торговой системы "Оракул", но постепенно дополнялась, например - углами Ганна и другими опциями... Можно создавать графические объекты с заданным цветом, стилем и толщиной, такие как: прямоугольники с заливкой и без, отрезки трендлиний и нестандартный инструмент - "вилка Нео" в виде трезубца, так же есть возможность интерактивно настраивать цветовую палитру прямо с графика, настраивать видимость объектов для разных ТФ, толщину и стили...
Панель переключается к
FREE

HighDaily
このエキスパートアドバイザーは、HighDaily、ATR、および保留注文に基づいて、EURUSD H1向けに開発されました。20年以上のティックデータを使用して99%のモデリング品質でバックテストされました。添付されたスクリーンショットは、モンテカルロ分析による1000回のシミュレーションでの堅牢性テストを示しています。より良いパフォーマンスのためにスプレッドとスリッページの少ないブローカーをお勧めします。パラメーターを設定する必要はありません、これらの設定は最適化されています。 大口口座を使用する必要はありません。私は200米ドルから0.01ロットで取引することをお勧めします。
モンテカルロテスト
1000回のシミュレーション ティックデータを30%の確率でランダム化し、最大価格変動ATRを10%上下にランダム化 スプレッドを0から3にランダム化 戦略パラメーターを20%の確率でランダム化し、最大変更10%
テストのワークフロー
IS/OOSテスト、テスト期間を10部分に分割します。 異なる時間枠(30M)でのテスト。 最近性のテスト。 モンテカ
FREE

Expert Advisor = MA Line with Filter Executor = Crossing Candle and Moving Avereage Line Filter = Moving Average, Stochastic, Parabolic SAR
Parameter Information: Lot Mode --> 1 = Fixed Lot, 2 = Freeze%Balance Lot, 3 = Martingale System Position Type --> 1 = Every time there is a signal ea will open a position, 2 = Only one position per trade
you can choose filter some, all or nothing
FREE
Exponential Moving Average indicators are widely used by Forex traders all around.
This EA uses a simple Scalping Strategy using 4 exponential moving averages and have lots of config parameters. EMA1: 9 | EMA2: 13 | EMA3: 21 | EMA4: 200 Basically the EA Strategy place an order when it detects that the last candle touched the 3ª EMA line and the last 5 candles do not touch it.
In order to know more about the strategy, we presented it in our youtube channel: Video with EA Strategy Details:
FREE

Immortal Me uses multi indicators to enter the best position. Result of Strategy Tester of 2023 & 2024 can be found at the screenshots. The indicators uses: . Simple Moving Average. A SMA calculates the average of a selected range of prices, usually closing prices, by the number of periods in that range. . Adaptive Moving Average. The AMA study is similar to the EMA, except the AMA uses a scalable constant instead of a fixed constant for smoothing the data. . Variable Index Dynamic Average. VIDY
FREE

抜群の 追従性と最小限のノイズ ! このトレンド検出インジケーターはノイズや波打ちの影響を最小限に抑えた上で、トレンドの変化に対して機敏に反応します。
また、ダイナミックな市場に合わせて適応するよう設計されてます。
主にトレンドの方向にトレードするのに役立つフィルターとして機能します。 特徴 シンプルで使い方も簡単です。低負荷なので気軽に試せます。 抜群の追従性と滑らかなラインで相場分析に最適です。 既存戦略のトレンドフィルターとして使用できます。 2本のラインでゴールデンクロスとデッドクロスを表示できます。
ローソク足が閉じた後は決してリペイントしません。 すべての 通貨ペア& 時間足に対応しています。 EA開発と互換性があります。
こちらのブログからアラート機能が付いたプロフェッショナル版を特別価格 で 入手できます。
本格的に使用する場合はプロフェッショナル版をお勧めします。 : ここをクリック
パラメーター メイン設定
Period - トレンド計算用の期間です。
Factor - リトレースメントの大きさを指定します。 表示設定
Up colo
FREE

The Market Momentum indicator is based on the Volume Zone Oscillator (VZO), presented by Waleed Aly Khalil in the 2009 edition of the International Federation of Technical Analysts journal, and presents a fresh view of this market valuable data that is oftenly misunderstood and neglected: VOLUME. With this new approach of "seeing" Volume data, traders can infer more properly market behavior and increase their odds in a winning trade.
"The VZO is a leading volume oscillator; its basic usefulnes
FREE
ステップバイステップ「トレーリングストップ」
このユーティリティを使用すると、「トレーリング ストップ」ツールを使用する際に、価格に従って「ストップ ロス」を移動するステップを設定できます。 「MetaTrader」ターミナルで利用可能な「通常の」「トレーリング ストップ」とは異なり、「ストップ ロス」の動きを 1 ピップ単位で設定できますが、この「トレーリング ストップ」は任意の増分で設定されます。 この設定により、価格が一方向に長時間移動した後、小さな修正のために反転し、その後再び同じ方向に移動し続ける場合に、偽のトレンド反転中にポジションを閉じることを回避できます。 可変の「ストップロス」移動ステップで「トレーリング ストップ」ツールの作業を管理しやすくするために、ツールの操作を実装するスクリプトは、開発者の Dmitry Fedoseev によって既存の取引パネル「eInTradePane」に適合されています。 トレーディング パネルのソース コードは、 https://www.mql5.com/en/code/220 で自由に入手できます。 「トレーリングストップ」が追加
FREE

If you like this project, leave a 5 star review. Often times we are using brokers that are outside of the GMT-0 timezone, this
not only complicates things, but, it can make seeing when a trading session starts
a bit more difficult than it should. This indicator allows you to set a timezone offset it will draw a vertical line for the: Day. Week. Month. Quarter. year.
FREE

True Days is a tool designed specifically for the trader who wants to catch intraday volatility in price charts. True day makes it easier for the trader to avoid trading in the dead zone - a period in time where markets are considered dead or non volatile. The trader can concentrate on finding opportunities only during periods of profound market movements. By default the indicator gives you a true day starting at 02:00 to 19:00 hours GMT+2. You can adjust according to your Time Zone. By deafult
FREE

This EA uses the MACD Histogram Strategy. Entries opened when the "D" signal line cross the histogram.
The Buy position entered only when the cross is below the zero line while the Sell position entered above the zero line.
The Moving Average Convergence/Divergence (MACD) is an oscillator that combines two exponential moving averages (EMA)—the 26-period and the 12-period—to indicate the momentum of a bullish or bearish trend. MACD can be used to signal opportunities to enter and exit positi
FREE

Indicator that uses ATR and standard deviation to calculate the current trend. It has the top and bottom line. The top line is shown when it is high, and the bottom line when it is low. The indicator does not draw a trend line or show the trend for the day, or for a certain period. It has the function of indicating the current trend, and may indicate a reversal.
use it with caution and at your own risk.
FREE

This is the Bill Williams Awesome Oscillator indicator calculated from Heikin Ashi candles. Here you find multi-colored histogram which is helpful when identify weakness or strength of trend in the market. To use it, just simply drop it on the chart and you don't need to change parameters except one: switch between Heikin Ashi or normal candles (see attached picture).
FREE

「取引通知」は、オープンまたはクローズされたすべての取引、および各取引の損益結果を モバイル通知または端末アラート で通知することを目的としたユーティリティ ツールです。 これは私自身が長い間使用してきたツールなので、無料で共有することにしました。
入力パラメータ: (すべての入力は true/false タイプであり、 値を変更するにはそれをダブルクリックします) Notify for Closed Positions PnL : true の場合、クローズされた取引の $ 結果を通知します。このようにして、取引がいつ終了するか、そしてその結果について通知されます。
これは、取引の損益の上下を監視しながらチャートに釘付けにならないようにするために便利な機能です。これにより、ストレスの少ない取引が可能になります。 新しく開かれた取引を通知する : true の場合、新しい取引が開かれたときに通知します。 未決注文を設定し、エントリーレベルがいつトリガーされるかを知りたい場合に非常に重要なパラメーターです。
あなたがアルゴ トレーダーで、市場に参入する EA を使
FREE

スタイルが重要だから
キャンドルの色や背景の明暗を変えたり、グリッドを付けたり消したりするために、いちいちプロパティをクリックするのが面倒なのはよくわかります。ここでは、1つのクリックで解決策です。 トレーダーが望むキャンドルのスタイルを選択するための3つのカスタマイズ可能なボタン。 昼と夜のモードを切り替えるには、1つのボタン。 チャート上のグリッドを表示または非表示にするには、1つのボタン。 ***** 設定で、ボタンを画面上のどこに表示するかを選択できます*****。 私の他の製品をチェックすることを検討してください https://www.mql5.com/en/users/javimorales.fer/seller
ストキャスティックRSIとは何ですか?
ストキャスティックRSI(StochRSI)は、テクニカル分析で使用される指標で、ゼロから1(または一部のチャートプラットフォームではゼロから100)の範囲で、標準の価格データではなく、相対強度指数(RSI)の値の集合にストキャスティックオシレーター式を適用して作成されたものです。
執筆者
ハビエル
FREE

Простой советник основанный на сигналах индикатора Relative Strength Index (RSI) в зоне перекупленности - продаем, в перепроданности - покупаем. Моя версия всем известного "Dynamic". Я рекомендую использовать этот советник в полуавтомате.
Добавляйтесь в друзья, присылайте свои интересные стратегии. Возможно после обсуждения всех нюансов напишу советника бесплатно . Параметры: "_Slippage" - Проскальзывание; "_
FREE

The GU_H1_120114111_S_Pi_CF_0712_SQ3 is an algorithmic trading strategy for MetaTrader, tested on GBPUSD using the H1 timeframe from April 1, 2004, to April 24, 2024. There is no need to set up parameters, all settings are already optimized and fine-tuned.
Recommended broker RoboForex because of EET timezone.
You can find the strategy source code for StrategyQuant at the link: http://quantmonitor.net/listing/gbpusd-pivots-trend-master/
Key details are:
Parameters
Main Chart: Curren
FREE

O Indicador valida a força da tendência utilizando o volume negociado. Os candles são mostrados na cor verde indicando força compradora e cor vermelha na força vendedora. O movimento é encerrado pelo SAR parabólico. Vantagens: Filtra distorções de preço sem volume financeiro; Filtra consolidações e movimentos laterais; Filtra divergências de volume pelo indicador Money Flow. Desvantagens: Não filtra todos os falsos rompimentos, visto que rompimentos importantes geram altos volumes financeiros; N
FREE

Introducing the "Super Trend Filter Oscillator," your ultimate trading companion designed to enhance your technical analysis and help you make informed decisions in the financial markets. This innovative oscillator is crafted to provide valuable insights into market trends and price movements, assisting traders like you in identifying potential entry and exit points. Features: Trend Identification: The Super Trend Filter Oscillator excels in detecting prevailing market trends, whether they are b
FREE
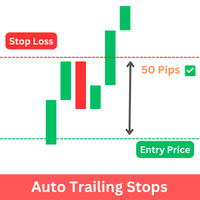
The Expert Advisor (EA) developed is specifically designed for scalping trading strategies . It functions as a trailing stop manager for any positions opened by the user. The EA continuously monitors open positions and dynamically adjusts the stop-loss level as the price moves in favor of the trade. This trailing stop mechanism helps traders secure profits by automatically tightening the stop-loss level as the trade progresses, thereby reducing potential losses and maximizing gains in fast-movi
FREE
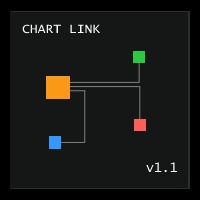
Chart Link allows you to control multiple charts from one chart or multiple charts from multiple charts. Features 1. Synchronised Scrolling : Scrolling the master chart also scrolls all linked sub charts to the same position. Sub charts inherit offset and auto-scroll settings from the master chart. 2. Synchronised Timeframe : Switching the master chart timeframe also switches all linked sub charts. 3. Synchronised Symbol : Switching the master chart symbol also switches all
FREE

AliSession Highlight is an indicator that highlights a specific period of time according to your preferences. It can help you gain a clear vision of price movements into a specific session, the range of a session, and also to easily identify the high and low of the session. You can use it on any currency pairs, indices, and any timeframes. Settings: Start Hour: Set the hour to initiate the session highlight. Start Min: Set the minute for the start of the session highlight. End Hour: Specify the
FREE

The indicator is designed for displaying the following price levels on the chart: Previous day's high and low. Previous week's high and low. Previous month's high and low. Each of the level types is customizable. In the indicator settings, you set line style, line color, enable or disable separate levels.
Configurations ----Day------------------------------------------------- DayLevels - enable/disable previous day's levels. WidthDayLines - line width of daily levels. ColorDayLines - lin
FREE
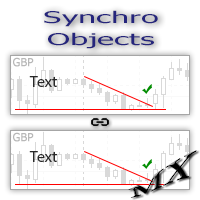
The SynchroObjects utility is designed to facilitate and speed up the work with graphic constructions on different charts of one symbol. The SynchroObjects utility clones the created objects to all charts on which the utility is running and which have the same symbol. And also synchronously changes their properties. The utility is easy to use and requires no configuration. Tip: If you view the history frequently - we also recommend you to also install the free Smart AutoScroll utility. It automa
FREE
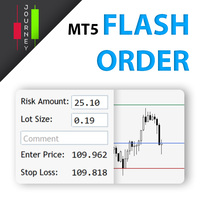
Trading has never been easier! Let's check this out! MT4 version: https://www.mql5.com/en/market/product/72118 The story: How I boost up my trading speed without any "Invalid SL or TP" error
NOW ALL YOU NEED TO DO IS Drag the lines Press Open Order button Enjoy! With this tool, you will no longer have to enter prices manually, which can cause many mistakes and you could miss the trade! From the board, we have: Risk Amount : the risk you want to apply for your trade Risk Unit : USD : If sel
FREE

XAUUSD H1 Broker- VANTAGE RAW/EXNESS ZERO ACCOUNT MINIMUM DEPOSIT 200$ XAUUSD H1 According to the margin adjust the risk setting trade with EA goldsmith. And get your dream i have used for 3 to 5 months it works better and in live market working 100% dont judge while while checking with backset, only for xauusd i have set files, if your willing to trad
FREE
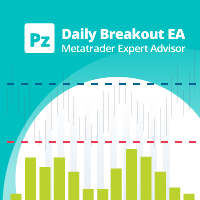
This EA trades daily breakouts placing bidirectional pending orders using the last day's trading range -or using market orders, as desired-, provided these price levels have not been yet tested. It offers many trading behaviors and flexible position management settings, plus a martingale and inverse martingale mode. [ Installation Guide | Update Guide | Troubleshooting | FAQ | All Products ] Easy to use and supervise Customizable break-even, SL, TP and trailing-stop Works for ECN/Non-ECN broker
FREE

El indicador técnico Trend Magic es una herramienta de análisis de tendencias que combina el Índice de Canal de Mercancía (CCI) y el Rango Verdadero Medio (ATR) para identificar la dirección de la tendencia del mercado. Aquí tienes un resumen de sus pros y contras, así como las mejores condiciones del mercado para su uso:
Pros: - Identificación clara de la tendencia: Cambia de color para indicar tendencias alcistas (azul) y bajistas (rojo), lo que facilita la visualización de la dirección del
FREE

After purchasing, you can request and receive any two of my products for free!
После покупки вы можете запросить и получить два любых моих продукта бесплатно! Expert Advisor for trading gold XAUUSD M1 timeframe, it is possible to carry out optimization for other major pairs with preliminary testing using minimal risks. The EA does not use dangerous trading methods - martingale or grid. Works only with pending orders (the ability to place opposite orders) and uses the minimum stop loss! The Ex
FREE

ПОСМОТРИТЕ НАШ НОВЫЙ СОВЕТНИК : : https://www.mql5.com/ru/market/product/95095?source=Unknown#description
Индикатор показывает время до закрытия свечи, а также время сервера на текущем графике. Очень прост в использовании, всего четыре настройки:
Lable Location- расположение таймера на графике; Display server time- показывать время сервера или нет; Sound alert when the candle is closed- использовать звуковой сигнал при закрытии свечи или нет; Colour -цвет цифр таймера. Другие полезные бесп
FREE

Introducing Adolla Burst FX for EURUSD H1 chart Adolla Burst FX is a groundbreaking expert advisor designed for trading EURUSD H1 chart on the Meta Trader 5 platform, featuring a sophisticated amalgamation of 50 rigorously validated strategies. Developed over an impressive span of 17 years since 2008, Adolla Burst FX stands out for its precision in market despite not using normal TP or SL methods. Its completely indicator based with an advanced reversal function for effective chart navigation.
FREE

Daily pivot are relatively important in trading.
This indicator have options to select 5 commonly use pivot point calculations.
User input Choose Pivot Point Calculation (Method Classic, Method Camarilla, Method TomDeMark, Method Fibonacci or Method Woodies.) Choose Applied Timeframe for the calculation (M5, M15, H1, H4, D1, W1 etc) Can be attached to any timeframe Choose color of Pivot point Note:
For MT4, please refer here : https://www.mql5.com/en/market/product/22280
FREE

Necessary for traders: tools and indicators Waves automatically calculate indicators, channel trend trading Perfect trend-wave automatic calculation channel calculation , MT4 Perfect trend-wave automatic calculation channel calculation , MT5 Local Trading copying Easy And Fast Copy , MT4 Easy And Fast Copy , MT5 Local Trading copying For DEMO Easy And Fast Copy , MT4 DEMO Easy And Fast Copy , MT5 DEMO "Cooperative QQ:556024" "Cooperation wechat:556024" "Cooperative email:556024@qq.com" Strong
FREE

As médias coiote automatizam a leitura de analise de médias rápidas e lentas no saldo do volume e preço. Quando as médias estão em modo compra, a coloração do candle fica azul.
Quando as médias estão em modo venda, a coloração do candle fica magenta. Quando a coloração fica verde ou vermelho, temos a tomada das médias no volume mas não no preço, quando isso ocorre é um sinal de atenção.
A concepção do indicador é ser utilizado para operações em saída de consolidações na direção da tendencia d
FREE

Crash Warrior is an automated hands-free robot that uses a very efficient hedging strategy for Crash 1000 Index MT5, advance probabilistic analysis. Effective in the consolidating and trending markets, does not need force optimization, which is the main factor of its reliability and guarantee of stable profits in the future. Suitable for beginners and experienced traders.
Requirements Trading pair -----------> Crash 1000 Index (Only) Time Frame -----------> H1 Minimum Depo
FREE

The Spots Indicator can be used for Entering and Exiting your trades based on the common candlestick patterns such as: engulfing, hanging man, doji etc. It is designed to publish desktop and mobile notification every time a signal is triggered. However, it is worth noting that this indicator is recommended to be used with other indicator for confirming the entries. It is best to use it with the Investment Castle Trend Lines indicator and the Supply and Demand indicator .
FREE

The Visual Result Calculator Indicator is a powerful tool designed to enhance your trading experience on the MetaTrader platform. This intuitive and user-friendly indicator allows you to visualize potential profits or losses on a trading chart, helping you make better-informed decisions and manage your trades with precision. The Indicator displays a dynamic line on the trading chart, representing the potential profit or loss of a trade based on the start and end of the line. Simply click and
FREE
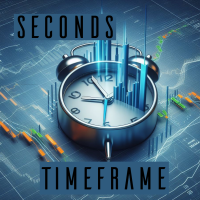
A 'Seconds Period' chart, offering enhanced precision for charting and analysis. Especially beneficial during volatile market conditions and intraday trading. This indicator addresses the limitations of MT5's predefined timeframes, allowing for finer granularity down to second intervals.
Since only one EA can run per chart, being an Indicator allows for the additional advantage of running an EA alongside the Seconds Timeframe Candles Indicator on the same chart. Compatible with any intraday t
FREE

The Stochastic Momentum Index (SMI), developed by William Blau and featured in the January 1993 edition of Technical Analysis of Stocks & Commodities magazine, introduces a unique perspective to trading analysis. Distinguished from the conventional Stochastic Oscillator, which evaluates the current close in relation to the recent x-period high/low range, the SMI assesses the close's position relative to the midpoint of this range. This innovation yields an oscillator with a range of +/- 100, re
FREE

Hi! This is a Bot I created for my own trading portfolio. But was thinking that to build the trust with any of you guys to use my other systems,I put this one up for free. The only thing I am asking for is a honest review. So if u like it and when u realise it it is actually a good working bot, u can look into the other bots that I have here on the market to add more strategies to your portfolio. I always make bots without Martingale or Grid systems because I mainly make these bots for my own po
FREE

Transform your way of analyzing the market with our innovative trend and support/resistance indicator!
By combining the robustness of pivot points, the sensitivity of price adjustment, and the reliability of moving averages, our indicator provides a comprehensive and intuitive view of price behavior. Whether to detect emerging trends, track significant price shifts, or map critical support and resistance zones, this tool is your reliable guide amidst market volatility (BMF WIN).
T ested f
FREE

Hi All ! I want to share with you my favorite indicator to identify strong trend bias. It helps me a lot with my entries and exits. You can use it on any market and any instrument. It works best on daily tiimeframe 1D but you can also use it on 1H and be carefull with lower timeframes This indicator uses MACD, RSI and Stoch. The idea is simple, when MACD crosses above a Signal line and RSI > 50 and Stoch > 50 we consider the trend is going UP on the opposite we consider its DOWN Feel free to us
FREE

The given MQL5 code is for an Expert Advisor (EA) that implements a trading strategy using the Alligator indicator and the Standard Deviation indicator. Here's a breakdown of the code:
The code defines various input parameters for the EA, including entry lots, stop loss, take profit, indicator parameters, and expert settings. The OnInit() function initializes the EA by setting some variables and validating the initialization. The OnTick() function is called on each tick of the price data and
FREE

Indicator IRush uses a modified version of a popular indicator RSI (Relative Strength Index) to look for entries on a daily chart or lower. The indicator has been set up and tested with the major symbols: AUDUSD, EURUSD, GBPUSD, USDCAD, USDCHF, and USDJPY. An automated trading with this indicator is implemented in the expert advisor Intraday Rush . This expert advisor can open, trail and close its trades. Check it out, it may be exactly what you are looking for!
A Correct Reading of IRush
Th
FREE

The utility draws pivot levels based on a selection from day week month The previous candlestick of the selected timeframe is taken and the values for the levels are calculated using the following formulas:
Pivot = (high + close + low) / 3 R1 = ( 2 * Pivot) - low S1 = ( 2 * Pivot) - high R2 = Pivot + (R1 -S1) R3 = high + ( 2 * (Pivot - low)) S2 = Pivot - (R1 - S1) S3 = low - ( 2 * (high - Pivot));
The style and thickness for all lines are adjusted.
The colors for the R, Pivot and S line
FREE

Break Even Line by MMD
The Break Even line is a useful indicator for people using strategies that allow simultaneous trades in both directions, such as the MMD methodology. This indicator is useful when playing statistical models and averaging positions in accumulation and distribution zones. The indicator draws levels by summing positions in three groups: positions included in BUY, positions included in SELL and all positions included.
Functionality description:
Show BUY BELine - shows
FREE

If you like to use traditional Moving Averages (like SMAs and EMAs) to provide your trades for dynamic levels of Support and Resistance, you will love the Adaptive Moving Average (AMA). Created in 1995 by Perry Kaufman and presented to the world in his book " Smarter Trading : Improving Performance in Changing Markets ", the Adaptive Moving Average (also known as KAMA - Kaufman Adaptive Moving Average) has the goal to be the perfect companion for following a trend without noise, but s
FREE

The Trading Sessions indicator is a simple tool that helps to highlight a specific trading session. For example, it can be used to differentiate the European, American or Asian sessions.
Main features The indicator shows a user-defined trading session. Alert notifications for the start and end of the session. Custom session time. Works on every timeframe (M1, M5, M15, M30, H1, H4, D1, W1, MN). Customizable parameters (Colors, alerts...). It can be used for creating EA. Available for MT4 a
FREE

The selective pin bar is designed to identify reversals. To use the selective pin bar effectively, traders typically look for Strong Rejection: The tail of the pin bar should extend significantly beyond the surrounding price action. It indicates that there was a sharp rejection of higher or lower prices during the trading period. A strong rejection suggests that the market sentiment may be changing.
FREE

This tool is useful for indicating resistance and support levels It bases on zone in setting to identify top/bottom of candles and and draw rectangle according to those resistance/support level Beside user can edit the zone via dialog on specific timeframe and that value will be saved and loaded automatically. User can determine what strong resistance and support and make the order reasonably.
FREE

This is a non-parametric ZigZag providing 4 different methods of calculation. Upward edge continues on new bars while their `highs` are above highest `low` among previous bars, downward edge continues on next bars while their `lows` are below lowest `high` among previous; Gann swing: upward edge continues while `highs` and `lows` are higher than on the left adjacent bar, downward edge continues while `highs` and `lows` are lower than on the left adjacent bar. Inside bars (with lower `high` and
FREE
MetaTraderマーケットは、履歴データを使ったテストと最適化のための無料のデモ自動売買ロボットをダウンロードできる唯一のストアです。
アプリ概要と他のカスタマーからのレビューをご覧になり、ターミナルにダウンロードし、購入する前に自動売買ロボットをテストしてください。完全に無料でアプリをテストできるのはMetaTraderマーケットだけです。
取引の機会を逃しています。
- 無料取引アプリ
- 8千を超えるシグナルをコピー
- 金融ニュースで金融マーケットを探索
新規登録
ログイン