YouTubeにあるマーケットチュートリアルビデオをご覧ください
ロボットや指標を購入する
仮想ホスティングで
EAを実行
EAを実行
ロボットや指標を購入前にテストする
マーケットで収入を得る
販売のためにプロダクトをプレゼンテーションする方法
MetaTrader 4のためのエキスパートアドバイザーとインディケータ - 38

Introducing Austin Bat: Your Key to Profitable Forex Trading! Are you ready to soar to new heights in the forex market? Look no further than Austin Bat—an advanced automated trading system that combines cutting-edge technology with expert insights to maximize your trading potential.
At the heart of Austin Bat lies a powerful strategy based on the cross of fast and slow custom moving averages, meticulously crafted using Jurik's renowned expertise in forex analysis. Jurik moving averages are cel
KT Momentum Histogram provides traders with a visualization of the momentum of a particular asset, which helps determine the strength and potential direction of a market trend. The indicator calculates and operates based on momentum in trading.
What Exactly is a Momentum Histogram
Momentum is the rate of acceleration of an asset's price or volume. In other words, it measures the speed at which the price of an asset is moving in a particular direction over a specific period of time. Positive

The KT Buy Sell Volume is a powerful tool traders use to gauge the strength and weakness of price movements. In the whirlwind of the Forex market, traders aim to identify and ride the waves of a bullish or bearish trend that exudes strength and potential. However, recognizing these trends necessitates a method, metric, or indicator to quantify their strength. One crucial factor that traders examine for this purpose is volume. Volume refers to the number of shares or contracts traded in a securit

Microlab Exp is a trending analytical bot. An expert system based on geometric virtual pattern algorithms specially designed for time series.
For this version of the Expert Advisor to work, there is no need to download any indicators or additional products, the bot is an independent finished product.
Microlab Exp is a tool for trading in the foreign exchange market.
The minimum recommendation is $1000. While the recommended minimum deposit is between $1,000 and $10,000 for one currenc

VANGLUTIO USES THE TREND WAVE INDICATOR AND IT CAN IDENTIFY THE BEGINNING AND THE END OF A NEW WAVE TREND MOVEMENT.
AS AN OSCILLATOR, THE INDICATOR IDENTIFIES THE OVERBOUGHT AND OVERSOLD ZONES.
IT WORKS GREAT TO CATCH THE SHORT TERM PRICE REVERSALS AND USES A MARTINGALE STRATEGY TO CLOSE ALL TRADES IN PROFIT.
USE DEFAULT SETTINGS ON H1 OR HIGHER TIME FRAME ON ANY PAIR FOR MORE ACCURATE TRADES
WHY THIS EA :
Smart entries calculated by 5 great strategies The EA can be run on even a $200
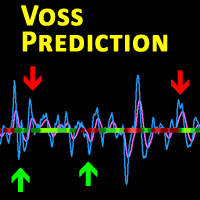
Description This is a modified version of the popular Voss Predictive Filter - A peek into the future by Dr. John Ehlers. It contains 2 lines - V-Line (blue) and F-Line (red), a trend indication and BUY/SELL signals.
Usage Buy Green dots indicate an up trend. Open a BUY position if the V-Line crosses the F-Line from below and an up trend is signaled (green dots) Close BUY position if V-Lines falls beneath F-Line again Sell Red dots indicate a down trend Open a sell position if V-Line fall

Attraverso l'indicatore Savius Zone potrai finalmente: Definire delle zone oggettive da attenzionare Ridurre la discrezionalità Filtrare i tuoi pattern operativi Avvalerti di un metodo comprovato Qui di seguito alcune funzioni dell'indicatore Savius Zone: Zone Buy & Sell L’indicatore fornisce delle zone buy e sell ogni giorno dopo l’apertura del mercato cash sui seguenti mercati: DAX, S&P500, Nasdaq, Russel2000, Dow Jones
Occasioni giornaliere Savius Zone fornisce occasioni di trading tutti i

DISCLAIMER : THIS EXPERT ADVISOR IS BUILT DEPEND ON NEW AND ADVANCE PRICEACTION. DONT BACK TEST IT IN THE TIME PERIOD BEFORE 2021 . Introducing our MT4 EA:
Designed with advanced algorithms and utilizing deep learning technology, our Expert Advisor (EA) is crafted to assist you in the intricate world of forex trading. The system analyzes market behaviors and conducts transactions based on specific criteria, empowering you to engage with market trends more effectively. With the backing

The EA Fractals Alligator strategy is a trading strategy popularized by Bill Williams, a famous trader and author of the book "Trading Chaos." It is a part of his broader trading system called the "Chaos Theory" and is based on the use of three moving averages, which he refers to as the "Alligator." The Alligator consists of the following three moving averages: Alligator's Jaw (Blue Line): This is a 13-period Smoothed Moving Average (SMA) moved 8 bars into the future. Alligator's Teeth (Red Line

The "REVERSAL" indicator is a pointer indicator without redrawing and delay. The "REVERSAL" indicator shows the best trend entry points on the chart. It is better to use it in tandem with other trend indicators as a filter. The indicator shows good results on all timeframes. The signal is generated after the candle closes and appears as blue and red arrows. If you reduce the amplitude, then you can trade in the style of scalping

VANDORA FX USES THE TREND WAVE INDICATOR AND IT CAN IDENTIFY THE BEGINNING AND THE END OF A NEW WAVE TREND MOVEMENT.
AS AN OSCILLATOR, THE INDICATOR IDENTIFIES THE OVERBOUGHT AND OVERSOLD ZONES.
IT WORKS GREAT TO CATCH THE SHORT TERM PRICE REVERSALS AND USES A MARTINGALE STRATEGY TO CLOSE ALL TRADES IN PROFIT.
USE DEFAULT SETTINGS ON H1 OR HIGHER TIME FRAME ON ANY PAIR FOR MORE ACCURATE TRADES
WHY THIS EA :
Smart entries calculated by 5 great strategies The EA can be run on even a $20

Certainly, I can explain a trading strategy using the EA of Commodity Channel Index (CCI) indicator. The CCI is a popular technical analysis tool used by traders to identify potential trend reversals, overbought, or oversold conditions in a market. Here's a basic CCI indicator strategy: Strategy Overview: The CCI indicator oscillates around a zero line, providing signals based on its position relative to this line. This strategy involves using CCI to identify potential trend reversals and overbo

In the ever-evolving world of Forex trading, understanding the different trading sessions is paramount to making informed trading decisions. Each trading session brings its own unique characteristics, opportunities, and challenges, and recognizing these can greatly enhance your trading strategies. Whether you're a novice or a seasoned trader, the Forex market's three main trading sessions – Asian, London, and New York – are crucial milestones that dictate market behavior and potential trade set

GOLD /USD (XAU/USD) Travel 22 EA is a Result of 5 Years of (Experience, Testing and Developing). Also This EA Based on Special Coding Algorithm of Take Profit and Treating Trades. Combine of a Custom Indicators is used to Take Trades at Strong Points Only. Trading is With Trend and Only Safe Positions.
Currency pair : GOLD/USD (XAU/USD) H1 OR M1 Timeframe
If you want a few but guaranteed deals use H1 Timeframe.
If you want more deals during the day use M1 Timeframe.
If you see u

Certainly! An EA (Expert Advisor) EMA (Exponential Moving Average) Trend Following Crossover strategy is a popular algorithm used in trading to identify trends in financial markets, such as stocks, forex, or cryptocurrencies. This strategy uses two Exponential Moving Averages with different periods to generate buy and sell signals based on their crossovers. Here's how it works: Exponential Moving Averages (EMAs): An Exponential Moving Average gives more weight to recent price data, making it mor
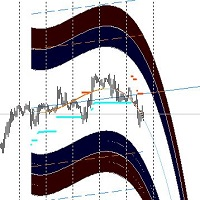
The forex market, like nature, moves in cycles — oscillating between peaks and troughs, bullish runs and bearish retreats. But what if you had a compass to chart these cycles and anticipate every turn? Austin Market Levels Indicator is crafted to be that compass, designed meticulously to decode market cycles and pinpoint profit opportunities.
---
Mastering Market Cycles
The secret to consistent forex trading success often lies in understanding the underlying patterns. Austin Market

The Trends Trg indicator determines the prevailing trend. They help to analyze the market at the selected time interval. Easy to set up and works on all pairs and all time frames. Trend indicators make it possible to classify the direction of price movement by determining its strength. Solving this problem helps investors enter the market on time and get a good return.
It is extremely important for any trader to correctly determine the direction and strength of the trend movement. Unfortunate

The Cyber Trend indicator analyzes the price action and if there is a temporary weakness in the trend, you can notice it from the indicator readings, as in the case of a pronounced change in trend direction. Entering the market is not difficult, but staying in it is much more difficult. Keeping up with the trend will become much easier with the Cyber Trend indicator! This indicator allows you to analyze historical data and, based on them, display instructions to the trader for further actions.

This "EA EMA High & Low Price" refers to the concept of using Exponential Moving Averages (EMA) in the context of tracking the highest (high) and lowest (low) prices of a financial instrument, such as a stock, currency pair, or commodity. The Exponential Moving Average is a widely used technical analysis tool that helps traders and analysts identify trends and potential reversals in price movements. In this context, the "EMA High & Low Price" approach involves calculating the Exponential Moving

This indicator will give you entries as result of scalping strategy that will be applied on 14 symbols in same time and you are able to be notified with this entries
Note : This indicator for scalping on 5 minutes timeframe only .
How to use it :
1-Open chart and adjust settings (edit symbols names as your platform names , activate the alert system if you need it . 2-Wait for any signal you have it from this scanner you will have it as alert and as notification and you will see it on bo
Introducing the ON Trade Melad Pattern Indicator: Enhance Your Trading Strategy with Breakout Patterns
Discover the power of the ON Trade Melad Pattern Indicator—an intuitive tool designed to elevate your trading decisions by detecting and highlighting breakout patterns on your charts. This indicator is your key to identifying crucial breakout points and potential trend shifts with simplicity and precision.
Key Features:
Breakout Pattern Detection: The ON Trade Melad Pattern Indicator foc

Unlock Hidden Insights with the Numerokh Indicator: Your Numerology-Based Support and Resistance Tool Introducing the Numerokh indicator, a revolutionary tool that brings the mystical world of numerology into the realm of trading. Imagine having the power to identify key support and resistance levels on your charts using the age-old wisdom of numerology. This indicator takes trading to a new dimension, offering you a unique way to analyze price movements and make informed trading decisions. Key

The SuperTrend AI indicator is a novel take on bridging the gap between the K-means clustering machine learning method & technical indicators. In this case, we apply K-Means clustering to the famous SuperTrend indicator. USAGE Users can interpret the SuperTrend AI trailing stop similarly to the regular SuperTrend indicator. Using higher minimum/maximum factors will return longer-term signals. (image 1) The displayed performance metrics displayed on each signal allow for a deeper interpretat

Introducing the MT4 Immortal Day Trader – Your Optimal Trading Solution Our Expert Advisor stands apart by adhering to a disciplined approach. This EA is NOT a grid, martingale strategies and unrealistic/Unreliable gains.
Experience a new level of trading precision and reliability with our Expert Advisor meticulously designed for MetaTrader 4. Key Features: Singular Daily Trade: Crafted to execute at most one trade per symbol each day, our Expert Advisor ensures a judicious trading frequency
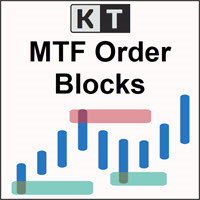
The KT MTF Order Blocks automatically plots the institutional order blocks by using a unique blend of price action with comprehensive multi-timeframe analysis. This advanced approach reveals the area of price reversal, originating from significant buy and sell orders strategically placed by major market players.
Features
Algorithmic Precision: A refined and distinctive order block algorithm meticulously crafted to precisely identify the most pivotal order blocks, often triggering price reve

Discover Prozones IntraWeek MT4: Elevate Your Trading Success with Precision Are you tired of sifting through market noise in search of profitable trades? Look no further than Prozones IntraWeek MT4 – your ultimate solution for consistent trading success in the fast-paced world of intraday trading. Crafted with advanced algorithms and years of market expertise, this indicator empowers traders of all levels to make informed decisions with confidence. Key Features: Pinpoint Precision in Trend Anal
Discover Prozones Intraday MT4: Elevate Your Trading Success with Precision Are you tired of sifting through market noise in search of profitable trades? Look no further than Prozones Intraday MT4 – your ultimate solution for consistent trading success in the fast-paced world of intraday trading. Crafted with advanced algorithms and years of market expertise, this indicator empowers traders of all levels to make informed decisions with confidence. Key Features: Pinpoint Precision in Trend Analys

The EA Candle Body SizeX2 strategy is a trading approach that focuses on the size of candle bodies in a price chart. Candlestick charts are a popular tool in technical analysis, used by traders to make decisions about buying or selling assets like stocks, forex, or cryptocurrencies. In the context of the "Candle Body SizeX2" strategy, here's how it generally works: Candlestick Analysis : Candlestick charts represent price movements over a specified period, typically showing open, close, high, an

The "EA Envelopes" indicator, often referred to as "Moving Average Envelopes," is a technical analysis tool used in financial markets to identify potential trends and trading opportunities. It consists of two lines plotted above and below a moving average of a security's price. Here's how the Envelopes indicator works: Calculation of Moving Average : A simple moving average (SMA) is calculated for the price of a financial instrument over a specified time period. This moving average represents th
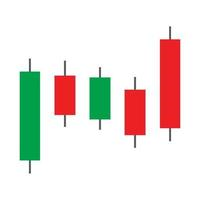
Trend Rider AIは私のEAの名前です。これはトレンドに基づいて動作し、設定された利益が達成されるまで、あらかじめ設定された価格範囲に従って取引に入り、その時点で全てのポジションを閉じます。
実際のシグナル: https://www.mql5.com/en/signals/2179495
推奨: ・初期預金:2000ドル ・通貨:USDCHF、EURUSD、GBPUSD、USDJPY、AUDCHF、...
設定のための主要なパラメータ: ・StepPrice = 10; 2つの注文の間の距離は10ピップスです。 ・ProfitThreshold = 1; BuyまたはSellの注文の総利益が1ドルに達すると、全てのBuyまたはSellの注文が閉じられます。 ・MagicNumber = 123; EAの取引のためのユニークな識別子です。 ・spreadEA = 10; スプレッドが10以上の場合、EAは注文を実行しません。 ・stopEA = false; trueに設定されている場合、全てのオープン注文が閉じられた時に新しい注文は行われません。 ・stopSel

MT5 Version Here : https://www.mql5.com/en/market/product/104493 Signal : https://www.mql5.com/en/signals/2058574
This EA is exclusive for those using the affiliate broker links or IB's. This Is the TREND today Get it so that you can manage to give youre clients a good profits while you are making money on commissions. This EA is very simple to use just attached the EA to chart and load the setfiles and its done.
Message me directly if you want your copies to be locked or put a account num

Golden Bull USES THE TREND WAVE INDICATOR AND IT CAN IDENTIFY THE BEGINNING AND THE END OF A NEW WAVE TREND MOVEMENT. AS AN OSCILLATOR, THE INDICATOR IDENTIFIES THE OVERBOUGHT AND OVERSOLD ZONES. IT WORKS GREAT TO CATCH THE SHORT TERM PRICE REVERSALS AND USES A MARTINGALE STRATEGY TO CLOSE ALL TRADES IN PROFIT. USE DEFAULT SETTINGS ON H1 OR HIGHER TIME FRAME ON ANY PAIR FOR MORE ACCURATE TRADES
WHY THIS EA : Smart entries calculated by 5 great strategies The EA can be run on even a $20000 acco

When running the backtest, it is important to consider the time difference between your local time and GMT. The backtest relies on the GMT time zone to determine trade openings and closings. Failing to account for the time difference may lead to inaccurate backtest results. If you're unable to locate your GMT Offset time zone, please inform us, and we'll gladly assist you.
Overview
Cyrus EA is an automated forex robot that utilizes a trend-following strategy for analyzing market movements a

An EA Engulfing Candle is a significant pattern in technical analysis often used in financial markets, especially in trading stocks, forex, and other assets. It occurs on candlestick charts and is a reliable indicator of potential trend reversals or continuation. An Engulfing Candle consists of two consecutive candlesticks, usually representing two trading periods (e.g., two days for daily charts). The second candlestick "engulfs" the first one, meaning its body completely covers the body of the

The EA Ichimoku Cloud consists of several components: Tenkan-sen (Conversion Line) : This is a short-term moving average that indicates the market's short-term trend. Kijun-sen (Base Line) : This is a longer-term moving average that gives insight into the market's medium-term trend. Senkou Span A (Leading Span A) : This forms one edge of the Ichimoku cloud and is calculated by averaging the Tenkan-sen and Kijun-sen. It helps identify potential support and resistance levels. Senkou Span B (Leadin

This EA Optimize for EURUSD H1 With Balance start 1,000 /0.1 Lot Strategy : 1.Used EMA 200 Confirm trend 2.Scan Price action with DOJI 3.Confrim position open order with Stochastic Oscillator EA include 3 money management Mode1 Fix Lot,Fix SL,TP Mode2 Lot Auto exponential ,Fix SL,Fix TP Mode3 Special MM Repeat Order with same logic with Lot martingale Remark : Have Function Closed All , Max order and Cutt loss User can select that you like money management system For my Suggestion is mode

The " Global Trend Pro Lines " indicator is one of the most important indicators designed to display trading volumes based on the sniper strategy. This indicator provides convenience for daily, medium-term, and long-term traders. The main advantages of the indicator are as follows: Suitable for the sniper strategy: The "Global Trend Pro Lines" indicator is suitable for the sniper strategy and allows traders to identify the best entry and exit points for trading. Displays volumes: The indicator

Deposit from $100.
The expert trades during a small market volatility, at the end of the American session, tracking price levels, and then opens positions
and monitors them until they close with a profit or a small loss. You can limit the number of open positions.
Does not use martingale strategies, averaging positions, waiting out a loss, etc.
All positions are opened with fixed StopLoss, the profit closes on the market itself.
It is possible to use a dynamic lot to increase the volu
Perhaps you have previously read in technical analysis books about such a concept as "market slope", or "trend slope". Metatrader has such a tool as "trend line by angle". But when working on auto-scaled charts, this tool becomes completely abstract, and as a consequence, useless. The idea of this new parameter, included in the AllAverages_Speed indicator, is to give such a concept as "trend slope" specific numerical values, as well as the further use of the new parameter in work.
Modific

Experience the Future of Forex Trading with TrendSurfer Accelerator.
TrendSurfer Accelerator represents a leap forward in automated trading systems, utilizing the renowned MetaTrader 4 indicator, Accelerator, to provide traders with unparalleled insights into market momentum.
The Accelerator indicator measures the rate of change of a currency pair's price movement, offering valuable data on market momentum and direction. This information empowers traders to make informed decisions based on r

A technical indicator that calculates its readings on trading volumes. In the form of a histogram, it shows the accumulation of the strength of the movement of the trading instrument. It has independent calculation systems for bullish and bearish directions. Works on any trading instruments and time frames. Can complement any trading system.
The indicator does not redraw its values, the signals appear on the current candle.
It is easy to use and does not load the chart, does not require additi

Introducing the "Magic Trades" for MetaTrader 4 – your ultimate tool for precision trading in dynamic markets. This innovative indicator revolutionizes the way you perceive market trends by harnessing the power of advanced analysis to detect subtle changes in character, paving the way for optimal trading opportunities.
The Magic Trades Indicator is designed to empower traders with insightful entry points and well-defined risk management levels. Through its sophisticated algorithm, this indica

GU Spot is a One Shot One Kill EA. A Scalping EA for GBPUSD . No Martingale, No Averaging, No Grid or other high-risk strategies. Working with up to the best 100 trading signals algorithm from various Trading Systems. The combination of Price Action, High Low, Trend, Range Levels, Pullback / Retracement and Reversal. This is Fully Automatic Trading Robot . High Accuracy Entry Signals and protected by a proper Money Management. A tight Stop Loss with SL:TP ratio 1:3 by default, Trailing an
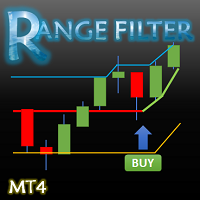
This indicator converted from 5 min Buy and Sell Range Filter - guikroth version on TradingView Popularity of the Range Filter
The Range Filter is a very popular and effective indicator in its own right, with adjustments to the few simple settings it is possible to use the Range Filter for helping filter price movement, whether helping to determine trend direction or ranges, to timing breakout or even reversal entries. Its practical versatility makes it ideal for integrating it's signals into

Introducing TrendSurfer OsMa: Elevating Your Forex Trading Experience.
TrendSurfer OsMa is a cutting-edge automated trading system meticulously crafted to harness the power of the MetaTrader 4 indicator, Moving Average of Oscillator (OsMa), revolutionizing your approach to forex trading.
The Moving Average of Oscillator (OsMa) is a derivative of the MACD (Moving Average Convergence Divergence) indicator. It represents the difference between the MACD line and its signal line. The OsMa provid

Drop Trend is a trend indicator for the MetaTrader 4 trading platform. This indicator allows you to find the most probable trend reversal points. You will not find this indicator anywhere else. A simple but effective system for determining the forex trend. From the screenshots you can see for yourself the accuracy of this tool. Works on all currency pairs, stocks, raw materials, cryptocurrencies.
Are you tired of the constant ups and downs? Do not become a victim of unstable market movements,

This is a very nice EA which is running on Trend basis on EMA settings, very good returns, with SL and TP, if trade goes in loss the next trade according to loss can adjust this EA, I am uploading the back test of that EA as well, you can see that as well. You will never find that trending base EA in that price from anywhere, I am using this EA since almost 01 year and on my profiles you can see some live accounts as well.

The Moving Average Convergence Divergence (MACD) is a popular technical analysis tool used by traders and analysts to identify trends and potential buy or sell signals in a financial instrument, such as a stock, currency pair, or commodity. It's essentially a combination of two moving averages, often referred to as the "fast" and "slow" moving averages. Here's how the MACD is calculated: Fast Moving Average (12-period EMA): This is a 12-period Exponential Moving Average (EMA) of the asset's pric

for xau/usd marthingale expert adviser. This EA can also be used by people with low funds. because this EA doesn't take positions when there is a surge or when there is a trend.(it is our logic) and when your position take unrealized profit,it begins "trailing stop" and inclease profit. you can use othersymbols( if you want,please try back test with TDS data) thank you

//// Forex Bulls GBP CAD ////
An expert based on ( GBP , CAD )
Time frame = 15
Live Signal 1 = signa l Live Signal 2 = it is a fully automated “pullback” trading system, which is especially effective in trading on popular “pullback” currency pair : GBPCAD The system uses the ma


Binary Lines is a technical analysis indicator for currencies, commodities, cryptocurrencies, stocks, indices and any financial instruments. Can be used for binary options or Forex scalping. Shows entry and exit points at fixed intervals and provides traders the necessary information about the results of possible transactions. Entry points are formed at the very beginning of the candle, in the direction of the MA line, duration
trades in bars can be adjusted manually and adjusted to any financi

---- Brand New Strategy. Three Month Rent is $30. ONE YEAR RENT ONLY $50. FREE EURUSD VERSION AVAILABLE UNDER << Forecast System Gift >>. NO NEED FOR BACKTEST! Link to the FREE version --> https://www.mql5.com/en/market/product/110085?source=Site --- This is a simple strategy based on BREAKOUT and FIBONACCI levels. After a breakout, either, the market: - continues the move directly to the 161, 261 and 423 levels, or - retraces to the 50% level (also called a correction) and thereafter continues

Gumper Options USES THE TREND WAVE INDICATOR AND IT CAN IDENTIFY THE BEGINNING AND THE END OF A NEW WAVE TREND MOVEMENT.
AS AN OSCILLATOR, THE INDICATOR IDENTIFIES THE OVERBOUGHT AND OVERSOLD ZONES.
IT WORKS GREAT TO CATCH THE SHORT TERM PRICE REVERSALS AND USES A MARTINGALE STRATEGY TO CLOSE ALL TRADES IN PROFIT.
USE DEFAULT SETTINGS ON H1 OR HIGHER TIME FRAME ON ANY PAIR FOR MORE ACCURATE TRADES
WHY THIS EA :
Smart entries calculated by 5 great strategies The EA can be run on even a

**TrendLine ProX - The Ultimate Non-Repaint Indicator for MT4 Trading**
**Product Introduction:** We are delighted to introduce TrendLine ProX - an optimized and reliable trading tool for the MT4 platform. With its accurate trend detection and non-repainting feature, TrendLine ProX will be your trustworthy companion to support intelligent trading decisions.
**The Power of TrendLine ProX:** TrendLine ProX is more than just a trading tool; it is a harmonious blend of technology and market ana

Rapid Trend is a technical analysis indicator that determines the direction and strength of a trend, and also signals a trend change. Allows you to determine the current trend. With the help of its algorithm, you can quickly understand what kind of trend is currently developing in the market. Rapid Trend can be used along with oscillators as filters. Setting up the Rapid Trend forex indicator allows you to receive more accurate signals for opening positions. Uses only one parameter for settings.

Questo EA è ha lo scopo di automatizzare lo spostamento dello stop loss a Breakeven e la presa di 2 parziali al raggiungimento di un certo numero di pips di guadagno. Si tratta solo di un assistente al proprio trading manuale, non apre ordini da solo. Dovrai solo preoccuparti di inserire gli ordini con lo stop loss. L'EA si occuperà di gestire l'ordine una volta attivato. Puoi anche non impostare il TP, come faccio io, e una volta presi i 2 parziali cercare di piramidare più posizioni nella dire

All Cleaned Up Trading - integrated with market volatility scalping trading. Settings for all 28 Currency Pairs and XAUUSD (for 5 Digits pairs) are available in the comments section for immediate use. Thus, there is literally no Symbol that cannot be traded. Download and start your live trading NOW!
The Universal HedgeR Expert - just like The Fibo Reversal Expert is the Expert Advisor built based on the trading strategy of "The Fibo Reversals Indicator". Here too, the E.A. is used with two o

Perfect for one minutes high trading and scalping. This indicator is very effective for trading on one minutes, in the hour. A combination of moving averages and STOCHASTICS calculation to produce a very convincing signal every hour. Blue colour signals a buy opportunity. Follow the X signs for possible buy points. The Blue average line serves as possible trend direction and support. Red colour signals a sell opportunity. Follow the X signs for possible sell points. The Red average line serves a

Maximo Momentum USES THE TREND WAVE INDICATOR AND IT CAN IDENTIFY THE BEGINNING AND THE END OF A NEW WAVE TREND MOVEMENT. AS AN OSCILLATOR, THE INDICATOR IDENTIFIES THE OVERBOUGHT AND OVERSOLD ZONES. IT WORKS GREAT TO CATCH THE SHORT TERM PRICE REVERSALS AND USES A MARTINGALE STRATEGY TO CLOSE ALL TRADES IN PROFIT. USE DEFAULT SETTINGS ON H1 OR HIGHER TIME FRAME ON ANY PAIR FOR MORE ACCURATE TRADES WHY THIS EA : Smart entries calculated by 6 great strategies The EA can be run on even a $20000 a
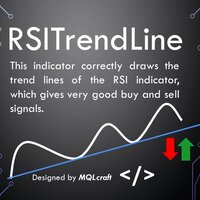
RSI Trend Lines Indicator - Identify Optimal Buying and Selling Opportunities Introduction :
The RSI Trend Lines Indicator is a powerful tool designed to assist traders in identifying optimal buying and selling opportunities based on the Relative Strength Index (RSI) oscillator. This advanced indicator draws trend lines on the RSI chart using multiple points, providing valuable insights into potential market trends and reversals. By leveraging the RSI Trend Lines Indicator, traders can enhance

Note: After installation, please go to Tools>Options>Expert Advisors and add https://porsaj.com to 'Allow WebRequest for listed URL'. Still Problem?! Please check Internet connection!
Unveiling the Porsaj Scalper: Your Cutting-Edge MetaTrader 4 Utility for Precision Scalping Are you ready to take your forex trading to the next level? Look no further than the revolutionary Porsaj Scalper – a MetaTrader 4 utility designed to empower scalpers with the tools they need to thrive in the fast-pa

for xau/usd marthingale expert adviser.
・The initial lot is carefully selected for both buying and selling. ・When there is a large price movement, or there is a trend, we do not have a new position. ・Nanping also does not have a new positions when there is a trend or there is a sudden change (when it rises or falls). ・Separately setting for buying and selling can use,(for example Nanpin ratio, Nanpin Interval, Nanpin Interval_add,and profit take method.) «two type of profit take method» 1)

Maximo Bull Skunk USES THE TREND WAVE INDICATOR AND IT CAN IDENTIFY THE BEGINNING AND THE END OF A NEW WAVE TREND MOVEMENT. AS AN OSCILLATOR, THE INDICATOR IDENTIFIES THE OVERBOUGHT AND OVERSOLD ZONES. IT WORKS GREAT TO CATCH THE SHORT TERM PRICE REVERSALS AND USES A MARTINGALE STRATEGY TO CLOSE ALL TRADES IN PROFIT. USE DEFAULT SETTINGS ON H1 OR HIGHER TIME FRAME ON ANY PAIR FOR MORE ACCURATE TRADES WHY THIS EA : Smart entries calculated by 6 great strategies The EA can be run on even a $20000

for xau/usd marthingale expert adviser. This EA can also be used by people with low funds. because this EA doesn't take positions when there is a surge or when there is a trend.(it is our logic) As a feature of this EA, "nanpin" does not exceed (below) the set price.(support_nanpin_value and ressistance nanpin value) you can also use othersymbols( if you want,please try back test with TDS data) thank you
・The initial lot is carefully selected for both buying and selling. ・When there is a la

Gold Whiskers USES THE TREND WAVE INDICATOR AND IT CAN IDENTIFY THE BEGINNING AND THE END OF A NEW WAVE TREND MOVEMENT. AS AN OSCILLATOR, THE INDICATOR IDENTIFIES THE OVERBOUGHT AND OVERSOLD ZONES. IT WORKS GREAT TO CATCH THE SHORT TERM PRICE REVERSALS AND USES A MARTINGALE STRATEGY TO CLOSE ALL TRADES IN PROFIT. USE DEFAULT SETTINGS ON H1 OR HIGHER TIME FRAME ON ANY PAIR FOR MORE ACCURATE TRADES WHY THIS EA : Smart entries calculated by 6 great strategies The EA can be run on even a $20000 acc

ROYAL DUTCH SKUNK USES THE TREND WAVE INDICATOR AND IT CAN IDENTIFY THE BEGINNING AND THE END OF A NEW WAVE TREND MOVEMENT. AS AN OSCILLATOR, THE INDICATOR IDENTIFIES THE OVERBOUGHT AND OVERSOLD ZONES. IT WORKS GREAT TO CATCH THE SHORT TERM PRICE REVERSALS AND USES A MARTINGALE STRATEGY TO CLOSE ALL TRADES IN PROFIT. USE DEFAULT SETTINGS ON H1 OR HIGHER TIME FRAME ON ANY PAIR FOR MORE ACCURATE TRADES WHY THIS EA : Smart entries calculated by 6 great strategies The EA can be run on even a $20000

This is a dashboard indicator that displays the Average Level of each selected currency pairs that filters and gives us a signal for overbought (>=90%) or if price at extreme peak above 90, and/or oversold (<=10%) or if price at extreme peak below 10.
The calculation is using Relative Strength Index default periods (2 & 9) applied to three different higher time frames H4,D1,&W1.
This won't change or altered even if you change symbol or switch to lower time frames or even in monthly and y

Goldmine Ventures USES THE TREND WAVE INDICATOR AND IT CAN IDENTIFY THE BEGINNING AND THE END OF A NEW WAVE TREND MOVEMENT.
AS AN OSCILLATOR, THE INDICATOR IDENTIFIES THE OVERBOUGHT AND OVERSOLD ZONES.
IT WORKS GREAT TO CATCH THE SHORT TERM PRICE REVERSALS AND USES A MARTINGALE STRATEGY TO CLOSE ALL TRADES IN PROFIT.
USE DEFAULT SETTINGS ON M15 OR HIGHER TIME FRAME ON ANY PAIR FOR MORE ACCURATE TRADES
WHY THIS EA :
Smart entries calculated by 5 great strategies The EA can be run on ev

Gold Standard USES THE TREND WAVE INDICATOR AND IT CAN IDENTIFY THE BEGINNING AND THE END OF A NEW WAVE TREND MOVEMENT.
AS AN OSCILLATOR, THE INDICATOR IDENTIFIES THE OVERBOUGHT AND OVERSOLD ZONES.
IT WORKS GREAT TO CATCH THE SHORT TERM PRICE REVERSALS AND USES A MARTINGALE STRATEGY TO CLOSE ALL TRADES IN PROFIT.
USE DEFAULT SETTINGS ON H1 OR HIGHER TIME FRAME ON ANY PAIR FOR MORE ACCURATE TRADES
WHY THIS EA :
Smart entries calculated by 5 great strategies The EA can be run on even a
MetaTraderプラットフォームのためのアプリのストアであるMetaTraderアプリストアで自動売買ロボットを購入する方法をご覧ください。
MQL5.community支払いシステムでは、PayPalや銀行カードおよび人気の支払いシステムを通してトランザクションをすることができます。ご満足いただけるように購入前に自動売買ロボットをテストすることを強くお勧めします。
取引の機会を逃しています。
- 無料取引アプリ
- 8千を超えるシグナルをコピー
- 金融ニュースで金融マーケットを探索
新規登録
ログイン