YouTubeにあるマーケットチュートリアルビデオをご覧ください
ロボットや指標を購入する
仮想ホスティングで
EAを実行
EAを実行
ロボットや指標を購入前にテストする
マーケットで収入を得る
販売のためにプロダクトをプレゼンテーションする方法
MetaTrader 4のためのエキスパートアドバイザーとインディケータ - 276

The indicator is designed to measure the price volatility. This allows determining the moments for opening or closing trade positions more accurately. High intensity of the market indicates the instability of its movement, but allows for better results. And, conversely, low intensity of the market indicates the stability of its movement.
Parameters Bars to process - the number of bars to measure the price movements. A low value of this parameter allows determining the moments of rapid price mo

Super signal series magic arrows is an indicator that generates trade arrows. It generates trade arrows with its own algorithm. These arrows give buying and selling signals. The indicator certainly does not repaint. Can be used in all pairs. Sends a signal to the user with the alert feature.
Trade rules Enter the signal when the buy signal arrives. In order to exit from the transaction, an opposite signal must be received. It is absolutely necessary to close the operation when an opposite sign
This is a grid Expert Advisor with a position averaging and ability to enable/disable the martingale. RSI is used for placing the first order. Settings and indicator levels are set by users. Note: All distances in the EA are set in ratios from the ATR volatility indicator. A BuyStop order is placed when a symbol is oversold, while a SellStop one is applied if the price is overbought at the Distance_pending distance from the current price. If the price moves from a pending order, the order follow

The Bullet Expert trades automatically. It belongs to level breakout scalping strategies. It is designed for high-speed trading on the financial instrument it is attached to. In order to trade different financial instruments simultaneously the EA must be attached to the chart of each relevant financial instrument. The Expert Advisor trades using pending orders. Different combinations of input parameters, timeframes and financial instruments provide the trader with wide tactical trading opportuni

This is an efficient and yet simple Expert Advisor not using indicators, which can determine the following: the future direction of movement of quotes, their strength, trade levels for the current and next trading day. The Expert Advisor runs on the "here and now" principle, which means that the EA tracks a lot of parameters of the price behavior in real time. Based on this Expert Advisor, a certain trading strategy was developed and tested in real time. The ELEMENTARY strategy consists of three

This utility allow you to switch your chart symbol rapidly by simply clicking on any two of the currencies that made up the currency pair. The supported currencies are USD, EUR, GBP, JPY, AUD, NZD, CHF and CAD. There are two rows of buttons at the panel. To switch to a new chart symbol, all you need to do is select a currency from each row. It is not necessary to click the currencies in a correct sequence because it is designed to auto match your choice of currencies to the available symbols. Fo

The Stubborn Scalper indicator can run in any currency pair and at any time interval. The larger the time interval, the less false signals are obtained. Always choose a larger time interval for healthy signals.
Trade rules Turn on the Buy action when the Stubborn Scalper indicator turns blue and the trend up warning is displayed. The Stop Loss is set to the level at the end of the green circle. Turn off the operation when the Stubborn Scalper indicator is green or red. Turn on the Sell action

The Name Green Wall : Arrows hits a lot of TP, by changing the idea of non using SL as something bad, but instead use Small TP and a lot of free Margin and Patience. Use micro TP and a lot of Free Margin with this indicator on Forex. It also can be used with Binary Options. This strategy is intended to be traded Manually. This Indicator runs on Open Bar, arrows will delete when price are against it. The only Indicator Parameter is Alerts true/false, all the rest is included inside the code. Arro

Yihaa Shoot applies a unique range calculation and time management to enter a trade. It has a unique money management system which calculates the risk before it takes a trade. Suggested pairs: GBPJPY and USDJPY Timeframe: H1 Suggested balance: $500 ($1000 is recomended) Risk in dollar suggested: 4 (0.5% from $1000)
Parameters Signal Settings Margin Top (pip) >> margin top from range Margin Bottom (pip) >> margin bottom from range TP Buy deduct (pip) >> reduce the TP spot TP Sell deduct (pip)

The Expert Advisor is based purely on price action analysis and applies three combined adaptive trading algorithms using pending orders. The robot follows the market price removing "noise" and selecting the most suitable trading strategy. The EA features dynamic trailing stop and brerakeven. The robot works with five-digit quotes. Economic news are used. Monitoring : https://www.mql5.com/en/signals/author/profi_mql . Optimized for EURUSD, AUDUSD, GBPUSD, USDJPY, NZDUSD, EURAUD / H1. For the EA o

MACD Temp is a system of two oscillators, which allows to track the price changes of the Fast and Slow periods in case of their convergence/divergence. The bar border is colored in accordance with the MACD trend, while the color of the histogram changes when the values of the Momentum indicators cross the level of 100, for respective periods: Fast Moving Average (Fast Momentum), Slow Moving Average (Slow Momentum), selectively or for both values (the mode is to be chosen in the indicator propert
EA is primarily a Hedging and Multiples Strategy. It support to seize every opportunity in any direction as MILCH COW MIX but with multiple profit results without increasing the risk. Milch Cow Mix EA starts to open Hedge at first level only But EA opens Hedge at every level Not just opens the deals, but chooses the right time to close the open positions to begin trading again. We recommend the use of an expert with a pair of high volatility for the currency, such as GBPAUD, AUDCAD Experts inter

Vantage is a one-click semi-automated tool which works with the user interface. The EA's base strategy is grid trading. The user can start first trade from chart buttons and the EA will do rest of the work. User can open grid to loss side, profit side or both sides same time, or can do a simple trade without the grid. Use low risk against balance and apply EA on VPS. With this, the EA can work properly without any interruption. To understand all functions watch the video below.
Input parameter
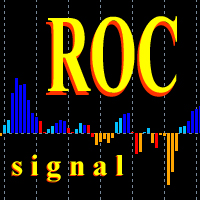
This oscillator generates trade signals based on the analysis of two smoothed Price Rate-of-Change graphs, which are calculated using different periods. One of the graphs is used as the main one, the second as the signal line. The difference between them is displayed as an oscillator in the form of a histogram, divided into four phases: the beginning of the rise, the completion of the rise, the beginning of the fall and the end of the fall. When the color is bright blue, the ROC indicator intens

The axiom of the Forex market is that any trend will be broken. The Expert Advisor determines trend direction (the pink line), and calculates levels for opening opposite orders depending on the settings. The value of Away from the trend line for Deal will be different for each pair and timeframe, depending on the volatility of the trading instrument. Next orders can be opened with an increased lot (a static lot is used by default). See the screenshots to understand the idea of the Expert Advisor

The Strategy is based on the Bollinger Bands and MACD indicators, and the location of the last closed bar. Features The template features an adaptive forecast algorithm based on history data of price action; It has multiple filters for opening new orders; Compatible with any trading strategy, both manual or automatic (Expert Advisors); It has the maximum possible and compatible functionality: adaptive order grid, locking, averaging, rebuying.
Expert Advisor Installation The quotes history must

The Expert Advisor finds strong trend movements of a currency pair over the specified number of bars. It also finds correction to this trend (for the same period). When the trend is strong enough, and the correction becomes equal to the values specified in the EA parameters, the Expert Advisor opens the a trade in the trend direction. The advantage of this is that the EA will not buy at the trend maximum or sell at its minimum - trhe EA only trades after correction. However, you can set differen

Alan Hull's moving average, more sensitive to the current price activity than the normal MA. Reacts to the trend changes faster, displays the price movement more clearly. No Repaint Version on separate Windows shows the trend 1 and -1 . Improvement of the original version of the indicator by WizardSerg <wizardserg@mail.ru>. Suitable for all timeframes.
Parameters Period - period, recommended values are from 9 to 64. The greater the period, the smoother the indicator. Method - method, suitable

This product (later referred to as "script") is intended for qualitative analysis of raw data and statistics when choosing trading signals for subscription. The script also performs calculations regarding compatibility of quotes data between signal provider's trading server and subscriber's trading server. Possible discrepancies in values of quotes are determined through retroactive analysis of transactions carried out by the signal provider. If said compatibility percentage is less than 90%, th

This indicator uses Donchian channel and ATR indicators. This trend tracking system uses historical data to buy and sell. This indicator does not repaint. The point at which the signal is given does not change. You can use it in all graphics. You can use it in all pairs. This indicator shows the input and output signals as arrows and alert. Open long deals on blue arrows Open short deals on red arrows When sl_tp is set to true, the indicator will send you the close long and close short warnings.

Did you ever encounter a problem that your terminal failed to reestablish a connection and caused your EA to stop working? How much money did you lose because you were not aware of the connection error? Worry no more, I am here to present you a solution for your nightmare. This utility indicator sends a real time push notification or email when your terminal encounters a connection failure. You will be notified immediately even if your terminal is yet to establish a success connection to your br

I recommend you to read the product's blog (manual) from start to end so that it is clear from the beginning what the indicator offers. This multi time frame and multi symbol indicator scans for engulfing and tweezer formations. The indicator can also be used in single chart mode. Combined with your own rules and techniques, this indicator will allow you to create (or enhance) your own powerful system. Features Can monitor all symbols visible in your Market Watch window at the same time. Ap

AIS Advanced Grade Feasibility インジケーターは、価格が将来到達する可能性のあるレベルを予測するように設計されています。彼の仕事は、最後の 3 つのバーを分析し、それに基づいて予測を作成することです。この指標は、任意の時間枠および任意の通貨ペアで使用できます。設定の助けを借りて、予測の望ましい品質を達成できます。
予測の深さ - 望ましい予測の深さをバーで設定します。このパラメーターは、18 ~ 31 の範囲で選択することをお勧めします。 これらの制限を超えることができます。ただし、この場合、予測レベルの「固着」(18 未満の値の場合)、またはレベルの過度の幅 (31 より大きい値の場合) のいずれかが可能です。
信頼水準 1、信頼水準 2、および信頼水準 3 - 信頼水準を予測します。 1~99の範囲で設定可能。信頼度 1 は信頼度 2 よりも大きく、信頼度 3 は最も小さくする必要があります。 これらの各レベルは、予測の深さパラメーターによって決定されるバーの数について、価格がこの値に到達する確率のパーセンテージを示します。
Color

Slide Trend is a simple indicator that shows a trend and allows for easy and fast navigation between charts. It was designed for quick analysis and aids you to scroll very fast through all the charts in the inputs list. The minimalist graphic allows receiving data on trend on D1, W1 and MN timeframes. The Trend feature (in the inputs) allows you to filter and view only the most powerful symbols. In this case, the circles are all of the same color. This indicator is a utility that speeds up navig
Algo Zones is an indicator that simplify the visual approach and it gives you very quickly the information of your favorite indicator. The indicator colors areas based on indicator and levels chosen in input. This graphic display improves significantly your market attitude and it prevents you from making silly mistakes. The zones are colored in base of levels of this indicators: ATR, Momentum, RSI, MACD and Stochastic.
Input values Number_of_Bars (default 100) numbers of bars where show colour

If you like a grid system, the expert may be useful for you. It is designed to optimal grid with many function inside. The expert can fully auto or custom setting with your idea. The market will change so the expert should be flexible and adjusting follow the market.. Some more detail as below: Pairs: All Timeframe: M15, H1 Deposit for 01 pair: 100$ with the initial lot of 0.01 lot Default setting is suitable for EUR/USD
Parameters Take profit for closing orders ($): when the profit archive to

The strategy is based on a position of the previous bar, including its wicks, relative to the Bollinger Bands indicator. RSI should be pointing in the direction of a signal. The working timeframe is M30. Features The template features an adaptive forecast algorithm based on history data of price action; It has multiple filters for opening new orders; Compatible with any trading strategy, both manual or automatic (Expert Advisors); It has the maximum possible and compatible functionality: adaptiv

You can use the signals to Forex. The indicator works on all pairs. You can use it for scalping and intraday trading but also for the long-term trading. Periods: M1 M5 M15 M30 H1 H4 D1 This indicator is not repainting signs. It gives immediate signal when a new candle opens. Easy to use. All pairs.
Indicator Settings Alert Signal - Configuration of Alerts. Show Line Ianx - Show Ianx line. Show Arrow Signal Ianx Buy - Show Buy signal arrow. Color Arrow Signal Ianx Buy - Buy Arrow Color. Wingdin
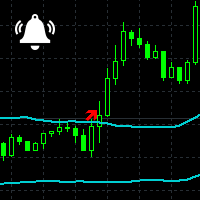
Channel Notifier is a universal indicator, which can plot different types of channels with the ability to send notifications about the channel breakouts. A breakout can be registered based on different rules, such as the price directly reaching a new level, a bar closing beyond the channel, the whole bar being outside the channel, etc. The notifications can be configured as alerts in the MetaTrader terminal, or as push notifications to mobile devices.
Input parameters
Indicator - type of the
MyBreakeven Expert Advisor automatically moves a position to breakeven. The EA works both with all open positions and with a certain order. The robot allows moving a position to breakeven in several modes: Points - move a position to breakeven when reaching a certain profit in points. To work in this mode, fill in the SizePoints field in the inputs; Summ - move a position to breakeven when reaching a certain profit in deposit currency. To work in this mode, fill in the SizeSumm field in the inpu

Do you want to see the candlestick formation on a higher timeframe, but do not want to be detached from the lower chart you trade on? Then this indicator is for you! It draws candles of any timeframe as histogram bars and accurately replicates the proportions between the candle body and wicks. At the same time, the time scale is not interrupted. For example, on a minute chart, each M5 candle will take up 5 bars. Each candle formed before the start of the indicator will be replicated five times w
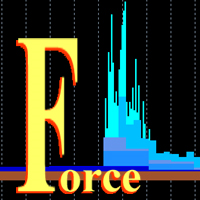
This is a multitimeframe version of the popular Force index oscillator. Interpretation of the conventional version of the indicator is relatively complex, therefore, its multitimeframe representation is especially relevant. Monitoring different periods becomes comfortable and the indicator turns out to be more informative. It provides the ability to show or hide any graphs, from minute to daily inclusive. It is also possible to select the oscillator plotting style: line, section or histogram. Yo
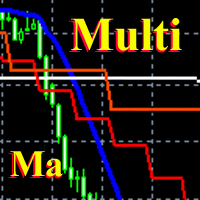
This is a fully multi timeframe version of the Moving average standard indicator, which works for any combination of timeframes. The indicator allows quickly and effortlessly viewing the charts from different timeframes at the same time. You can create and set of intervals and freely switch to a higher or lower one. At the same time, the selected charts will always be displayed in a correct time scale. The interaction of the short-term and long-term trends will be clearly visible, and it will al
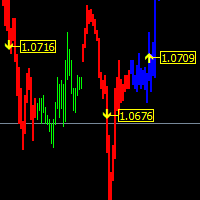
The main function helps you trade in the direction of the trend D1. All this make it Become One trend trading system easy to use for beginners, advanced and professional traders. This indicator will give you a new perspective and it suggests you a decision on the market. The indicator is equipped with a pop-up and audio alert. This indicator creates a very important that optimizes the entry points. We are very happy to have created this indicator and we hope it will be useful to all.
Features
ChartTrader is a professional trading tool that every trader needs in their toolbox. It has been developed to work with the MT4 Platform. ChartTrader offers a number of options to make placing orders in the Forex market quick and easy. The GUI sits on the chart window so there is no need to navigate to separate windows when placing orders. The program allows you to set pending and instant orders. It has a built in risk management system, so every trade can risk a percentage or a fixed amount in

123パターン は、最も人気のある強力で柔軟なチャートパターンの1つです。このパターンは、3つの価格ポイントで構成されています。ボトム、ピークまたはバレー、および38.2%〜71.8%のフィボナッチリトレースメントです。パターンは、価格が最後のピークまたは谷、インディケーターが矢印をプロットし、アラートを上昇させ、取引を行うことができる瞬間を超えたときに有効と見なされます。 [ インストールガイド | 更新ガイド | トラブルシューティング | よくある質問 | すべての製品 ]
クリアな取引シグナル カスタマイズ可能な色とサイズ パフォーマンス統計を実装します カスタマイズ可能なフィボナッチリトレースメントレベル 適切なストップロスおよび利益レベルを表示します
インジケーターを使用して、継続パターンまたは反転パターンを見つけることができます 再描画および非再描画ではありません 電子メール/音声/視覚アラートを実装します 123パターン は、継続パターンまたは反転パターンとして現れます。物事を簡単にするために、このインジケーターを使用して、検索するパターンのタイプを選択でき
Strategy is based on the position of the previous bar relative to the Moving Average indicator. Working timeframe is М30. Features The template features an adaptive forecast algorithm based on history data of price action; It has multiple filters for opening new orders; Compatible with any trading strategy, both manual or automatic (Expert Advisors); It has the maximum possible and compatible functionality: adaptive order grid, locking, averaging, rebuying.
Expert Advisor Installation The quot

This indicator is built on a high-precision strategy, which is based on a set of different Moving Averages. Together they form a strategy that provides stable, and most importantly accurate signals.
What is a Moving Average (MA) It is one of the most popular, proven and effective ways to work in the Forex market. Its task is to average price values by smoothing local movements, thereby helping the trader to focus on the major price movements.
How to Trade By default, the indicator has 2 line
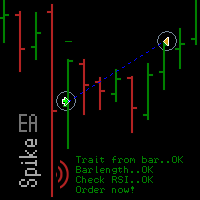
Spike missed? The EA_Spike reacts to spike and uses the RSI indicator as filter. The trade selection and frequency is set with Barlength, TradesperDay and the RSI. The expert advisor is open for many underlyings and all chart periods. It feels most comfortable in a portfolio and can run on several charts with various settings at the same time. You will find suitable settings with the optimization.
Backtest Examples as screenshots. Based on tick data .
Inputs The setting options of the EA are

The easy-to-use trading system SmartScalper generates the following signals: BUY SELL close BUY close SEEL SmartScalper works on the М15 timeframe and is optimized to work on GBPUSD, XAUUSD, GBPJPY, EURJPY, EURUSD. 12 different sets of trading algorithms are designed for trading (6 buy and 6 sell trades), which can be quickly selected by the trader using buttons in the indicator window, or are set in the input dialog. The efficiency of the trading algorithms chosen by the trader is measured in r

The strategy is based on the elements used in trading by the market makers - trading against the crowd. The EA uses real trade volume information. The indicator simultaneously displays the information on 10 pairs on the chart, where the results can also be compared.
Online results of the EA operation Signal: ExchangeOnLine
Expert Advisor Settings For the on-line version to work, it is necessary to add the "" to the list of allowed URL in Tools > Options > Expert Advisors. Mode - trading mode

Fully automatic scalper EA. Trades are opened based on two indicators. The news filter is built-in. It is recommended to perform optimization for your broker and account type. Optimize only the settings of the indicator. Minimum deposit is 1000 USD or cents per 0.01 lot per 1 pair. It works around the clock, VPS is recommended. Recommended timeframe is H1. A live monitoring of the Colibri can be found here: https://www.mql5.com/en/users/ildarvin/seller
Settings Lots - initial lot Fix lot on/of

MultiCurrency Indicators is a multi-currency indicator which calculates the values of multiple standard indicators for each of the 8 major currencies: EUR, GBP, AUD, NZD, USD, CAD, CHF, JPY.
Advantages of the indicator Calculation is performed for 8 virtual charts of the currencies: EUR, GBP, AUD, NZD, USD, CAD, CHF, JPY; Show the currency strength, which does not depend on the currency pair; It allows determining the strongest and the weakest currencies at any moment, it also sorts currencies

This indicator marks the long or short force of each candle. Green = long. Red = Short
Parameters: The periods serve to make the indicator functions faster or slower. We recommend to run faster periods 4-10 or slower periods 12-26. PeriodFast : Numbers of Bars used for the calculations of fast period (Recommended value 4) PeriodSlow : Numbers of Bars used for the calculations of slow period (Recommended value 10)

The function of this indicator is to indicate to us the degree of volatility that is having a specific section. As long as the volatility line does not cross with its mean it is indicative that the volatility continues, and as long as the price does not reverse the continuation should be guaranteed. The crossing below its average would indicate exhaustion or end of said section.
Parameters: The periods serve to make the indicator functions faster or slower. You can modify the periods but the r

The function of this indicator is to confirm or cancel a possible rupture of a roof or floor. Parameters: The periods serve to make the indicator functions faster or slower. You can modify the periods but the recommended ones are the ones that come by default or is 14-12. PeriodSentry : Number of Bars used for calculations (Recommended value 14). PeriodMedium : Number of average Bars used for calculations (Recommended value 12). BandSup : Superior Band (Recommended value 50). BandInf : Inferior

This tool set Stop Loss and Take Profit, which are invisible for the broker. But keep in mind that the terminal must be constantly running and connected. It means that you cannot turn off your computer or close the terminal. In the strategy tester, the tool opens positions and manages them using stop-order for demonstration purposes.
Parameters Take Profit Stop Loss Slippage
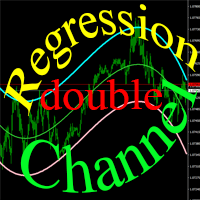
Trading robot for a real account. It is a continuation of the idea used as the basis of the popular Regression Channel EA. Unlike its predecessor, it uses a bidirectional trading algorithm. The robot trades inside a channel formed by regression curves. Deals are always by stop losses.
Strategy Features The robot trades inside a trend channel bound by the curves of a polynomial regression. The trend direction and strength are determined by the gradient of the channel cures during the trading. M

BG Robonight is an Expert Advisor that works at the junction of the American and Pacific sessions. The default settings are designed for trading on the M15 timeframe. With these settings, the EA operates in the classic night scalper mode. The initial objective of the EA was to enable multicurrency trading with the same settings for all pairs. By default, the EA is recommended for use on the following currency pairs: AUDCAD, CADCHF, EURCAD, GBPCAD, AUDCHF, GBPAUD. The EA features a news filter, w

MMM Ichimoku EA strategy: The robot uses its built in Ichimoku indicator all the time and does a calculation to determine the prices trends. If it indicates the price will be bullish, it sends a buy order. If the indicator indicates the price will be bearish, it sends a sell order; It will not send an order unless the calculations determines a good trend of profit; Like all MMM products it is also programmed to minimize your losses and protect your money from the hostile market. We have protecti

I present you the Goliath scalping Expert Advisor. The trade operations are performed according to a certain algorithm. Only one order can be opened on one financial instrument at a time. Also, Stop Loss and Take Profit are always set when opening orders. Timeframe: M5
Parameters Lot - specified lot value of a trading position Risk - automated calculation per deal StopLoss - maximum allowed loss level TakeProfit - maximum profit value StartHour - trading start time, hours
StartMinute - tradin

Strx Super Grid is a grid system with many advanced features. It places the first 2 orders as BUY_STOP and SELL_STOP distanced from current price by the GridPoints specified; when an order becomes active, the other is canceled. User can also choose to open immediately a position or a pending order via the new FirstImmediateOrder input. If GridPoints is 0 (default), grid is auto-sized based on last 500 bars (max-min closes) divided by MaxOrders input parameter. If trade becomes profitable, after
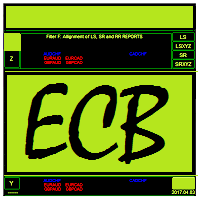
Ejike Currency Basket compiles and analyses foreign exchange currency strength and volatility dynamics for the 8 major currencies. Its data are formulated from market prices and volatility. ECB visually cross-references its own reports to generate high probability trade pairs, the build-up to which is interactive that the trader can easily assume the role of Analyst. Its 28-pair real time monitoring involves a constant comparison of its current to past data. On adjusting a parameter, it will cha

This indicator is based on ADX, RSI and CCI. Each indicator show trend arrows on each timeframe. If all arrows are in the same trend, the SELL/BUY signal is the strongest.
Settings Spread Threshold - value of spread threshold ADX Setup ADX Period ADX Price - price of ADX (Close, Open, High, Low, Median(High + Low)/2, Typical(High + Low + Close)/3, Weighted(High + Low + Close + Close)/4). Level of ADX Trend - ADX level Strong of ADX Trend - ADX for Strong Signal RSI Setup M1...MN period Price -

This robot uses a custom hidden oscillating indicator and also analyzes the market response. It traded mostly at the time of higher volatility. It works with several pending orders with different size of volume and their position actively modifies. It uses advanced money management. TradingMode setting can also meet the conditions FIFO.
It is successful in different markets and different timeframes. Best results are achieves with a broker with the spread to 5 points on EURUSD. Is necessary a b
This indicator works based on an improved system of triple moving averages (MA). In conjunction, this system is able to deliver impressive results in trading. The indicator is easy to use. It represents 2 arrows which are automatically drawn after a bar is closed, showing where the price is likely to move in the nearest future based on the combination of the signals from all MAs.
What is Moving Average (MA)? It is one of the most popular, proven and efficient methods for Forex trading. Its pri

Neurone is a trend strategy based on neural network analysis.
Strategy Description The strategy is based on the algorithm of a self-learning neural network. The idea of the algorithm was taken from a famous demonstration of artificial intelligence training in the game with 11 matches. The trading day is divided into 6 trading intervals, which are associated with the H4 candles. Each candle withing a day is a neuron. The history data associated with the neuron are passed as input for the neuron

RiverScope Lite automatically determines the nearest most important price levels and support and resistance zones in history, it also identifies a large number of price action patterns (the lite version is limited to 10, while the full version has 30+). The support and resistance levels are determined based on an algorithm that calculates and filters the historical values of the price, its movement character, volumes, etc. It displays the current situation, therefore the nearest levels change in

The Expert Advisor uses 3 different strategies based on news fluctuations. The EA downloads the news from economic sites. The EA takes into account only HIGH and MEDIUM impact news and trades on their basis. The EA uses a smart profit taking system. It was backtested and optimized using real ticks with 99,9% quality. Monitoring : https://www.mql5.com/en/signals/author/profi_mql . Optimized for EURUSD, AUDUSD, GBPUSD, USDJPY, NZDUSD / H1 For the EA to work correctly, open Tools > Options > Expert

The MACD TrendMA indicator is a trading system developed on the basis of the MACD indicator popular among many traders, and which is based on measuring the inclination (trend) angle of the moving averages, while measuring the ratio (convergence/divergence) between them. The signal for entering/exiting the market is the frame of the bars colors and color of the MACD TrendMA histogram according to the trend, which can be customized in the properties window of the indicator - in case the inclinatio

The News Notifier EA downloads, displays and sends email or push notifications with the news of the intraday economic calendar from investing.com, as well as the status of the trading account.
Easy adjustment of input parameters for: Choosing the language of the news (English, Russian); Settings the color for the information bar and text; The number of lines of news displayed; Selecting the period and time for automatic updating and notification of information; Selecting the type of the broadc
Gold Digger Martingale Robot is a fully automated scalping Expert Advisor based on Heiken Ashi, Moving Average and Ichimoku Kinko Hyo. Each entry point is calculated using an advanced entry filter based on Price Action by following the trend.
Advantages Money management system. Indicators are Heiken Ashi, Moving Average and Ichimoku Kinko Hyo for filter sideway and scalping by following the trend. Easy to set up.
Requirements Symbols: XAUUSD H4. Minimum deposit: $500. Leverage: 1:400-1:500.

I recommend you to read the product's blog (manual) from start to end so that it is clear from the beginning what the indicactor offers. This multi time frame and multi symbol indicator scans for pin bars. Combined with your own rules and techniques, this indicator will allow you to create (or enhance) your own powerful system. Features
Can monitor all symbols visible in your Market Watch window at the same time. Apply the indicator to just one chart and instantly monitor the entire market.

This indicator can display 1-3 CCI indicator on different time frames and settings. The active indicators can give visual and sound alert on oversold/overbought level if the user choose that option. Alert can be set on one or all active indicator, even if the time frame, the period and the oversold/overbought level different on each. There is a display panel with buttons on the main chart, what is show the active indicators and their settings. There is an option to hide this panel. With the butt

Multi Feature Robot suit for trading in semi automatic mode. The robot uses Heiken Ashi indicator to form signals. It provides two options for trades. 1. Heiken Ashi trade - use signal trade for buy and sell. 2. Reverse trade - use Heiken Ashi stop loss for buy stop and sell stop. Also, provide additional feature for a trader which is: 3. Trend line trade - use trend line for buy and sell. This trend line trade feature is not for fully automated trading because it needs trend line input. Trader
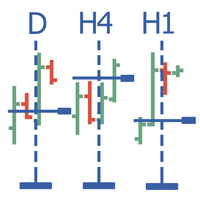
Multitimeframe navigation and research tool MT4 ( XY expert advisor) is a convenient tool that allows analyzing the trading instruments on different time frames and fast switching between them. Easy to use. It has no adjustable parameters. Charts with an XY Expert Advisor can be either the same symbol (instrument) or different (from version 2.0). When a symbol is changed on one of the charts with the XY expert advisor , cascade change of symbols occurs on other charts with the XY attached. The X

This indicator can determine the current direction of the market and the most probable future direction on the basis of its own algorithms which only analyze the price action. The indicator calculates and displays current buy/sell levels, as well as required buy/sell levels for a balanced movement. The indicator generates buy/sell signals. These signals can be filtered both manual and automatically, and you can also enable both filters.
Features fast, convenient, easy working wherever possible

The Triple Exponential Moving Average (TEMA) combines a single EMA, a double EMA and a triple EMA. TEMA = 3*EMA - 3*EMA(EMA) + EMA(EMA(EMA)) Setting is very easy, you must set only period of one EMA. I prefer to use two TEMAs for accurate signal.
Settings Period of EMA - defined period of EMA. Test it on Demo account before Real Account. Trading is risky and at your own risk.
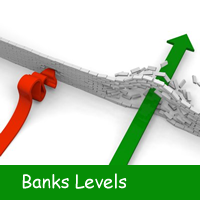
This indicator calculates and draws bank levels from a minimum of three days to a maximum of ten days. It is very useful to trade the breakout or the pullback and when the price levels break the highest or lowest level, indicating an imminent explosion of volatility. Best use with Pips Average Range indicator.
Parameters settings numbers_of_day - from 3 to 10 (better use on 10 days). levels_High_color - set color for High levels. levels_Low_color - set color for Low levels.

This indicator compares the pips of the current day with the average of pips made in the previous three days. The "Percentage today range" is red if today's figure is less than the range of the previous three days, but turns green when the percentage exceeds 100%. When the range exceeds 100% there are good trading opportunities because we are in the presence of increased volatility of the past three days. Best use with Banks Day Levels indicator.
Parameters settings corner (indicator display p
MetaTraderマーケットは、他に類のない自動売買ロボットやテクニカル指標の販売場所です。
MQL5.community ユーザーメモを読んで、取引シグナルのコピー、フリーランサーによるカスタムアプリの開発、支払いシステムを経由した自動支払い、MQL5Cloud Networkなど、当社がトレーダーに対して提供するユニークなサービスについて詳しくご覧ください。
取引の機会を逃しています。
- 無料取引アプリ
- 8千を超えるシグナルをコピー
- 金融ニュースで金融マーケットを探索
新規登録
ログイン