YouTubeにあるマーケットチュートリアルビデオをご覧ください
ロボットや指標を購入する
仮想ホスティングで
EAを実行
EAを実行
ロボットや指標を購入前にテストする
マーケットで収入を得る
販売のためにプロダクトをプレゼンテーションする方法
MetaTrader 4のためのエキスパートアドバイザーとインディケータ - 220

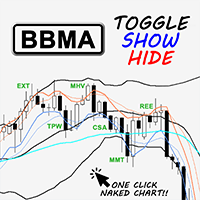
Intro A customizable toggle indicator based on BBMA (Bollinger Bands & Moving Averages) trading system which allows traders to switch between BBMA & Naked Chart in one click, without having the need to change the chart template.
Main Features One Click Toggle Show/Hide : Switch to naked chart in just one click! Combine it with other trading strategy as you prefer to give more confluence on your trading. All drawn objects will not be affected by the indicator toggle show/hide function. Customiz

This strategy is characterized by simplicity and rudeness. Simple things, it is widely applicable, durable, strong stability. This is an advantage to having a certain amount of money, because the demand for big money is stable. The need for small capital is efficiency. Efficiency requires Intensive farming. There are a lot of things you can refine to increase your efficiency. But I’m not sure I can build a sophisticated EA money machine. Efficiency and stability are a dialectical relationship. H

Indicator plots price cycle blocks and sends signals with smart volume confirmation. Price cycles and fractals are combined to determine the demand/supply blocks. The indicator can be used alone or combined with other Cycle Indicators Inputs: Period: Recommended value is between 35 and 55( Which are Set 1 and Set 2 periods of cycle sniper ) Engulfing: If true, you will be able to see the engulfing bar confirmation. Volume Filter: True (The arrow comes with volume confirmation ) Videos with dif

Quant Botは、EUR / USDの1時間の時間枠でのトレンド取引用です。 セットファイルはありませんが、他のペアを使用する場合は、最適化が必要になる場合があります。
ボットについて:
遺伝子生成を使用し、ATRを使用して取引します。 カーブフィットを防ぐためにウォークフォワード期間が使用されました EAはすべての取引でストップを使用します。 お金の管理は、バランスの%でスケールアップします バックセット期間は2003年から2020年までであり、前進は2020年から2022年まででした(写真を参照)。
Quant Botは、EUR / USDの1時間の時間枠でのトレンド取引用です。 セットファイルはありませんが、他のペアを使用する場合は、最適化が必要になる場合があります。
ボットについて:
遺伝子生成を使用し、ATRを使用して取引します。 カーブフィットを防ぐためにウォークフォワード期間が使用されました EAはすべての取引でストップを使用します。 お金の管理は、バランスの%でスケールアップします バックセット期間は2003年から2020年までであり、前進は2020年か
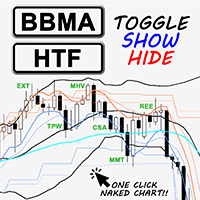
Intro A customizable toggle indicator based on BBMA (Bollinger Bands & Moving Averages) trading system which allows traders to switch between BBMA & Naked Chart in one click, without having the need to change the chart template. Added ability to view higher time frame zones on a lower time frame chart, in one click, to assist traders on multi-time frame analysis.
Main Features One Click Toggle Show/Hide : Switch to naked chart in just one click! Combine it with other trading strategy as you pre

Wave Anatomy Visit: http://www.tradethevolumewaves.com for more information
Construct your own 5 Waves and analyze the price movements stages:
Easy Movement Hard time to move Fast move This indicator is based on Wyckoff’s, David’s Weis and my Speed Index Theory. This indicator will you help analyze what is happening in 5 Price Waves that you can construct yourself. This tool is designed for scalpers and swing traders and will help them to analyze any wave on any timeframe at the same time.

What Is MT4 Candlestick Pattern Indicator Candlestick patterns are groups of candlestick that have a meaning for the trader. These groups are usually composed of two, three, four, or five candles and indicate some form of price action happening. In many cases traders use these patterns to decide what to do next. Candlestick Pattern Indicator for MT4 is a plugin that allows you to see the most common candlestick patterns on your chart. The indicator scans the chart and detects popular patterns, m

一目のパネルは、すべての時間枠でのさまざまな一目の信号の動作を示すインジケーターです。
システムパラメータ:
てんかんせん:てんかんせんの平均期間。
KIJUN SEN:KijunSenの平均期間。
SENKOU SPAN B:SenkouSpanBの平均期間。
SHOW TENKAN..KIJUN:移動平均TENKANSENとKIJUNSENの交差を示します。
SHOW KIJUN..KUMO:雲または一目の雲に対するkijunsen移動平均の位置を示します。
SHOW CHICOU..KUMO:雲または一目の雲に対する移動平均チクースパンの位置を示します。
SHOW KIJUN:移動平均kijunsenの角度動作を示します。
SHOW CHICOU..PRICE:価格に対するスパンチクーの位置を示します。
SHOW KUMO:未来の雲や雲の気持ちを表現します。
強気の色:強気のシグナルの色。
弱気の色:弱気のシグナルの色。
ニュートラルカラー:ニュートラル信号の色。

The added video will show you the full functionality, effectiveness, and simplicity of this trade manager. Drag and Drop Trade Manager. Draw your entry and have the tool calculate the rest. Advanced targeting and close portions of a trade directly available in tool (manage trades while you sleep). Market order or limit order on either side with factored spread. Just draw the entry, the tool does the rest. Hotkey setup to make it simple. Draw where you want to enter, and the stop loss, the tool c

The Trainspotting technical analysis indicator shows market entry points, potential market reversal points. The intelligent algorithm of the indicator accurately determines the trend. Uses two options for settings. The indicator is built for simple and effective visual trend detection with an additional smoothing filter.
Are you tired of the constant ups and downs? Do not become a victim of unstable market movements, it's time to get rid of it somehow! Already now you can use Trainspotting sol

Strangelove monitors the formation of a trend and helps the user identify entry points. Thanks to this data, the investor is able to predict the situation and form a game strategy. It is trend signals that allow clients of brokerage companies to achieve efficient use of trading instruments and achieve better profitability.
The correct calculation of the current trend is the key to successful asset trading in the foreign exchange market. It is important to understand that trading is never in a

Reservoir is a reversal indicator and is part of a special category of instruments. The indicator not only analyzes the price movement, but also indicates the points of possible reversals. This contributes to the quick and optimal opening of buy or sell orders (depending on the current situation). In this case, the historical data of the analyzed asset is necessarily taken into account. It is the correct implementation of such actions that in many ways helps traders make the right decision in t

Trend Market EA это полностью автоматическая система. В данный момент советник продаётся по акции по цене 499 $ вместо 999 $ Trend Market EA - работает по направлению тренда на старшем таймфрейме. Сигналом на открытие ордера служит сигнал индикатора HMA на графике текущего таймфрейма, на котором установлен советник, Если сигнал совпадает с направлением тренда на старшем таймфрейме, то советник открывает рыночный ордер в направлении тренда. Если же тейкпрофит не достигут, а тренд разворачивает

Dear users, January will be the last month that I will keep LL Gold Miner EA for sale at the price of $45 . From next month I will update the prices bringing the lifetime license to $250 , in order to guarantee the exclusivity of the strategy . However I will unlock the ability to rent the EA for 1/3/12 months while keeping the prices reasonably lower. So this really is your last chance to secure your lifetime copy of this fantastic strategy at this price . Don't mis

Back to the Future is a trend indicator. It consists of four parts.
1. Part is the fibo levels that define the minimum and maximum targets.
2. This is a target level that defines the minimum correction targets and trend targets.
3. Dynamic levels correction targets and trend targets..
4. Trend levels based on trend lines.
All parts are included in the indicator menu.
the indicator Back to the Future does not repaint.
The change of information comes after the calculation of the last 3 bars.

Some disadvantages of Rollover Scalper: Currently the markets aren't that favorable for night scalping because of the fundamentals, so the next few months the EA might show 0% or even negative return. However, it happened in the past too and it was still profitable over all ~20 years. It's a scalper, so you'll need a broker with low spread and good execution time, preferably an ECN broker. ICMarkets would be a good choice. It's susceptible to slippage (which can't be backtested or limited on ECN

Waterfront - A unique trending indicator. The new system adapts to the market, eliminates additional conditions and copes with its task. A revolutionary new way to detect the beginning of a trend early. Trend indicator, shows signals, can be used with an optimal risk ratio. It uses reliable algorithms in calculations. It shows favorable moments for entering the market with arrows, that is, using the indicator is quite simple.
Trend indicators make it possible to classify the direction of price
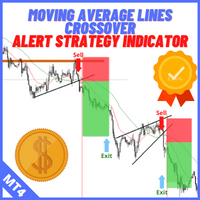
Description: For a comprehensive understanding of our indicators, we invite you to explore the entire Q&A section within this MQL5 blog post here . The "Moving Average Lines Crossover with Alert" is a valuable technical analysis tool designed to help traders identify potential trend reversals and trading opportunities. Seamlessly integrated into your trading platform, this indicator empowers you with essential data to make well-informed trading decisions. Spot Trend Reversals: Utilize the po
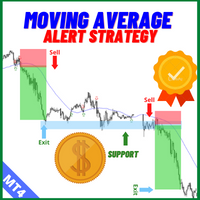
Description: For a comprehensive understanding of our indicators, we invite you to explore the entire Q&A section within this MQL5 blog post here . The Moving Average Cross Price Alert Indicator is a technical tool designed to simplify your trading decisions. With a single moving average line, this indicator effectively identifies trend changes and potential trade opportunities. Its core function is to provide real-time alerts when the price crosses above or below the moving average line, sig

Hello all The expert works in a digital way to determine the liquidity in the market with making deals BUYSTOP AND SELLSTOP From the current price with the distance control from the step from the expert settings Only the first deal works with him, the method of chasing the profit, the trolling stop The expert works to close the last profitable deal with the first SELL and BUY trade With the method of closing deals from Win Equity The expert works on currency pairs and works on gold The expert w
********** CHRISTMAS OFFER - LIMITED TIME ONLY 30$ **********
6 COPIES OUT OF 10 LEFT AT $35 ---> NEXT PRICE $55
UPDATED v1.8 IS OUT ON MARCH 2022 " I built this EA based on my past trading experience, on my personal needs, on what I already had in my hands, on those useful functions that I needed.
I am happy to share it with you at a very small cost considering the potential and the time dedicated to developing it. " PLEASE READ ALL THE DESCRIPTION BEFORE USE IT - Grid EA with selectable

Syn3rgy is a multicurrency scalping EA trading on EURUSD, GBPUSD, USDCAD, USDCHF, EURGBP, EURCHF on a M15 timeframe. Syn3rgy has a unique entry and exit strategy combining both time and filtering mechanism to manage trades.
Features Fully automated Forex trading robot A safe, accurate and unique trading strategy Developed with over 5 years of data Effective Money Management, Exponential growth Start with as low as $50 Works on all brokers preferable low spread brokers.
Parameters No_of_Tra

This trading system is based on mathematical probability. In this case, 5 consecutive candles are compared with each other. For a logical comparison, consider these 5 candles as 1 candle on the M5 timeframe. Therefore, the comparison begins with the opening of a candle on the M5 timeframe. The probability of a match is 50% in the 1st candle, 25% in the 2nd candle, 12.5% in the 3rd candle, 6.25% in the 4th candle, 3.125% in the 5th candle. Thus, the 5th candle has a probability of matching in 1

This EA won't make you rich overnight and blown your account one day, it makes you wealthy in the long-term. If you are looking for EA could make you sleep well at night and make real money, RobustProfitEA is the answer for you. The RobustProfitEA based on simple but robust trend strategy to make sure you are profitable in the long-term no matter what the market conditions are. The performance are tested with high quality tick data from Dukascopy (include commission fees and slippages per trade

Price Action Areas is an indicator that draws the areas in which to intervene to buy or sell. It is suitable for those who trade using the price action . It can also be used as a support with other indicators such as the Super Channel, as you see in the images, or the MaxandMin to confirm the entry level. You can use it to view areas across multiple Time Frames and you will have a good entry signal. It is a simple but effective indicator.

Market Pulse is a unique author's algorithm that combines a simple strategy for breakout levels, combined with a multi-level system of filters and modules. If you noticed that 90% of authors in MQL have real monitoring of their experts is rarely more than $100-$500. But in strategy tester, their EAs bring millions of dollars in profit. However, nobody asks why they sell these EAs, if they can become a millionaire in one year. I offer you a different approach to forex trading, a realistic profes
Sentalis Master Key PRO EA is an advanced system that uses a complex algorithim that factors in over six built in custom indicators. It can be as easy or as complex as you the trader chose it to be. Sentalis Master Key EA is a result of hundreds of hours of Forward Testing on all the Major Pairs (GBPUSD; EURUSD; AUDUSD; USDJPY; USDCAD; USDCHF, and EURGBP. It is a fully automated and configurable , multi-currency Expert Advisor that factors in real-time price trend , market strength

Indicator which identifies Trend and also buy/sell opportunities. Use for entries aligned to the Trend. Although Diamond Trend is very accurate identifying entry points, it is always recommended to use a support indicator in order to reconfirm the operation. Remind to look for those Assets and Timeframes which best fit to your trader behavior/need... Valid for Scalping and Long Term operations. Please, set up a Bars Chart to be able to visualize the indicator properly... ...And remind to give

Please thoroughly test demo the indicator in your preferred trading conditions before making a purchase decision.
Your satisfaction and confidence in its performance are paramount. MT MERIT TLC (Trend Line Channel) :
The TLC indicator identifies reversal or breakout signals using plotted trend line channels relative to the current price. It is tailored for manual traders who manage risk independently (Stop Loss, Take Profit, Risk-Reward). Indicator for traders who prefer manual trading.
TRA

Полностью автоматический торговый робот, основанный на математиечских алгоритмах. Советник использует статистический анализ волатильности рынка, подтверждая сигналы техническими индикаторами, разработанными на основе опыта множества трейдеров. Рекомендуемая валютная пара: USDCHF Рекомендуемый Timeframe: M15 Робот может торговать у любого брокера Для бесперебойной торговли и результата рекомендуется устанавливать советника на VPS, а также не вмешиваться в торговлю! Все настройки окончательные. По
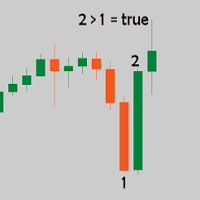
Candles length indicator is, as the name suggests, an indicator that displays the body size of each candle. The nominal size is placed below each bearish candle and below each bullish candle. How to install the Candles length Indicator on your Metatrader 4 trading plaftform? Download the indicator
Copy and paste the Candle Body Size Indicator files into following folder of your Metatrader 4 (MT4) platform: MQL4 > Indicators. You can gain access to the folders this way: File > Open Data Folder >

Crypto Netは、1時間の時間枠でBTCUSDを取引するためのものです。 それは戦略を進化させるために遺伝的進化を使用します。 このEAトレードトレンドは、ATRと一目の嘘の指標に続いています。 これは構築され、モンテカルロやウォークフォワードを含む一連の堅牢なテストに合格しました。
入力:
最小リスクであるアカウントの割合。 最大ロット数 取引を停止する時間 他に何も変更されていません。
フォワードのみのトレード。 バックテストはありません。
ブローカーの時間は、戦略が組み込まれたものとは異なります。
Crypto Netは、1時間の時間枠でBTCUSDを取引するためのものです。 それは戦略を進化させるために遺伝的進化を使用します。 このEAトレードトレンドは、ATRと一目の嘘の指標に続いています。 これは構築され、モンテカルロやウォークフォワードを含む一連の堅牢なテストに合格しました。
入力:
最小リスクであるアカウントの割合。 最大ロット数 取引を停止する時間 他に何も変更されていません。

The indicator, Support and Resistance Detect Signal automatically detects support and resistance levels and trend lines, emitting a signal whenever the condition is met, as configured.
It reads support and resistance drawn manually or automatically built into the chart by other external indicators.
Note: Support and Resistance Detect Signal is compatible with almost all external indicators that draw on the chart, support and resistance levels, in addition to trend lines.
Discover our

Night Star is a fully automated, multi-strategic expert advisor that trades at night. Advisor is specially designed to take advantage of inefficiencies in the current market conditions. Please check Live Signal and My Products NO GRID, NO MARTINGALE & NO OVERTRADING Only 10 Copies Left At $90. Price will keep increasing for this advisor.
Advisor was tested with high slippage , commission per round lot , variable spread and live like delay executions using real ticks with 99.9% hist

XP Trade Copier Copy From MT4 to MT4 Copy From MT4 to MT5 Copy from MT5 to MT5 Copy from MT5 to MT5 Note: You need to purchase the MT5 version to be able to copy from/to MT5 from/to MT4.
COPIER SETTINGS · Working Mode: There are 2 options: Provider and Follower. o Provide: In Provider mode the EA sends the trades to the follower. o Follower: in Follower mode the EA receives the trades from the provider. · Copier Identifier: You can use multi-instances from the EA as Provid

Трендовый индикатор Sparta анализирует состояние рынка, фазу его движения и во многом определяет успешность трейдера в его не легкой работе. Индикатор использует в своей основе процесс выявления скорости изменения роста цены и позволяет найти точки входа и выхода с рынка. Он был создан на основе оригинальных индикаторов поиска экстремумов, индикатор хорошо подходит для определения разворота или большого резкого рывка в одну из сторон благодаря ему вы будете знать когда такое произойдет.
Многим

Trading with the Transition to quality indicator is as simple as possible, if a blue arrow appears on the chart pointing up, a buy deal is opened. In the same case, if you see a red arrow pointing down, open a sell order.
That is, everything is as simple as possible, positions are closed according to the reverse scheme, that is, as soon as a signal is received to open an order in the opposite direction from your position. For example, you opened a long position (sell), close it when a red arro

Dependence arrow indicator for forex, futures and binary options without redrawing. It gives a lot of signals, which requires additional indicators to check them. Works only on opening prices. Therefore, reliable and without redrawing. Often signals that went in the wrong direction are canceled out on the next signal.
Unfortunately, most popular indicators in practice give a huge number of false signals, since they all work without any consideration of global trends. That is why in today's con
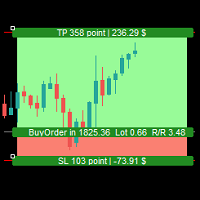
Simple Assistant for Trading
Precise Risk Management in each
Automatic Money Management Visual Trading Open Position Management User friendly and practical
during 15 years of considerable experience in stock market, we have dealt with many professional traders who have been used profitable and unrivalled methods in this market but failed in the long term. The reason is undoubtedly the lack of standard in their manner during their trade. Standard means the accurate repetition of a process….

平均価格インフィニティへようこそ! これは、速いターゲットを探し、常に操作を続けたい人にとって非常に攻撃的なロボットです。 彼は常に市場の当面のトレンドを測定し、迅速なターゲットを探して取引を開始します。 その戦略は平均価格に基づいているため、資産価格が注文の反対側に行くと、新しい注文が開かれ、それらの間の平均価格が検索されます。 このロボットを操作するために推奨される最低額は5000ドルです。 このロボットはEUR / USD(ユーロドル)のみで取引されるように作られました。テストされた動作時間はM5(5分)です。 始める価値がほとんどない人私は、このリンクから口座を開設し、標準セント口座を作成することをお勧めします。 このようにして、すべての資本がセントに変換され、50ドルを使用して5000セントで運用できます。
利用可能なCentsアカウントとの仲介リンク: https://one.exness.link/a/vt5nlehvd6 テレグラムグループリンク: https://t.me/+dzYbgvHW_HA4N2Zh
財務通知 これは積極的かつ継続的な財務業務の産物であり

Scalp Bonanza is an scalping robot with advanced systems to see when the price is moving in one direction. Tight trailing stoploss is what exits the trade. You will se a lot of trades!! This system is made for high volatility markets that are fast trending, therefore I think its best to have it running for 45-60 minutes after open.
Supported currency pairs: GER40 (DAX), US30 (Dow Jones), NAS100 (Nasdaq) R ecommended timeframe: 5min (works on multiple tf) Link to SET file The EA does not us

Multi Gold300 Ai Robot is a safe system for Forex and Crypto currencies trading. Developed exclusively for the XAUUSD pair(GOLD) and any currency pairs. Try now! Most Profitable Strategies Inside
Close Order with Money Profit, CutOff technology, Cutloss by amount of trades. Super Special Edition for traders and Introducing Broker and Partners The Ai Robot is designed to operate in the XAUUSD (GOLD) and any currencies market, entering only when there are high probabilities of success and certai

Multi Gold30 Ai Robot is a safe system for Forex and Crypto currencies trading. Developed exclusively for the XAUUSD pair(GOLD) and any currency pairs. Try now! Most Profitable Strategies Inside
Close Order with Money Profit, CutOff technology, Cutloss by amount of trades. Super Special Edition for traders and Introducing Broker and Partners The Ai Robot is designed to operate in the XAUUSD (GOLD) and any currencies market, entering only when there are high probabilities of success and certain

リスクと取引を最高の精度で管理します。その取引機能は、リアルタイムであらゆる種類の資産に限定されるだけでなく、戦略テスターで使用して、関心のある指標とともにあらゆる戦略をバックテストすることもできます。 、リスクを冒さずに今すぐ戦略を実践し、結果レポートを印刷してパフォーマンスログを実行してください。
私たちのトレーディングアシスタントはインタラクティブなコントロールパネルを備えており、トレードのリスクを管理し、利益と損失の比率を選択し、任意のタイプを配置し、オンデマンドで、またはすべてワンクリックで閉じることができます。また、各操作にかかる可能性のあるすべての費用を考慮に入れて、それらすべてを損益分岐点に配置するオプションもあります。
そのグラフィックツールを使用すると、エントリポイント、ストップロス、テイクプロフィットがどこにあるかを直感的に視覚化できます。あなたはいつでもあなたがどれだけのリスクを冒していてどれだけ稼ぐことができるかを知ることができ、数回クリックするだけであなたが望むリスクと比率を調整することができます。すでに取引時に、あなたはあなたが行っている取引の種類を

Transition Angle is an arrow indicator for identifying potential entry points. I like it, first of all, because it has a simple mechanism of work, adaptation to all time periods and trading tactics. Suitable for trading on low timeframes because it ignores sudden price spikes or corrections in price action by reducing market noise around the average price. Works on all currency pairs and on all timeframes. Ready trading system. Take Profit is bigger than Stop Loss! Works on all currency pairs an

スキャルピング矢印は再描画されません -チャート上に価格反転ポイントを示し、そのシグナルを再描画しないインジケーター。また、インジケーターは電子メールとプッシュを介してトレーダーにシグナルを送信します。このインジケーターの信号の精度は、M5タイムフレームで約92〜94%、H1タイムフレームで95%以上です。したがって、この指標により、トレーダーは正確に取引を開始し、さらなる価格変動を予測することができます。チャート上の価格反転ポイントは、すべてのトレーダーに対してシンプルでわかりやすい矢印を使用して示されています。絶え間なく動的な市場の変化を考えると、この指標は過去の相場データを収集し、数学モデルを使用して学習することができます。 インジケーターはシグナルを再描画しません。 インジケーターは、M1からD1までの時間枠で機能します 重要! このインジケーターを購入すると、リンク https://www.mql5.com/ru/market/product/69755で最高の自動ボットの1つをギフトとして受け取ることができます 。 。 スキャルピング矢印がインジケーターを再描画しないこと
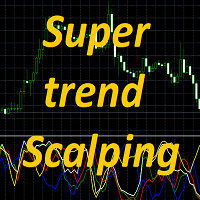
Super trend scalping 1つのウィンドウ内の異なる通貨ペアの5つのストキャスティクスのセットです。トレンドの強さと方向性を判断し、価格の反転ポイントを見つけるように設計されています。このインジケーターを使用すると、1つのウィンドウで5つのストキャスティクスインジケーターの相関を同時に観察できます。また、確率論の発散を判断し、市場へのエントリポイントを正確に見つけることができます。インディケータは、任意の通貨ペアおよび任意の時間枠での作業に適しています。インジケーターの設定では、1つのウィンドウに表示する通貨ペアを選択できます。通貨ペアの最大数は5です。
インジケーターの利点: 再描画しません チャートの1つのウィンドウに、さまざまな通貨ペアの5つの確率論が表示されます。 ストキャスティクスによる発散の決定に適しています。 インジケーター設定: period_K -Kラインを計算するための期間(バーの数)。 period_D -ラインDを計算するための平均期間。 Para1-5 -通貨ペアモニタリングの選択。 Bars -表示するバーの数。

Naked Forex Kangaroo Tail Indicator for MT4 Kangaroo Tail Indicator is a pattern recognition indicator for Forex, Stocks, Indices, Futures, Commodities and Cryptos.
The Kangaroo Tail is a multi-bar pattern.
The Kangaroo Tail pattern is very effective and is very simple to trade.
The strategy that comes with the Kangaroo Tail is based on price action.
The indicator does what it was designed for: displaying Kangaroo Tail patterns. Don't expect to follow the up and down arrows and make money

Fomezeex は自動スキャルピングロボットです。 GBPUSDとEURUSDでの取引。ボットはM1、M5、H1の時間枠で取引されます。ロボットは、インジケーター、数式、抵抗線、サポートラインを使用して市場を分析します。良い信号を見つけた後、ロボットは設定で指定された距離で保留中の注文を開きます。保留中の注文が一定時間内に機能しない場合、その注文は削除されます。保留中の注文がトリガーされ、価格の方向性が確認されると、ロボットはオープンディールの追跡を開始します。彼女の足を修正します。そして、取引の利益に達すると、ロボットは自動的にそれを閉じます。取引量のサイズは、ロボット設定のリスクパラメータで指定します。パラメータが0.1に設定されていて、アカウントに$ 1,000がある場合、ロボットは多くの0.1で取引を開始します。残高に$ 10,000がある場合、ロボットは多くの=1で取引を開始します。ロットサイズは、バランスの増加に比例して増加します。
ロボットの利点: これはプロのボットです。これは、このボットの助けを借りて、クライアントのアカウントを管理することを意味します!管理アカ
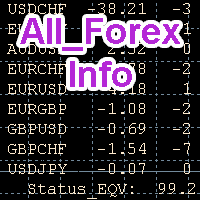
I got a very useful information tool for a trader, trading without it is like trading blind. Try it on a demo account and see if this indicator is a necessary accessory for trading. The Market provides an opportunity to run the demo version only in the strategy tester, but the problem is that the tester in MQL4 is not multi-currency. Therefore, you can see all the advantages of the indicator only on the purchased version. A more expensive version is being prepared for release in the form of a

The utility is designed to save funds on your trading account. There is support for three levels of minimum equity and free margin. For each level, you can set partial (by a certain percentage) or complete closing of all market orders. The partial close percentage is applied for each order separately based on its current size (i.e. the size at the time the equity or free margin reaches the appropriate level). Upon reaching the last third level, the utility can close all charts, which will make i

Naked Forex Tweezer Pro Indicator Tweezer Pro Indicator is a pattern recognition indicator for Forex, Stocks, Indices, Futures, Commodities and Cryptos.
The standard Tweezer is a two bar pattern. Our enhanced version is a multi-bar pattern. We filter the patterns for you so that you only get the best and most effective patterns and ignore the noise.
The Tweezer pattern is a simple and effective pattern to trade.
The strategy that comes with the Tweezer is based on price action.
The Tweez

The sentiment is a reflection of the medium-term and long-term positions of speculators, and earnings of speculators on short-term positions, in which sentiment does not fall. Roughly speaking, what came into profit by traders is fixed in profit, and what did not go into profit begins to “sit out” and “average out” and these positions fall into the mood. And at the same time, major players are starting to work. When there are already few sellers left, the price starts to rise.
To work, you need

It's a multi-symbol and multi-timeframe scanner for our indicator - ACB Breakout Arrows . With default settings, it scans for the buy/sell signals on 28 currency pairs and 9 time-frames concurrently .
Features
It can scan 252* combinations of symbols and time-frames from a single chart. Open the signal's chart loaded with a predefined template with a single click. Easy drag n drop anywhere on the chart. Real-time alerts with popup, sound, push-notifications and email alerts.
Input Parameter

Place Forex trades in different Metatrader accounts at the same time with Local Trade Copier software.
Become a private and independent account manager!
CopyTrade System will allowed you to managment account as Profissional...
Open two separate metatrader accounts, place same EA in experts folder... Reboot MT4 platforms, place EA Master on one Platform, and EA Slave on another platform.
How to use: - Place manual trades on Master account, they will be copied on Slave account. If deal w

Naked Forex Tweezer Standard Indicator
Tweezer Indicator is a pattern recognition indicator for Forex, Stocks, Indices, Futures, Commodities and Cryptos.
The standard Tweezer is a two bar pattern. Our enhanced version is a multi-bar pattern. We filter the patterns for you so that you only get the best and most effective patterns and ignore the noise.
The Tweezer pattern is a simple and effective pattern to trade.
The strategy that comes with the Tweezer is based on price action.
The i

Since MQL5 only limits 1 file in ex4 format that can be uploaded then you need to email to simplifyindi2022@embun.biz to get the support indicators. Without such support indicators then these indicators will not be effective.
There are 1 4 Indicators that are considered the best in this SimplifyIndicator2022 (Multi Time Frame):
This indicator was constructed after 2 years of research during the occurrence of the Covid 19 pandemic. Various indicators were used to obtain the best results. RSI

The Golden Tiger Scalper is a fully automatic advanced trading expert advisor with loss recovery trades using on short term pull back on over bought/ over sold conditions based on various indicators. Trades on Gold (XAUUSD) is one of the most liquid and popular trading instruments in the world. The algorithm is works on Range market condition. The algorithm includes a filter to avoid loss in trend markets condition, it analyzes the depth of market, and makes a decision about entering the t

Naked Forex Big Shadow IndicatorBig Shadow Indicator is a pattern recognition indicator for Forex, Stocks, Indices, Futures, Commodities and Cryptos.
When you have a Big Shadow on your chart then this is a strong signal meaning that you might be ahead of a reversal. You can take other elements (momentum, trend, volatility, price action, fundamentals) to build a complete strategy and confirm your entries. Beware that you might not make money just following the arrows generated by the pattern reco

Leprechaun EA is a fully automatic system. Super PROMOTION! Only one sale at a price of $399 instead of $1499. Hurry up to buy!
Leprechaun EA - works on the strategy of breaking the levels formed by the peaks determined by the ZIGZAG and Fractals indicators. At the moment when the price already passes a certain level, a pending order is triggered and with the help of a trawl, the adviser accompanies the price movement impulse at the time of the level passage. Since there are not many such level

OFFER! OFFER! From 450usd to 370usd this offer may end at any time from now! Don't miss this. Hi traders, I have created this EA and called it "The Account Flipper EA". This trading EA is for both newbies and professional traders. The first goal with this EA is to protect your capital first and the second is to grow your account. Therefore no risky strategies like grid, marti-angle, hedging, or any greedy trading strategies. We use a fixed lot size in every trade, SL, TP and break even all these

TTM Squeeze Indicator TTM Squeeze is an indicator to time entries based on volatility.
TMM Squeeze might well be one of the best and most overlooked indicator. It was created by famous trader John Carter and is also used by many traders like Nathan Bear.
Why is the TTM Squeeze indicator important? Because in trading correct timing entries might be more important than picking the right direction. This is a concept that is not very well understood in the trading community. Most trader think th

Inside Bar Indicator Inside Bar is a very popular candlestick pattern.
Inside Bar indicator can be used to trade Forex, Stocks, Indices, Futures, Commodities and Cryptos.
The Inside Bar indicator will search for inside bar candles pattern in the chart and will generate display them.
The indicator is also able to generate alerts in your screen or sent to your phone.
Inputs of the indicator are:
Symbol : type of char symbol to be displayed in the chart to show Inside Bar patterns CustomCode

Engulfing Bar IndicatorEngulfing Bar indicator is a pattern recognition indicator for Forex, Stocks, Indices, Futures, Commodities and Cryptos.
The Engulfing Bar indicator is an enhanced pattern of the popular Engulfing Bar to keep only the best patterns produced in the market.
The strategy that comes with the Engulfing Bar is based on price action.
Inputs of the indicator are:
Distance: distance in pixels relative to top or bottom of candle to display the arrow symbol UseAlerts (true/false):

Pin Bar Indicator The Pin Bar indicator is a pattern recognition indicator for Forex, Stocks, Indices, Futures, Commodities and Cryptos.
The strategy that comes with the Pin Bar pattern is based on price action.
Inputs of the indicator are:
Distance : distance in pixels relative to top or bottom of candle to display the arrow symbol UseAlerts (true/false): enable alerts PopAlerts (true/false): enable alerts in the popup window EmailAlerts (true/false): enable email alerts PushAlerts (true/fa

*使用前にEAを最適化してください*
EUR/USD向けに最適化された外国為替取引戦略
Expert Advisor (EA) を使用して 1 ~ 2 年以内に多額の富を達成するというのは非現実的な主張です。 バックテストと実際の取引は、EUR/USD 通貨ペアに焦点を当てています。
この戦略について:
これは私たちの戦略の最初の反復を表しており、さらなる進歩の可能性があります。 100% 品質のデータを使用して厳密にテストされており、MT4 エラーはありません。 この戦略は、トレンドフォローの論理原則に基づいて機能します。 トレンドが強気の場合、EA が開始してトレーリング ストップを展開します。逆の場合も同様です。 本質的には、これは単純なトレンド追跡アプローチです。
主な利点と考慮事項:
簡単なセットアップ: デフォルト設定をそのまま使用し、好みに応じてロットサイズを変更するだけです。 リスク管理: この戦略ではマーチンゲールやヘッジは使用されません。 リスク軽減: 各取引には、アベレージ トゥルー レンジ (ATR) によって決定されるトレーリング ストップおよび

This is a new kind of trailing. Forget about pips and points and start thinking about money!
With this Expert Advisor you choose the amount in money (your currency) and when the price reaches that amount the trail will be activated. Let's say you want to lock $10.00 when any order has a floating $20.00 .. Just set the trigger to 20 and the step to 10. This means that when the profit for any order is $20.00, it will lock the price $10.00 bellow . So you lock and guarantee $10.00 profit . As long
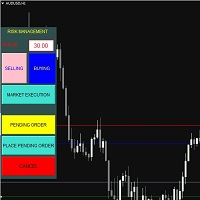
Bot for easy volume management, drag and drop convenience! This is a bot that allows users to calculate volume before entering an order. Users can flexibly enter the risk ratio of 1 order in $. Then choose to enter the immediate order or the pending order. The bot will appear lines to help users edit SL, TP and automatically calculate the corresponding volume. https://tailieuforex.com/bot-tinh-toan-khoi-luong-truoc-khi-vao-lenh-bang-duong-line/
MetaTraderプラットフォームのためのアプリのストアであるMetaTraderアプリストアで自動売買ロボットを購入する方法をご覧ください。
MQL5.community支払いシステムでは、PayPalや銀行カードおよび人気の支払いシステムを通してトランザクションをすることができます。ご満足いただけるように購入前に自動売買ロボットをテストすることを強くお勧めします。
取引の機会を逃しています。
- 無料取引アプリ
- 8千を超えるシグナルをコピー
- 金融ニュースで金融マーケットを探索
新規登録
ログイン