YouTubeにあるマーケットチュートリアルビデオをご覧ください
ロボットや指標を購入する
仮想ホスティングで
EAを実行
EAを実行
ロボットや指標を購入前にテストする
マーケットで収入を得る
販売のためにプロダクトをプレゼンテーションする方法
MetaTrader 4のためのエキスパートアドバイザーとインディケータ - 126
オーダーブロックインジケーターを使用して取引を改善したいと思いませんか? 注文ブロックは、トレンドの変化や強い動きを引き起こす可能性のある買い注文または売り注文が蓄積される市場の領域です。 これらの注文ブロックを特定することは、参入機会と撤退機会を見つけたり、リスクと利益を管理したりするのに非常に役立ちます。 しかし、これらの順序ブロックを手動で見つけるのは難しく、面倒な場合があります。 そのため、私たちは、チャート上でこれらのブロックを自動的に検出してマークするのに役立つ、MetaTrader 4 の注文ブロック インジケーターである Oberis を作成しました。 Oberis はどのように機能しますか? Oberis は、価格と出来高を分析して市場で最も関連性の高い注文ブロックを特定する指標です。 これらの注文ブロックは、強気か弱気かに応じて、緑または赤の四角形で表示されます。 Oberis は非常に使いやすいです。 これを MetaTrader 4 にインストールし、取引したい通貨ペアまたは資産のチャートに適用するだけです。 Oberis は、あらゆる時間枠とあらゆるチャート

カスタマイズ可能な設定 MACD インジケータ - 完全にカスタマイズ可能 3 つの移動平均 - 完全にカスタマイズ可能 モメンタム - 完全にカスタマイズ可能 1. 主なパラメータ 1.1 ロング / ショートオーダーの 2 つの注文コメント 1.2 2 つのユニークなマジックナンバー。ロング / ショート用 1.3 最大許容スプレッド 1.4 最大許容スリッページ 1.5 この EA 内で使用されるすべての指標は完全にカスタマイズ可能です 1.6 ブローカーの数字の確認 / 定義 1.7 完全に自動化された EA として使用するか、取引を行う場所を示すインジケーターとして使用します 1.8 注文実行を含むメールを送信する 1.9 携帯電話にテキストを送信します 1.10 注文 / 実行時に音を鳴らす 1.11 エラー発生時の再試行回数 1.12 買い / 売り注文を識別するための色を定義する 1.13 ポップアップメッセージボックスのアラートをオン / オフにします ( すべてのメモは [ ジャーナル ] タブに印刷されます ) 1.14 ヘッジに使用されているかどうかを定義します
Expert advisor places buy stop and sell stop at certain distance above and below current price. Also expert advisor uses standard trailing stop, breakeven of orders. Below is description of some inputs. Trade – option of moment for placing of orders (“Time” – placing of orders at certain time, “Candle” – placing of orders since certain candles count after last order closing or deleting) Candle – candles count after last order closing or deleting Time 1,2,3 – time for placing of orders Lot

Winfinity Robot is a fully automatic Expert Advisor. It is designed for EURUSD on H1 Timeframe and it uses different strategies to minimize the drawdown. It uses a great volatility algorithm in order to avoid to trade during high volatility. Using this algorithm, the expert advisor is able to get a high-rate of winning trades.
!!! The robot has a smart algorithm to open and close the orders, our recommendation is to not intervene with other scripts or manual over the orders. The Expert was
Expert advisor trades by pivot levels, support and resistance levels based on pivot levels. Also expert advisor takes into account volatility filter, uses standard Martingale and anti-Martingale systems, drawdown protection, standard trailing stop, trading time and trading Trade Order – direction of trading (only buy, only sell or buy and sell) Use Volatility Filter – enabling/disabling of volatility filter using Volatility Filter – value of volatility filter Count Of Days For Volatility Filter

スーパースターMT 4は、MetaTrader 4プラットフォームのために開発された専門家コンサルタント(EA)であり、トレーダーが金や通貨の取引活動を行うのを支援することを目的としている。EAは先進的なアルゴリズムを用いて市場データを分析し、取引機会を識別するとともに、リアルタイム取引信号と自動取引機能を提供する。スーパースターMT 4は金や通貨取引のために設計され、一連の技術指標と価格トレンド分析を利用して取引信号を生成している。トレーダーは、EAを使用してトランザクションを自動的に実行するか、手動トランザクション決定を信号で通知することができます。総じて言えば、金や通貨取引戦略を最適化し、この利益の多い市場で成功する機会を増やしたいトレーダーにとって、スーパースターMT 4は強力なツールです。
ほとんどの通貨ペアが使用可能:XAUシリーズ(XAUSD)EURシリーズ(EURUSD)GBPシリーズ(GBPSD)CADシリーズ(USDCAD)AUDシリーズ(AUDSD)
実体ディスクを発行する前に、特定の通貨ペアをシミュレーションしてテストしてください
周期M 15:1通

Note: After installation, please go to Tools>Options>Expert Advisors and add https://porsaj.com to 'Allow WebRequest for listed URL'. Still Problem?! Please check Internet connection!
An economic calendar in the context of forex refers to a tool or resource that provides information about upcoming economic events, indicators, and data releases that can potentially impact the financial markets, particularly the foreign exchange market. It helps traders stay informed about key economic announ
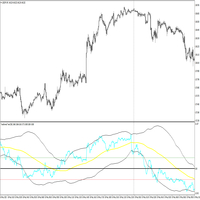
The indicator has been designed to function on any time-frame and any pair, although it is best suited for 5-minute charts. This price transformation will help the trader better evaluate whether the current market is trending, and in which direction. A dynamic filter has been added to help the trader avoid possibly entering against the trend. Two filter threshold lines may enable the trader to avoid choppy or flat market conditions. The Yellow indicator line is the filter and the Blue indica
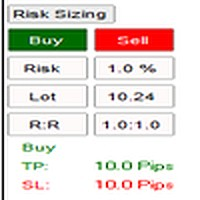
The indicator has been designed to function on any time-frame and any pair. The user is able to input their desired risk percentage per trade based on their account size, and choose whether they wish to calculate risk based on a limit order or market order. When initialised, a non-invasive button will appear on the left-hand side of the chart. Upon selection, a drop down will appear with a Buy and Sell button, these will in turn place movable lines on the chart that are used to appropriately

Geolot EA is an automated trading approach that utilizes a logic of money management and a lot size sequence to operate in the foreign exchange market (Forex), specifically in the EUR/USD currency pair. Here's a description of how the Geolot strategy works:
1. Money Management: Geolot strategy employs specific money management principles to operate with an initial capital of 1.500 euros. This management determines the amount of capital to risk in each trade, based on the distance between posi

「 Professional Manager Trader 」をご紹介します。- トレーディング体験を向上させるために設計された強力なツールです。熟練したフルタイムトレーダーの専門知識に基づいて開発され、このトレーディングインターフェースは効果的に取引と資本を管理します。その戦略はブレイクアウトに基づいており、個別に開発された確認指標を組み込んでいます。これらは成功の実績を持っています。 リスクと資金管理に重点を置いた「 Professional Manager Trader 」は、成功するトレーディングの鍵を握っています。それは抜群のリスク管理と厳格なポジションサイズを持ちながら、予測できない外国為替市場を航海し、資本を守り、下降リスクを制限します。 当社の革新的なトレーディングインターフェースは市場サイクルに先んじており、金融市場の絶え間ない変化にシームレスに適応します。幅広い研究と高度なアルゴリズム分析によって作成されたこのインターフェースは、信頼性のあるトレーディングソリューションを提供します。 パフォーマンスを示すために、私たちはトレーディングインターフェースが数ヶ月間成功裏
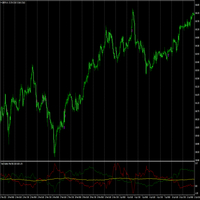
The indicator has been designed to function on any time-frame and any pair, although it is best suited for currency pairs on 5-minute charts, and used in conjunction with the Trend Direction Filter Indicator . This trend volatility filter will help the trader better evaluate whether the current market is trending, and in which direction. A dynamic filter threshold has been added to help the trader avoid choppy market conditions, and add greater confidence when entering, with an added functiona
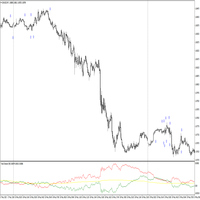
The indicator has been designed to function on any time-frame and any pair, although it is best suited for 5-minute charts. This trend filter will help the trader better evaluate whether the current market is trending, and in which direction. A dynamic filter threshold has been added to help the trader avoid choppy market conditions, and add greater confidence when entering, with an added functionality of plotting signal arrows on the chart to aid in detecting possibly entries. The Yellow in
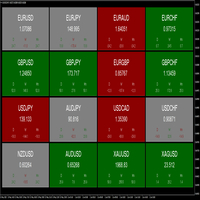
The dashboard indicator has been designed to quickly show the trader the price movements of various currency pairs. The user is able to select 3 different timeframes to analyse. When the pip difference for each respective timeframe is either positive or negative, the pair block will be coloured green or red respectively. This allows the trader to view which timeframes are in agreement, as well as the pip movements therein. A good visual tool to view multiple pairs and timeframes at once. T

The indicator has been designed to function on any time-frame and any pair. This regime filter will help the trader better evaluate whether the current market is trending, and in which direction. It quickly reacts to changes in market dynamics using a series of advanced calculations. The user is able to select whether the calculation remains standard, or if a further filter constraint is added to the calculation. A Yellow moving average of the signal has been included for the trader to smoot

Indicator show best signals for buy and sell orders. Indicator uses only 2 inputs: PEMA Bounce Period - bounce percentage exponential moving average period PEMA Confirm Period - confirm percentage exponential moving average period Positions of price according to bounce and confirm percentage exponential moving averages and directions of bounce and confirm percentage exponential moving average shows buy and sell signals, which are drawn as green and magenta arrows respectively.

Indicator show best signals for buy and sell orders. Indicator uses only 3 inputs: DEMA Fast Period - fast double exponential moving average period DEMA Slow Period - slow double exponential moving average period DEMA Trend Period - trend double exponential moving average period
Position of price according to trend double double exponential moving average and crossings of fast and slow double double exponential moving averages shows buy and sell signals, which are drawn as gree

Indicator show best signals for buy and sell orders. Indicator uses only 2 inputs: DEMA Fast Period - fast double exponential moving average period DEMA Slow Period - slow double exponential moving average period Crossings of fast and slow double double exponential moving averages shows buy and sell signals, which are drawn as green and magenta arrows respectively.

Pips 外国為替はすぐに使える取引システムです。 このインジケーターは、いつ、どの方向で注文をオープンする必要があるかをチャート上の矢印で示します。 矢印が緑の場合は買い取引をオープンし、矢印が赤の場合は売り取引をオープンします。 すべてが非常にシンプルで非常に効果的です。 テイクプロフィットは15~25ポイントを設定。 ストップロスはポイントレベルで設定されます。 ドットが移動すると、すぐに StopLoss をオーバーライドします。 M1 と M5 の取引に推奨される時間枠。 これはスキャルピング戦略であり、最小の時間枠で最も効果的です。 通貨ペアは任意です。 推奨される通貨のうち、GBPUSD、EURUSD、XAUUSD、USDCHF を提供できます。 設定はデフォルトのままにすることができます。 この戦略を使用すると、毎日 10 ~ 20 件の取引を開始できます。
Pips 外国為替インジケーターの利点: これは、あらゆる通貨ペアに対応する既成の取引戦略です。 これは最小の時間枠 M1 および M5 で取引するためのスキャルピング取引戦略です。 この戦略は非常にシンプル

The Chaikin Oscillator is a technical indicator developed by Marc Chaikin that combines price and volume data to measure the accumulation and distribution of a financial instrument. It aims to identify potential buying and selling opportunities in the market. The Chaikin Oscillator is calculated by subtracting a 10-day exponential moving average of the Accumulation Distribution Line (ADL) from a 3-day exponential moving average of the ADL. Here's how to use the Chaikin Oscillator indicator in tr

The Time Segmented Volume (TSV) is a technical indicator that measures the volume of a financial instrument within specific time segments. It helps traders identify buying and selling pressure based on volume analysis. The TSV indicator can be used as part of a trading strategy to generate trade signals and confirm market trends. Let's explore how to use the TSV indicator as a trading strategy. To begin, add the TSV indicator to your trading platform. The TSV is typically represented as a line o
The "Wilder's Average True Range (ATR)" tool is used to measure the volatility of a financial instrument. It was developed by J. Welles Wilder Jr. and is commonly used by traders to assess the potential price range and volatility of an asset. The ATR indicator provides valuable information for setting stop loss levels, determining position sizes, and identifying potential breakouts. Here's how to use the "Wilder's Average True Range (ATR)" tool: Install the indicator: Add the ATR indicator to yo

If you have been anywhere near Forex forums or social media lately, you have no doubt been hearing people talk about Smart Money Concepts (SMC) trading. You may be wondering what SMC is, and whether it deserves all the hype. In this post, we will introduce Smart Money Concepts trading to you so you can make an informed decision about whether or not to give this strategy a try in your own trading. What is SMC Forex trading? Smart Money Concepts (SMC) is one of many forex trading methods. SMC
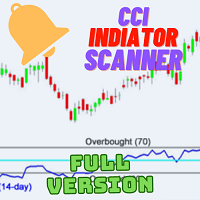
Welcome to the world of advanced trading with the CCI Multicurrency Scanner! Elevate your trading experience with our powerful MT4 indicator designed for seamless analysis and real-time insights. Key Features: Effortless CCI Scanning: Unlock the full potential of the CCI Multicurrency Scanner by effortlessly scanning multiple currency pairs. Receive instant alerts when specific Commodity Channel Index (CCI) conditions are met, ensuring you stay ahead of market movements. Comprehensive Dashboard
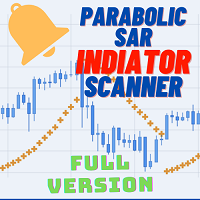
Welcome to the world of advanced trading with the Parabolic SAR Scanner Full! Maximize your trading experience with our powerful MT4 indicator designed for seamless analysis and real-time insights. Key Features: Effortless Parabolic SAR Scanning: Unlock the full potential of the Parabolic SAR Scanner Full by effortlessly scanning multiple currency pairs. Receive instant alerts when specific Parabolic SAR conditions are met, ensuring you stay ahead of market movements. Comprehensive Dashboard In

Are you ready to take your trading game to new heights? Introducing Quantum Fx, the ultimate Expert Advisor designed to enhance your trading strategy and maximize your profit potential in the forex market. In this groundbreaking video, we unveil the remarkable features and benefits of Quantum Fx, empowering you to trade with confidence and precision. Whether you're a novice trader or an experienced investor, this EA is tailored to cater to your unique trading goals. Key Features of Quantum Fx: A

Добрый день, Уважаемые трейдеры и инвесторы.
Вашему вниманию, советник основанный на мартингейле со встроенными индикаторами по RSI и ATR. Индикатор RSI может изменяться, тогда как ATR - нет. Советник использует динамический шаг, привязанный к показателям индикатора ATR, следовательно, с ростом волатильности, автоматически растет шаг и наоборот. Советник имеет уже подсчитанный коэффициент умножения лота в 1.45 и не требует корректировки, но в случае возникновения необходимости, это можно испр

Thanks to this indicator, you can easily see the new ABCD harmonic patterns in the chart.
If the two price action lengths are equal, the system will give you a signal when it reaches the specified level.
You can set the limits as you wish. For example, You can get the signal of the price, which occurs in the Fibonaci 38.2 and 88.6 retracements, and then moves for the same length, at the level you specify. For example, it will alarm you when the price reaches 80% as a percentage.
In vertic

Unleash the Power of Repetitive Market Price Levels (Markets often repeat structure ).
Are you tired of guessing the crucial support and resistance levels in your trading strategy? Do you want to enhance your decision-making process with reliable and accurate market insights? Look no further! We proudly present the interactive digital product designed to transform your trading experience – the Ultimate Support and Resistance Zones Indicator.
Unlock the Potential of Critically Watched Sup

"TOP G ARROWS" shows price reversal points designed for scalping and intraday trading.
Contains internal reversal filters (ATR, HHLL, RSI). Can be used on all time frames and trading instruments. Can be used on M1, M5, M15 time frames for scalping or M30, H1, H4 for intraday trading, Recommended for M30 and H1. The arrows are built on candle close (appears on previous bar at the open of the new candle)

Super Night Scalper is the advanced scalping system which utilizes smart entry/exit algorithms with sophisticated filtering methods to identify only the safest entry points during calm periods of the market. This system is focused on a long-term stable growth. It is a professional tool developed by me years ago that is constantly updated, incorporating all the latest innovations in the trading area. Nothing fancy here, no testing Holy Grails, no "risk-free martingale", only strict rule-b

It is designed to automatically set a stop loss for open trades in the MetaTrader 4 platform. Here is a breakdown of the important parts of the script: The script uses input parameters to control its behavior. The AutoSLTP_AllSymbols parameter determines whether to track trades on all symbols or only the current symbol. The AutoSLTP_Type parameter specifies the type of orders to track: 1 for market orders, 2 for pending orders, or 3 for both. The AutoSLTP_StopLoss parameter sets the stop loss v

Winshots Trade Assistant EA decides when to take the the first trade based on the H1 time frame and the Stochastic indicator. It is there to assist you in deciding in which direction you should trade as well as managing all the trades you open on the same chart (it's very useful in scalping on lower time frames). The first trade will always be 1 micro lot, and decision always based on the H1 time frame. Then your job is to open further trades in the same direction as top ups MANUALLY. However

Discover PM - Your Ultimate Precision Forex Indicator for Informed Trading Decisions! In the fast-paced and ever-changing world of Forex trading, having a reliable and accurate indicator can make all the difference between success and missed opportunities. Say hello to PM, the revolutionary Precision Momentum indicator, engineered to empower traders with unparalleled insights into market dynamics, volatility, and trends. At the heart of PM's power lies its ability to precisely identify moments
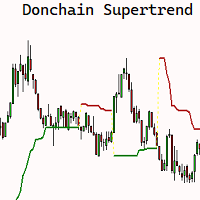
The SuperChannel indicator for MQL4 is a POWERFUL technical analysis tool designed to help you make informed trading decisions. BASED ON the popular SUPERTREND indicator, this indicator offers a UNIQUE approach Using HIGHS and LOWS over an n-period instead of the Average True Range (ATR) to construct the line. The SuperChannel indicator allows you to easily identify market trends and pinpoint optimal entry and exit points for your trades. By using historical highs and lows, the indicator plots a
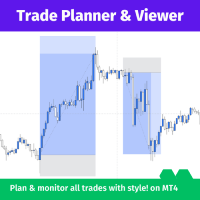
Trade Planner and Viewerは、効果的に取引を計画し監視するための強力で多機能なMetaTraderツールです。以下のような多数の機能を提供し、どんなトレーダーにとっても不可欠なツールとなっています。
リスク分析:Trade Planner and Viewerは各取引のリスク比率を計算し、ポジションに入る前に潜在的なリスクとリターンを評価することができます。
取引追跡:このツールは、トリガーされた取引のユーザーフレンドリーな表示を提供し、オープンポジションのパフォーマンスを追跡することが容易です。
ビジュアルカスタマイズ:Trade Planner and Viewerは、取引スタイルやカラースキームに合わせてカスタマイズすることができ、視覚的に魅力的で機能的な取引環境を作り上げることができます。
柔軟性:Trade Planner and Viewerは、ライブ、オフライン、またはバックテストチャートと組み合わせて使用することができます。この柔軟性により、さまざまな状況や目的でこのツールを使用することができます。
総じて、Trade Pla
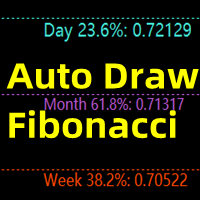
This indicator is mainly used to analyze future support and resistance levels for better trade analysis.
If the support level is effectively supported for many times, the market will break through the previous high point, and the effective trend breakout will be long.
After the down, the market cannot overshoot the pressure level for many times, and then goes down and breaks through the previous low price again, and the effective trend breaks through the short position.
When the marke

ロボットは、ボリンジャーバンド指標のラインをブレイクする取引戦略を使用します。 この戦略の本質は、インジケーターラインの継続的な分析と、そのラインの最も効果的なブレイクアウトポイントの検索にあります。 価格がいずれかの方向で指標線を突破すると、ロボットはその方向で取引を開始し、それに追従し始めますが、ロボットは指標線が突破されるたびに取引を開始するわけではなく、指標線が突破された場所でのみ取引を開始しますそれが最も効果的であると考えられます。 これは、世界中の何千人ものトレーダーによって長年にわたってテストされてきた、非常に信頼できる戦略です。 これは、GPTchat が学習のために提供する実用的なスキャルピング戦略の 1 つです。 人工知能は、これが M5 時間枠で最も効果的な取引スキャルピング戦略の 1 つであると信じています。 私たちは人工知能にも同意し、この戦略の実際の有効性を確認します。
ロボットの利点: マーチンゲールは使用しません。 ロットサイズはトレーダーが設定で指定します。 残高が10%増加するごとにロットが10%増加します ロボットは適応型リスク管理機能を

取引の意思決定を強化するために設計された強力なツールである、MT4 用の ハル クロスオーバー アラート インジケーターをご紹介します。このインジケーターは ハル移動平均 (HMA) を利用し、誤ったシグナルをフィルターして迅速かつ信頼性の高いアラートを提供する高度な機能を組み込んでいます。
ハル クロスオーバー アラート インジケーターを使用すると、ハル移動平均の固有の特性から恩恵を受けることができます。価格の変化に対する応答性と滑らかな曲線により、潜在的なトレンドの変化や市場の反転をより正確に特定することができます。
当社の包括的なアラート システムにより常に最新情報を入手し、取引機会を逃すことはありません。このインジケーターは、ポップアップ、モバイル、電子メール、サウンドのアラートを提供し、どのデバイスでも即座に通知を受け取ることができます。市場をアクティブに監視している場合でも、外出先でも、接続を維持し、潜在的な取引機会に迅速に行動できます。
ハルクロスオーバーアラートインジケーターは、多用途で取引スタイルに適応できるように設計されています。さまざまな時

Note: After installation, please go to Tools>Options>Expert Advisors and add https://porsaj.com to 'Allow WebRequest for listed URL'. Still Problem?! Please check Internet connection!
Sentiment is a vital gauge that provides traders and investors with valuable insights into their perceptions of the market and the broader economy. It serves as a reflection of their collective outlook, emotions, and expectations regarding future price movements and economic conditions. Porsaj is a powerful pl

Tendenceris - MT4 トレンドインジケーター Tendenceris - トレードスキルを向上させましょう! この素晴らしいMetaTrader 4インジケーターを使用すると、リアルタイムで様々な時間枠でのトレンドを表示できます。取引のチャンスを逃さずにください! 主な機能: 1分から1日までの様々な時間枠でのトレンドを検出・表示します。 チャート上でトレンド情報を明確かつ直感的に表示する、使いやすいインターフェースです。 リアルタイムで更新され、最新のトレンド変動情報を提供します。 さまざまな金融商品に対応しています。 個人の好みやトレード戦略に合わせてカスタマイズ可能な設定が可能です。 主な利点: 重要なトレンドに基づいたスマートな取引決定を可能にします。 さまざまな時間枠のトレンドを包括的に把握することで、時間と労力を節約します。 正確でリアルタイムな情報に基づいて取引に対する信頼性を高めます。 最も強力で持続的なトレンドに基づいて取引戦略を最適化します。 トレンドに逆行する取引を避け、利益を最大化します。 取引のチャンスを逃さずにください!Tendencerisを

Introducing MAGNETO, the expert advisor designed to magnetize your trading success. Get ready to unleash the power of this cutting-edge trading robot and take your trading to a whole new level.
MAGNETO is not your ordinary expert advisor. It's a state-of-the-art trading system that combines breakthrough technology, advanced money management strategies, and probabilistic analysis to deliver exceptional results. Tested rigorously on real accounts, MAGNETO boasts an impressive risk-to-reward rat
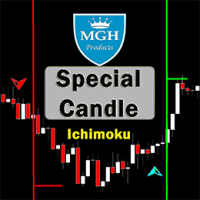
スペシャルキャンドル
成功した一目均衡表戦略を持つ最高の外国為替指標の1つを使いたいですか?この一目均衡表戦略に基づく素晴らしいインジケーターを利用できます。
MT5バージョンはこちらです 。
第1戦略:
この戦略では、まれに発生する類似した強いクロスを特定することが含まれます。
この戦略に最適な時間枠は、30分(30M)および1時間(H1)です。
30分間隔の適切なシンボルには以下が含まれます:
• CAD/JPY
• CHF/JPY
• USD/JPY
• NZD/JPY
• AUD/JPY
• EUR/USD
• EUR/GBP
1時間のタイムフレームに適したシンボルには以下が含まれます:
• GBP/USD
• GBP/NZD
• GBP/AUD
• USD/CAD
• USD/CHF
• USD/JPY
• EUR/AUD
第2戦略:
この戦略では、トレンドと同じ方向に発生した強力なTenkunsenおよびKijunsenのクロスを特定することが含まれます。
この戦略に最適な時間枠は、1分(1M)から15分(15M)です
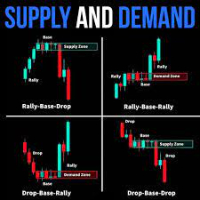
indicators included supply and demand indicator Specification Buy trade A SUPPORT zone (or immediately forms above the support zone) if the candle sticks are below either the middle or the lower band NO BUY TRADE IN THE RESISTANCE ZONE (RED HIGHLIGHTED ZONE), Sell trade A RESISTANCE zone (or immediately forms below the resistance zone) if the candle sticks are above either the middle or the upper band NO SELL TRADE IN THE SUPPORT ZONE (GREEN HIGHLIGHTED ZONE), In the supply zone, the prices are

Introducing the Donchian Channels indicator for MQL4, a powerful technical analysis tool designed to boost your trading success. This indicator consists of four lines that represent the upper and lower boundaries of price movement over a specified period. With the Donchian Channels indicator, you can easily identify potential breakouts and reversals in the market. The upper line shows the highest high of the specified period, while the lower line represents the lowest low. The space between thes

*This is tradingview bot converted to mql4*
The UT Bot Alert Indicator is an advanced technical analysis tool designed to help traders optimize their trading performance. This innovative indicator is based on the proven UT Bot system, which utilizes multiple indicators to deliver accurate signals that can help traders make better decisions. The UT Bot Alert Indicator provides a range of features that can help you stay on top of market trends and capitalize on opportunities. Here are some of i
The Change Chart Timeframe EA is a powerful tool that provides users with the ability to effortlessly modify and customize chart timeframes according to their trading strategies and personal preferences. You can select individual charts to modify or apply changes to all charts simultaneously, saving valuable time and effort. This EA is just a tool to help with your auto trading. It doesn't open any trades, so nothing happens if you backtest it.
Parameters Working hour setting Start hour:

TrendLines Plator: トレンド予測の高度なインジケーターでトレード戦略を最大限に活用しましょう 当社の革新的なインジケーターのポテンシャルを探索しましょう!より広範な時間枠のトレンドラインを直接現在の時間枠に分析・予測できるこのインジケーターは、一般のトレーダーの注目を集める戦略的なサポートを提供します。これらのポイントは、取引において重要なサポートまたはレジスタンスのレベルに変わり、あなたのトレード戦略を強化します。 Price Actionのインジケーターの選択肢にうまく統合することができるこの革新的なインジケーターをイメージしてみてください。ご試用いただき、その精度に驚かれることでしょう。戦略を改善し、成果を向上させるための必須要素になるかもしれません。 この機会を見逃さないでください!ぜひ今すぐこの素晴らしいツールをトレードリソースに取り入れるチャンスをお見逃しなく。その価値とポテンシャルに気づいた場合は、迷わずに今日手に入れて、トレードの正確性を高め、新たな成功の領域に到達しましょう。 最新情報をいち早くご覧ください 当社の独占的なリリース情報を受け取るために
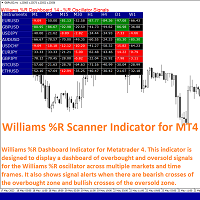
Williams R Scanner Indicator is a technical tool for Metatrader 4 designed to display a simple dashboard showing the values of the Williams %R oscillator across multiple markets and time frames of the trader's choosing. The dashboard also shows when the Williams %R indicator reaches an overbought or oversold condition which may precede market reversals.
The trader also has the option of viewing signal alerts on the platform that indicate when the Williams %R has made a bullish or bearish cros

Lot & Loss Calculator es una herramienta que te ayuda a abrir operaciones en el mercado y te brinda cierta información, entre ellas se encuentran: Permite conocer los posibles beneficios y perdidas de la operación en dependencia del lot asignado, el SL y TP. Permite establecer una perdida fija en dinero y dado un SL se encarga de calcular el lot que debe usar en la operación. Permite una vez configurado los parámetros de la operación colocar la operación en el mercado.

操作技术,资金管理,风险管理是交易系统三大要素,其中风险管理是交易中可以说是最重要的一部分,想要在市场上赚钱,首先要先活下来,要先活下来就要先做好风险管控。 相信做交易的朋友都会遇到风险管理的问题: 1. 不设置止损,亏了继续硬抗,如遇到单边行情,亏损便会大幅扩大,甚至爆仓。 2. 亏了一定资金后,开始着急想快点赚回来,开始重仓 或者频繁操作 ,结果亏得更多。 3. 赚了一定资金后,信心开始膨胀, 忘记做单规则 ,开始加仓操作,结果回吐利润。
这也是作者曾经经历的,所以把这些痛点总结出来做成工具,希望能帮助到大家。如果你是超级自律的人,能按照既定的系统规则交易,也能严格做好风控,也许不适合你,但 如果你正在经受这样的痛苦和懊恼,不妨试试这款工具,也许能帮助到你。
该工具具备以下功能: 1. 控制总资金回撤,当达到设定回撤时,会关闭所有持仓,并禁止开仓交易。 2. 当日资金回撤比例控制,对于日内交易者,可以帮助做好当天的资金回撤控制。 3. 当日资金盈利达到一定比例后可限制进行交易,以免头脑过热,回吐利润。 4. 下单仓位控制,可按照设置值来控制总的持仓大小。 5. 交易品种
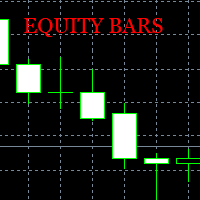
Equity charts generator creates an offline chart that draws bars corresponding to the account Equity value. The TimeFrame of the Equity chart is the same as the TimeFrame of the chart where the indicator will be placed. Input Parameters: Offline Timeframe - You can select the timeframe in minutes of the generated chart. Use opened file for adding new bars (true/false) - If set to false, a new history file is always created and bars will start drawing from the moment the indicator is placed on t

Are you tired of the uncertainty that arises when your orders fail to stop at a specific line due to the spread? Look no further! Introducing our indicator that plots candlesticks based on the Ask price instead of the traditional bid-based chart commonly used in MQL4. With this indicator, you can say goodbye to the frustrations caused by the bid-based chart, as it provides you with a more accurate representation of market movements. By utilizing the Ask price, which represents the price at whic
El sistema IBT-F.VOLUME hace uso de dos indicadores, el DeltaIBT y el indicador Fuerza Volumen para operar diversos activos en M5. El indicador Delta mide la diferencia entre compradores y vendedores, dando un valor cuantitativo de la agresividad de los compradores y vendedores. En la plataforma MetaTrader4, el Instituto de Inversiones Bursátiles y Trading ha desarrollado el indicador DeltaIBT. Por otra parte, se utiliza el indicador Fuerza Volumen. El indicador FuerzaVolumen nos permite medir
Secret AI has a multiple mathematical strategy combined into one Automated Trading System. Hence this EA was able to HUNT , EXECUTE and EXIT Trades. Secret do not use a very risky strategy such as MARTINGALE , HEDGING or GRID . Secret AI risk is only 3% to 5% per trade depends on the stop loss setup. Secret AI can be used into multiple major currency pair like EUR/USD , GBP/USD and USD/JPY. CURRENCY PAIR RECCOMMENDATION: EUR/USD, H4 (hour 4 timeframe) GBP/USD, H4 (hour 4 timeframe) USD/J

The "AI Forecast" indicator is the result of a unique experiment in which I asked an AI how to create the best indicator to anticipate the market. The AI suggested measuring the past history of the price and its reactions to different levels, and then calculating the probabilities of the price reaction in the future.
With this idea, I designed with the help of another AI the "AI Forecast" indicator, which adapts to any MetaTrader chart and shows you three lines: one for entry and two for poss

INTRODUCTION There is so many trading strategies, but each pair have different characteristic. For example, EURUSD characteristic is zone to zone, break and retest, and so many sideways. GBPUSD seems like same with EURUSD, but have much spikes and larger range. XAUUSD also have same zone to zone, but with very long range between zone, breakout without retest, following trend strategies is much safe for XAUUSD. JPY pairs such as USDJPY, EURJPY, GBPJPY have much trend rather than sideways. And man

GOLD H1 Simple Martingale that works on daily swing levels, medium DD, TP and SL defined on the basis of certain pre-set calculations in the algorithm, executes one trade at a time, weekly trading no overnight on weekends, possibility to establish customized exit times, possibility of customize money management. average return of 30.43% per year with the factory settings of the V1, it is always constantly updated, it is recommended to use it with a GMT +2 server TESTED SINCE 2008 It's recommend

Lucky Beauty mt4 は、あなたを楽しく驚かせるエキスパートアドバイザーです。アドバイザーの作業は完全に自動化されており、人間の介入は必要ありません。無料のデモ版をダウンロードし、履歴データで Expert Advisor をテストして、その効果を自分の目で確認してください。 Lucky Beauty mt4 Expert Advisor は、当社のスペシャリストによって Expert Advisor に組み込まれたアルゴリズムに基づいて、過去の期間の市場を分析し、市場への可能なエントリーポイントの数学的期待を決定します。取引注文をオープンした後、アドバイザーは市場の状態を監視し、取引が利益を生む場合にのみ注文をクローズします。アドバイザーが使用する市場のテクニカル分析により、収益性の高い取引が可能になります。 顧問の仕事は世界のニュースに影響されません。 EA は動作中にエラーを生成せず、その動作に意図的な制限はありません。 アドバイザをオンにすると、リスクのレベル (中、高、および非常に高) を選択できます。リスクが増加すると、利益も増加します。無料のデモ版をダウンロ
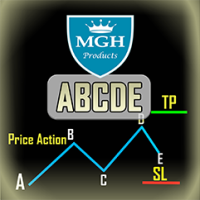
ABCDEインジケーター
このインジケーターは、価格アクションの主要なabcパターン(つまり、ブレイク、プルバック、ムーブメント)に基づいています。これらのパターンはラリーベースラリーパターンに似ており、トレンド分析やダイバージェンス分析などの一連の分析がチェックされ、正確なシグナルを発行します。それはかなり正確な取引シグナルを提供し、トレードを開始し、終了するのが最適なタイミングを伝えます。これは、外国為替、暗号通貨、金属、株式、指数など、どんな金融資産にも適用できます。
主な特徴:
• 非常に使いやすい
• マルチタイムフレームアラート
• 固定価格でストップロスとテイクプロフィットのオーダーが可能。
• どんな取引インストゥルメントとも連携可能(Forex、CFD、Futures その他)
• メール通知
• 電話通知
• かなり正確なトレードシグナルを提供し、いつトレードを開始・終了するのが最適かを教えてくれます。
• オープニングライン、ストップロス、テイクプロフィットをグラフ上に表示します。

The TAILOR EA is an advanced automated trading system designed specifically for the MQL market. This bot monitors the CHOCH price (character change) and market trends to place Buy Stop and Sell Stop orders in a secure and efficient manner. It offers a multitude of safety features, ensuring a smooth and reliable trading experience. Live Signal Start June 2022
Key Features :
1 : Smart Stop: The bot intelligently places stop orders to minimize losses and protect your investments.
2 : Limit

Introducing Ranger ADX Expert Advisor: The Ultimate RSI Trend-Following Solution
Are you in search of a reliable and robust Expert Advisor (EA) that harnesses the power of RSI trend-following indicators? Look no further! We are proud to present Ranger ADX, an advanced EA developed based on a winning combination of the Relative Strength Index (RSI) and Moving Average (MA) indicators. With its exceptional capabilities, Ranger ADX offers a powerful solution for identifying and capitalizing on tre

Introducing RUSH, the ultimate trading robot designed to revolutionize your trading experience. Whether you're a seasoned trader or new to the market, RUSH empowers you to take control of your financial destiny with unrivaled precision and success.
Powered by state-of-the-art technology, RUSH utilizes advanced algorithms, cutting-edge money management strategies, and sophisticated probabilistic analysis. This powerful combination has been extensively tested on real accounts, consistently deli

こんにちは。私は2016年からFXトレードをしています。 これまでにも何度も自動売買ソフトを開発してきましたが、成績が振るわず販売には至りませんでした。 しかし今回、ようやく 公開しても良いと思えるレベルの自動売買ソフトが完成しました。
※提示しているのはバックテストをもとにした過去の運用成績であり、未来の利益を保証するものではありません
フォワード実績は こちら を参照してください。
MT4でのバックテスト結果は以下の通りです↓ 期間:2016/01/01-2023/04/30 最終損益: 478.46% プロフィットファクター:1.57 最大ドローダウン:15.56%
この自動売買ソフトは4つの通貨ペアに対応しており EUR/USD USD/JPY GBP/USD AUD/USD での利用を想定しています。
また、上記バックテスト結果は、この4つの通貨ペアで同時運用した場合のデータとなっています。 ※資金を約100万円からスタートさせ、それぞれの通貨ペアで1ロットで取引させた場合のデータです
ただし、EUR/USDの利益率がそんなに高くないため、それ

This Wonders Real Arrow indicator is designed for signal trading. This indicator generates trend signals.
It uses many algorithms and indicators to generate this signal. It tries to generate signals from the points with the highest trend potential.
This indicator is a complete trading product. This indicator does not need any additional indicators.
The indicator is never repainted. The point at which the signal is given does not change. When the signal comes the arrows are put back on

Urgent reminder> Only 13 copies remaining for the price to double on all renting options. Get your copy Today!
Introduction Dear Traders, I am always working to come up with tools that may help you to become a better trader and investor. Due to my experience in trading and market analysis and trading software design and development, I am glad to introduce to you my other tool called " Amazing Entries Indicator ". The Indicator is designed in a way that it combines different strategy to provide

*This is TradingView indicator converted to mql4*
The SuperTrend V indicator is a popular technical analysis tool used to identify trends and potential trend reversals in financial markets. It is based on the concept of the SuperTrend indicator but incorporates additional features and variations. The SuperTrend V indicator uses a combination of price action and volatility to determine the trend direction and generate trading signals. Here are the key components and features of the indicator:
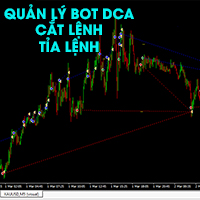
Bot chuyên quản lý và trị các thể loại DCA Kích hoạt bot theo level 1, level 2, level 3 Kích hoạt theo tiền hoặc theo % tài khoản tùy chọn Tất cả tự động Cắt tỉa lệnh theo cặp giúp hạ lot Đóng cắt lỗ thông minh Khóa lợi nhuận ngày Dùng lợi nhuận để đóng dần lệnh lỗ Giúp bot DCA về bờ sau 2-4 nhịp sideway Nhiều phương án đóng - cắt tỉa lệnh thông minh Phù hợp với tất cả các loại bot DCA, Martingel, Grid... Giúp không bay màu tài khoản Em chưa có thời gian viết kỹ tính năng. Mong mọi thông cảm. E

Ace Trading EA is a unique expert based on deep machine learning and hyperparameter search technology. In machine learning, an optimal model is generated to minimize the predefined loss function for given independent data. A secret advanced mathematical model that undergoes multiple optimization stages to control the market and correctly set stop loss orders based on market fluctuations. This allows for following the trend when it appears and exiting in a timely manner when the trend is likely

Need help managing your risk? Use Risk Helper
Drag this script onto your pair, enter your desired pip target, and open a trade. Once your pip target has been reached the Risk Helper will take partials profits, move the stop loss then double the profit target so it can do this process again on the next hit. A notification will be sent for every action the Risk Helper takes. Once the trade has been reduced to 0.01 lot size, Risk Helper will proceed to only move your stop loss for every pip ta
MetaTraderマーケットが取引戦略とテクニカル指標を販売するための最適な場所である理由をご存じですか?宣伝もソフトウェア保護も必要なく、支払いのトラブルもないことです。これらはすべて、MetaTraderマーケットで提供されます。
取引の機会を逃しています。
- 無料取引アプリ
- 8千を超えるシグナルをコピー
- 金融ニュースで金融マーケットを探索
新規登録
ログイン