YouTubeにあるマーケットチュートリアルビデオをご覧ください
ロボットや指標を購入する
仮想ホスティングで
EAを実行
EAを実行
ロボットや指標を購入前にテストする
マーケットで収入を得る
販売のためにプロダクトをプレゼンテーションする方法
MetaTrader 4のための新しいエキスパートアドバイザーとインディケータ - 187

Hello. Sales of the first 3 versions are offered with a 50% discount and then the price increases. The signals generated by this robot: https://www.mql5.com/en/signals/1028072?source=Site+Profile Recommended broker for ProEA This robot is the result of my many years of experience in the field of financial data and programming. Pairs of currencies that can work with this robot: XAUUSD, GBPUSD, NZDUSD, AUDJPY, EURUSD, AUDUSD, USDCHF, EURGBP, GBPJPY. Of course, gold is not recommended for low capit
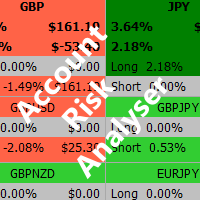
Account Risk Analyser, allows you to keep track of your account risk, risk exposure to individual pairs and risk on base currency pairs. Get notified when your risk on a base currency pair exceed a predetermined risk level. Get notified when your account exceed a predetermined risk level. Risk Analyser based on the NNFX methodology of not over leveraging on any base pairs. Parameter inputs Percentage risk trigger for Trade instruments Percentage risk trigger for Account Alerts Chart Alert Mail A
Magic Panel for MT4 is a Menu based Trading Panel. with the help of Magic Panel traders will be able to access various trading tools right from Menu Panel in MetaTrader Chart. All tools are one click to activate and another click to deactivate its that simple. Current version of Magic Panel comes with. - Trend Scanner. - Five in One Pivot Point. - Currency Strength Meter. - Multi Symbol Heat Map Scanner. - Auto Trend Line. - Symbol Search Box. - Symbols Dropdown Menu. - One click object Clear

Search for an entry with low risk for trading by Lisek Waves Indicator. Using Lisek Waves Indicator can improve your trading performance. In it’s simplest form, this trading tool make it easy to s earch for an entry with low risk and to manage your trade and risk. Lisek Wave analysis is based on the notion that markets follow specific patterns called waves which are the result of a natural rhythm of crowd psychology that exists in all markets. You can avoid the loss from taking trades that are
FREE

Heikin-Ashi-Sniper is a perfect addition to your portfolio. It is meant to be traded on EURUSD on H1 Timeframe.
It uses Heikin-Ashi High and Low/High of Monthly timeframe to determine optimal entry signals while having a reasonably low drawdown More EA´s will be published shortly to complete the Portfolio. The EA Trades not very frequently it waits for the right chance and places the order. The rest of the time, your capital is free to be traded on
other strategies Please see backtest results i
FREE

Super Trend Filter Indicator Super trend Arrow Consider as a Master Candle , If super trend in Buy signal , then signal candle calculate as master candle and master candle close above the open candle then calculate filter Buy Arrow. If super trend in Sell signal , then signal candle calculate master candle and master candle close below the open candle calculate filter Sell Arrow. 3 Target with Trailing Stop Loss

Genetic Code, is an indicator that differentiates two types of market: the market in range and the market with volatility.
This indicator allows the trader to choose whether to use a range trade or a volatility trade. You can download the demo and test it yourself.
When observing the trace of the indicator it shows us narrow areas that correspond to market ranges.
These ranges always end with a volatility process, so you can work with two conditional pending orders.
When the two DNA strands

DNA is an indicator that allows us to operate both in favor of a trend and a pullback. You can download the demo and test it yourself.
Trend trading is above zero and pullback trading is below zero.
The direction of the operation is marked by the color of the line.
If the line is green it corresponds to purchases.
If the line is red it corresponds to sales.
For example, if the green line is above zero and growing, we will have an uptrend operation. If the red line is above zero and growin

Fibo Extrem is robot ea with indicator Fibonacci. Order open BUY = if iOpen[0] > Pivot Point(PP). Order open SELL = if iOpen[0] < Pivot Point(PP). Strategy from this EA : Can use hedging(true/false),can use martingale(set 1=off),Target profit perday,takeprofit 4 step,stoploss 3 step,and more strategy. Hedging=false; ==> true/false EA_indicators=FIBONACCI; Use_MaxSpread=true; MaxSpread=50; ==> Maximal Spread MaxLot=1; ==> Maximal lot Target_profit_perday=50; ==> can work on forward test. lockpr

This EA will open buy or sell orders depending on any buffer indicator just but Buy buffer and sell buffer there is a lot of settings in EA like take profit stop loss trailing stop duration time auto lot double lot required profit dollars to close close it reverse
and more you can download demo version and try it back test
Good luck -------------------------------------------------------------- السلام عليكم هذا الاكسبيرت سيفتح شراء او بيع اعتمادًا على اي مؤشر بفر الاكسبيرت يحتوي على الكثير م

Preset in the first comment - GBPUSD - XAUUSD on M5 chart.
Megalith is an Expert Avisor that contains within it different types of trading, its particular formulas, dynamically detect supports and resistances, inserting pending orders or multiple pending orders in these specific points. This flexibility allows Megalith to be able to carry out level trading with price action, trend and scalping trades, with megalithic stability and solidity
The dynamic entry of pending orders on S and R mak
FREE

Check the Trend Power This indicator is designed to identify the POWER of trend. This is NOT define bullish or bearish trend. It is quite easy to look at the power when the indicator line turns Green the trend are strong when the indicator line turns Red the trend are Weak strategy for trade is : Open possition only when the power go Green Exit possition when the power change to Red
FREE

MDG REBORN It is a fully automatic, high precision breakout scalper born from the reworking and improvement of Million Dollar Guru, which runs on M1 chart.
By identifying areas of overbought and oversold over very short periods in combination with the ENVELOPES indicator and AVERAGE REGRESSION, this system allows for very high long-term returns that are difficult to compare with other types of scalping.
Furthermore, through a series of internal calculations on the speed and pressure of pri
FREE

EA Excess - автоматический советник использующий в качестве сигнала для входа сравнение волатильности нескольких периодов, и при определенном превышении ее значения открывает сделки, если дополнительные фильтры активированы и также находятся на нужных значениях. Советник имеет возможность настройки торговли в определенное время, и дополнительную возможность увеличения лотности ордера, или серии ордеров после убытков. ВАЖНО: обратите внимание на параметры GMT! Для того, чтобы получить корректны

The background trend is an indicator that helps us to know the trend that is dragging the market. The indicator has 2 possibilities: 1) If the indicator is above zero the trend is buying and the indicator will be green.
2) If the indicator is below zero, the trend is selling and the indicator will be red.
You can download the demo and test it yourself.
The indicator has a text help in the upper right corner, in which it shows whether the indicator has a bullish or bearish background trend.
This is a Semi-Automatic Martingale EA
It is Semi-Automatic because It waits for the first executed order available and then opens a grid of pending limit orders in the same direction of the first one The first order that we usually call the master trade can be opened manually or via any other EA, indipendent from this one There is a dedicated Telegram Group with use cases and best settings here , feel free to join and ask for a functional copy in demo accounts before buying

This robot EA with simple indicator ONE CANDLE, but this ea is equipped with various strategies, including: hedging technique (true / false), martingale technique (set 1 = off). also equipped with various filters, including: maxspread, maxlot, target profit per day, take profit with 4 layers, stop loss with 3 layers and many other strategies. Open order BUY = If iClose[1] > iOpen[1]. Open order SELL = If iClose[1] < iOpen[1]. EA_indicators=ONE CANDLE VERSION; Hedging=false; Use_MaxSpread=true;

The advantages of EA TWO CANDLE SMART are: It is equipped with various filters, including: maxspread, maxlot, takeprofit (4 step), stop loss (3 step), profit target per day, and many more. Open order BUY = If iClose[2] > iOpen[2] && iClose[1] > iOpen[1]. Open order SELL = If iClose[2] < iOpen[2] && iClose[1] < iOpen[1].
Target_profit_perday=50; ==> can work on forward test. lockprofit=2;//Minimal Profit in money Step_LockProfit_in_Money=25; Stoploss_in_Money=1000; Stoploss_in %=50;==> Stoploss
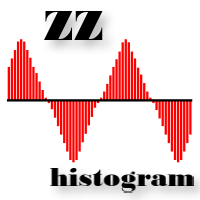
ZZ Histogram отображает длину и направление волны на ценовом графике. Минимальный размер волны задается в настройках. По своей сути данный индикатор - тот же зигзаг (можете скачать здесь ), который определяет ценовые волны не меньше определенной длины, но только в виде гистограммы. Это можно увидеть на скриншотах.
Для сбора статистики по размерам ценовых волн используйте идикатор Wave Size Stats .
ПАРАМЕТРЫ MinWaveSize: минимальная длина волны, на которую реагирует индикатор. Для маленьких
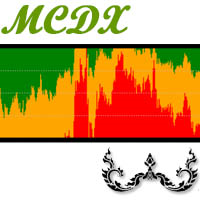
MCDX is an indicator based on specific formula to detect Buy and Sell momentum Red Bar means Price go up and Buy momentum. Green Bar means Price go down and Sell momentum" Height of RED bar > 50% means Bull is in control. i.e. RED more than GREEN to go buy. Lower of Green bar < 50% means Bear is in control. i.e. GREEN more than RED to go sell. DARKER RED COLOR - STRONG Up Trend or Strong Bullish Power
LIGHTER RED COLOR - WEAK Up Trend or Weak Bullish Power
LIGHTER GREEN COLOR - STRONG Down Tr

EA based on Trend and Support Resistance Levels option usage of Auto SL and AutoLot with variable risks results given on EURUSD H1 for last 2.5 years *** used parameters on H1 timeframe bars 25 shift 5 ma index 0.85 open OrdersTotal = 2 Profit Per = 3 % profit to Equity to close trades for lower time frames Inputs will me doubled or tripled ... for higher time frames inputs should me divided / minimized you can use manual entered Lot and Disable AUTOLOT Or you can enable Auto-Lot and

Индикатор AURUS Arrow предусматривает возможность выявления различных особенностей и закономерностей в динамике цен, которые не видны невооруженным глазом.
AURUS Arrow — индикатор, показывающий стрелки покупки-продажи, которые определенно помогут каждому трейдеру, который не знает как торговать.
На основании этой информации, трейдеры могут предположить дальнейшее движение цены и корректировать свои стратегии, соответственно.
Буферная стрелка покупки-продажи с сигнальным алертом.
Тайм-фрейм - л

GOLDTRON is a Trend Momentum Algorithm Expert Advisor, specializing on GOLD. It tries to only look for trades on safer periods of the day.
Extremely SIMPLE & EASY-TO-USE, with settings optimized at the backend already. Just set to your desired Risk level and go!
Most of the time, the trades will TP with 1 entry. Like a experienced human trader, It can utilize several grid averaging trades to gain a overall winning edge.
BACKTEST SETTINGS (make sure u have 90-99% tick quality from history cent

PinTouch indicator calculates and draws high-probability direction Entry points with arrows. Moving Averages are applied as the direction filter and visualised at the chart.
To identify Exit points is recommended to use one of these options:
1. The nearest levels calculated by the PivoZone Indicator under the link: https://www.mql5.com/en/market/product/57066
2. Reversal signal
3. Calculated by RR-ratio 4. Of course, your options (post me a message)
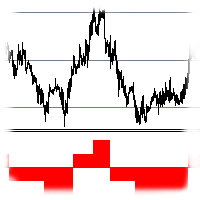
Индикатор показывает количество и направление переходов цены между уровнями сетки. Шаг сетки устанавливается в настройках. Индикатор будет особенно полезен трейдерам, торгующим по Мартингейлу, как инструмент для определения оптимальной точки входа.
ПАРАМЕТРЫ Step: размер шага сетки (например: step = 50, shift = 0, тогда уровни будут иметь значения ...1.1050, 1.1100, 1.1150...) Shift: сдвиг сетки (например: step = 50, shift = 25, тогда уровни будут иметь значения ...1.1075, 1.1125, 1.1175...)

EA RSI MODIF is robot expert advisor with indicator RSI,but this ea use more strategy. Open order BUY = If indicator RSI < Signal buy. Open order SELL = If indicator RSI > Signal sell. More Strategy from Ea RSI MODIF IS = Can use strategy hedging,martingale,lock profit,target profit perday (work on forward test),and many more of strategy. Parameters EA RSI MODIF = ==> Setting indicator RSI : RSI PERIOD = 14 . SIGNAL BUY = 30 .

Hello
This EA for send any indicator Signals (buffer) to your channel in Telegram with photo for chart also you can share your signals with your clients in your telegram please watch the photos
you must have Telegram channel then make bot and give it Permission and get token (watch this video to know how do it) https://www.youtube.com/watch?v=x1bKWFOjSBE
and you must download this files https://drive.google.com/file/d/1pYpnWUr4Kb4aIwdoGVD_9zSH1HWX-tt3/view?usp=sharing then unzip files then pu
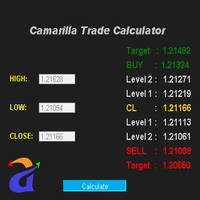
Advanced Camarilla Calculator is one of the most commonly used trading calculators. This calculator can be used to generate levels. Scenario 1 Open price is between H3 and L3 For Long - Wait for the price to go below L3 and then when it moves back above L3, buy. Stop loss will be when price moves below L4. Target1 - H1, Target2 - H2, Target3 - H3 For Short - Wait for the price to go above H3 and then when the price moves back below H3, sell. Stop loss will be when price moves above H4. Targe
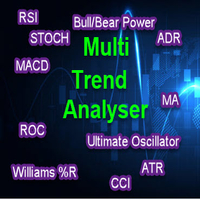
Multi Trend Analyzer MT4 indicator provides signals from the following technical trading indicators: RSI, STOCH, STOCHRSI, MACD, ADX, Williams % R, ATR, Oscillator, ROC and Bull/Bear Power. It supports all time frames, from the 1 minute up to the monthly charts. You can change all indicator inputs. Indicator provide total trend summary. We can easily analysis and study market movement .
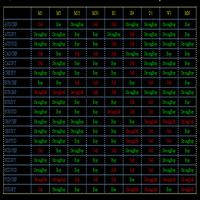
MACD MULTI TIME FRAME WITH MULTI SYMBOLS INDICATOR MACD MTF Indicator visualize all MT4 time frame and trend based on Moving Average Convergence Divergence (MACD) strategy . Indicator have settings for MACD customizing and variable "Symbols "EURUSD,USDCHG,...", which is used to define symbols. , Signals are displayed Buy , Strong buy , Sell, Strong Sell, ### - No Trend Strong Description The Moving Average Convergence/Divergence indicator is a momentum oscillator primarily used to tr
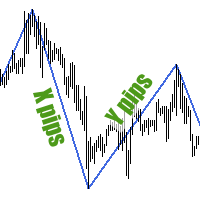
Зигзаг строится по ценовым волнам, размер которых не меньше заданного в настройках. Индикатор не способен нарисовать две вершины (максимум и минимум) на одной свече, поэтому для определения волн небольших размеров следует использовать меньшие таймфреймы графика. Зигзаг в виде гистограммы можете скачать здесь .
Для сбора статистики по размерам ценовых волн используйте идикатор Wave Size Stats .
ПАРАМЕТРЫ MinWaveSize: минимальный размер волны, на котором будет построено очередное плечо зигзаг

Cloud Stair is an Indicator has 2 Cloud (Up Trend and Down Trend). Cloud will turn Red when trend go down. Cloud will turn Blue when trend go up. You can use this indicator as a Support and Resistance level. Trend very strong when there are no opposite side. Open Buy position when the indicator show blue cloud and no red cloud. Open Sell position when the indicator show red cloud and no blue cloud.
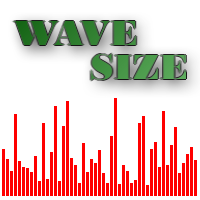
Гистограмма отображает длину ценовых волн, которые не меньше заданного размера. Индикатор наглядно показывает направление коротких/длинных ценовых движений и динамику волатильности. Также Wave Size Histogram подойдет для поиска закономерностей в ценовых движениях. Например, после крупной волны (большое значение гистограммы) зачастую идет слабое движение цены в противоположную сторону (небольшое значение гистограммы), которое идеально пододит для торговли по Мартингейлу.
Для сбора статистики по

Introducing High Fly - the Ultimate Trading Ace! This fully automated trading system is designed to elevate your trading game with its advanced algorithm and innovative features. High Fly utilizes a unique combination of technical analysis, artificial intelligence, and machine learning to provide traders with reliable and profitable trading signals. High Fly's powerful entry and exit logic operates solely on Bar Close, eliminating market noise, optimizing speed, and avoiding stop loss hunting,

Robot autotrading forex yang bekerja secara full otomatis menggunakan Strategi Scalping yang sangat profitable.Tidak menggunakan metode strategi yang berbahaya dalam trading yang menyebabkan hilangnya seluruh Deposit secara tajam seperti Hedging, Martingale, Grid, Arbitrage, dll. Kelebihan RainScalper adalah memiliki status Live Development yang berkesinambungan dalam jangka panjang berbeda dengan robot lain yang sering berganti nama ketika terjadi crash/mc; serta memiliki kemampuan multi-strate

Live Account Signal : https://www.mql5.com/en/signals/2229036
Set File Used : algosamurai_SR_V2 Algo Samurai Expert Advisor Algo Samurai is a complete automated forex trading strategy designed for all skill levels. It's more than just software; it's a fully automatic trading robot that uses self-adaptive market algorithms to analyze price movements and identify trading opportunities. It also features a built-in Smart Profit Lock System to secure your gains while the trade remains open, all wit
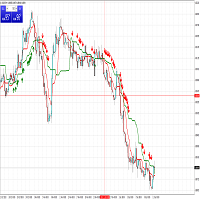
Two Advanced Moving Averages Are you looking for a indicator simple and effective? It will help you! Indicator use two MA to identify trends. User manual: If fast MA(red line) cross over slow MA (green line) and appear first signal buy arrow => you can long. If fast MA(red live) cross below slow MA (green line) and appear first signal sell arrow => you can short.
FREE
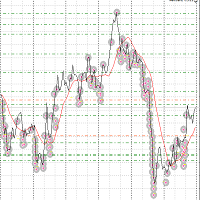
Добрый день. Рынок форекс он иррационален иначе бы на нем бы зарабатывали 95 % трейдеров. Но статистика говорит об обратном 95 % рейдеров сливают свои депозиты. Это факт. И нет ни одного индикатора, который бы предсказывал движение рынка немного заглядываю в будущее. Как только вам показалось, что вот он граальный индикатор или советник - ваш депозит начинает таять. Рынок обязательно накажет и вы потеряете если не весь свой депозит, но значительную его часть точно. Раз рынок форекс иррационал

Limited number of copies will be sold on MQL5 market. Price $69.99 4 of 10 left at this Price Next 10 copies $149.99. Expert will be available on sale untill 1 of January. Unbrekeable for XAUUSD is a fully automated EA designed to trade GOLD only. It is based on machine learning analysis and an incredible trend detection system. This EA tries to win 1% of the account in each of the trades!!!! works like magic :) EA contains self-adaptive market algorithm, which uses XAUUSD in 2015-2020
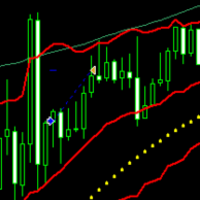
Аренда от 30$ в месяц. Сделка открывается на уровне, определяемом индикатором "полосы Болинджера", стоп лосс двигается по Параболику, т.е риск постоянно снижается. Тейк-профит - определенное количество пунктов. Рекомендую использовать советник на 15 минутном тайм-фрейме на паре EURUSD. В скрине приложен график доходности с января до декабря 2020 года с использованием Мартина. Мaртингейл рекомендую использовать только для разгона депозита. Так же возможно настраивать время начала и окончания то
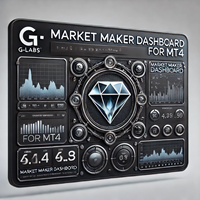
G-Labs Market Maker Dashboard - Exclusive Seasonal Offer Elevate your trading with the original G-Labs Market Maker Dashboard, available for a limited time at just $70 USD. Ideal for starter traders, this dashboard has been enhanced with new features and now includes a comprehensive training video. This indicator is for people trading the market makers method and is the entry level dashboard for that strategy is available for both mt4 and mt5. its a market scanner in real time showing peak

トレンドインジケーター 各時間枠のトレンドを決定するための独自のシステム、
すべての標準時間枠における通貨ペアのトレンドを実際に把握することができます。 緑の四角は買いトレンド、赤の四角は売りトレンドです。
取引テクニック: 小さな時間枠が古い時間枠のトレンドと逆の場合は、市場の動きの慣性により、スクリーンショットのように古い時間枠でエントリーします。
このインジケーターは、変更されたローソク足式を使用して、価格変動をより滑らかに表現します。 現在および過去の期間の始値、終値、高値、安値を平均します。 この変換によりノイズが軽減され、トレンドがより明確に把握できるようになります。
これは、合計インデックスの幅の分析と、MACD 計算とヒストグラムに基づく明確な視覚化および追加のトレンド情報を組み合わせた堅牢なインジケーターです。 カスタマイズ機能により、さまざまな指数や市場状況に適応させることができ、トレーダーにトレンドや勢いを分析するための包括的なツールを提供します。
FREE
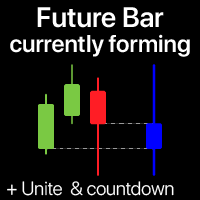
このインジケーターは、選択した時間軸で現在形成中のろうそく足を表示します 複数のバー を オプションで 1本のろうそく足に結合 できます:全体像を把握するのに役立ちます 多機能 ユーティリティ #1 : 65以上の機能、このインジケーターを含む | 質問はこちら まで | MT5版 入力設定で、将来のバーに使用する 時間軸 を選択してください: 現在価格の右側に、指定した間隔で形成中のバーが表示されます。 設定で有効にすると、選択したバーの終了までの カウントダウン が右下に表示されます。 役立つ場面: 複数の時間軸を使用する場合; 異なる期間から全体像を確認する場合; トレード設定の追加確認として; 色は手動で設定するか、自動検出(現在のテーマと同じ)できます。

究極の取引指標である Constant Grow を使用して、取引口座の一貫した成長の秘密を解き明かしましょう。 RVI シグナル、移動平均、出来高、ストキャスティクス、アリゲーターなどの高度な指標の組み合わせを利用したこの革新的なツールは、その有効性を確保するために 2 年間 (2021 ~ 2023 年) にわたって綿密にバックテストが行われています。
Constant Grow を使用すると、リスクを最小限に抑えながらアカウント残高を保護および拡大できるようになります。 当社の専門アドバイザーが資金管理のあらゆる側面を担当し、お客様が収益性の高い取引を行うことに集中できるようにします。 利用可能なポジションに固定ロットサイズを設定するだけで、残りの作業は GBPJPY H1 エキスパートにお任せください。
複雑な設定や推測を心配する必要はありません。 Constant Grow は、あらゆる通貨ペアとシームレスに連携し、独自の機能を活用して最大の収益性を実現するように設計されています。 トレーディング ゲームを強化し、比類のない成功を体験するこの機会をお見逃しなく。 Con
FREE

LordAutoTrendLineは、金融市場の上昇トレンドラインと下降トレンドラインを分析することを目的として開発されたMetaTrader用のインジケーターです。
トレンド ラインは、通貨ペアの高値と安値などをフィボナッチとともに計算するために使用されます。
H4 画像の例では、高値 1790 と安値 1784 を横切るラインが確認できます。たとえば、1784 を下回ることが売りを意味する場合、ラインによれば、ほとんど努力せずに最初に 1790 に到達することが非常に確実です。 、 購入。
2 番目の H1 画像では、同じことが、高値 1790 と安値 1782 であり、上記の例に従います。
LordAutoTrendLine インジケーターは、ペアの最大値と最小値、スプレッド、上昇トレンドと下降トレンドのチャネル、到達可能な毎日の上値または下値の最大値 (最大値) の以前の分析などの情報をグラフィック パネルに表示します。または通貨ペアがその日に到達する可能性のある最小値)。
愛情を込めて丁寧に作られています <3.
Telegram グループに参加する: http

The indicator is a tough Moving Average, weighted by many parameters. Accordingly, you need to trade according to the volatility of the chart. For convenience, moving averages of High, Low, Median ((High-Low) / 2) periods have been added to the indicator.
Input parameters:
IndicatorPeriod (green line): several periods (general-general, calculation for all periods; small- small period; medium- medium period; long- long period)
MaLine- indicator smoothing (Moving Average) (blue line).
PeriodH

This expert Advisor is primarily intended for dispersing small deposits. For example, in testing since 2017, the EA increased its balance from 100 $ to 6 514 361 $
The "Pand0ra EA" expert Advisor is perfect for the "EUR/GBP M30" pair. It uses only two indicators "Previous High Low" and "Top Bottom Price". Each trade is protected by a Stop Loss and Take Profit. In the parameters of the expert Advisor, you can change the percentage of the lot from the Deposit(by default, it is 5%) also,

The indicator represents 4 moving averages, shifted back. Created, like any moving average indicators, in order to see the approximate balance of volatility and the number of bulls and bears. The difference from other Moving Averages is that an attempt is made here to bring the moving averages of different periods to a common denominator, respectively, to bring the number of traders trading on different timeframes to a common denominator. The indicator is distributed as is.
MnojitelMA1, Mnojit
FREE

An indicator showing volumes with the addition of four moving averages of these volumes. What is this indicator for? When analyzing the Forex markets, metals, indices on the H1, H4 charts, at the beginning of the day and at the end of the trading day according to server time, the volumes are less than in the middle of the day. This indicator was created for this. It will help you compare trading volumes within the day. The indicator is distributed as is. Tags: Volume, Custom Volume, MA, Custom M
FREE

The indicator shows the trend change and how the market is changing. When calculating, many parameters are weighed. Therefore, divergence between the chart and the indicator is possible.
Input parameters:
IndicatorPeriod: several calculation periods (small - small period, medium - medium period, long - long period).
You can trade by divergence, analyzed on the resistance and support lines (and other types of graphical analysis), as part of other indicators. Tags: Stochastic, Trend.

Indicator formula: High-Low + Volume; Open-Close + Volume That is, an attempt to bring price and volume to a common denominator.
Input parameters:
IndicatorPeriod: several periods of calculation (small-short-term; medium-medium; long-long-term).
MnojitelLine, MnpjitelLine2 - multiplication of lines for comparison.
AverageVolume - averaging volumes for calculation (needed to remove the dependence on volumes).
If both the indicator and the chart make a fast jump, then we are waiting for a ro

EA-サポートと抵抗 専門家のアドバイス、自動購入/販売
このプロフェッショナルEAは、設定で設定された時間枠で、サポートとレジスタンスを自動的に識別します。時間枠に加えて、EAがサポートと抵抗を計算するためにデータを読み取るバーの数を入力する必要があります。
たとえば、デフォルトのファイル設定では、時間枠は15分に設定されており、終了したばかりの1つ(ToBar)から始まる最後の2つのバーを読み取ります。デモで1分間試してみてください。設定の設定は無料です。正しい設定を見つけて楽しんでください。
サポートと抵抗を計算するための3つのシステムがあります。古典的な方法、カマリラとフィボナッチがあります。
注文を実行するためのサポートまたはレジスタンスを決定することもできます。デフォルト設定では、support1とresistence1が設定されています。
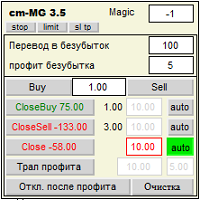
The expert Advisor helps you set a network of pending orders and collect profit from any price movement. You can use it to trade many grid strategies. You can also use it to track open positions.
"Buy Stop — - open a network of pending stop orders for sale "Sell Stop" - open a network of pending stop orders for purchase "Buy Limit" - open a network of pending limit orders for sale "Sell Limit" - open a network of pending limit orders for purchase "Close Buy" - button for closing the entire net

Description of strategy: The EA trades on 2 pairs with a positive correlation. On one, he trades only for buying, on the second only for selling. If the position goes to a loss, the adviser begins to resolve it by opening deals much smaller in volume than the original one and biting off small pieces on price rollbacks. The opposite trade, which is in the black, will not be closed until the unprofitable one is resolved or until they reach the specified profit in total.
Clearing (averaging) trades
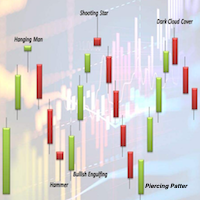
The DYJ GlobalForexTradeWarCandleShape strategy: it is provided with one combined built-in indicators: DYJ CandleShape in order to determine the signals and has different inputs for Short and Long positions in order to improve its precision. The DYJ CandleShape contains 80 shapes, such as MORNING STAR, DOJI STAR, HARAMI CROSS,INVERT HAMMER,ENGULFING..... Most trading strategies put their emphasis on finding out when to enter the market. Whether it’s technical or fundamental, everyone is looki
The EA trading Rsi Divergence strategy. EA uses Grid method. Minimum trading account for 1 pair : 100 $. Designated for trading all major forex pairs. Recommended timeframe : 4H / 1H / 30m / 15m
developed, tested and optimized on " VantageMarkets ", TGLColmex & IFCMarkets platforms. user can run this EA on multiple charts simultaneously. user can use this EA as indicator only.
notice: in the comment section there are settings sets for various charts and brokers. in any case, optimize

The world of fractals is an ea that uses the power of fractals to detect market turns in the system's recovery algorithm.
This system detects a point to operate if that point is not correct, it uses the fractals to close the cycle with profits.
For this algorithm to be effective, it has filters that improve the efficiency of the system. You can download the demo and test it yourself. Very stable growth curve as result of smart averaging techniques.
"Safety first" approach in development. Stre

This PORTFOLIO of 5 strategies has been developed, tested and traded live on GBPJPY H1 TF. Multiple EAs traded together will lead to a bigger profits and smoother equity curve. 5 not correlated EAs logics for GBPJPY H1 merged to a single strategy. Very SIMPLE STRATEGIES with only FEW PARAMETERS. Every trade has his own logic for STOP LOSS. To catch the profits every strategy uses different approach - some has TAKE PROFIT, some uses TIME BASED EXITS or PROFIT TRAILING. EA has been backtested o

Lord Auto Fibonnaci is a free indicator for Meta Trader, in order to show the most famous chart in the financial market known as "Fibonnaci".
As we can see in the images below, the fibonnaci table will automatically analyze the graph for you, with trend factors through percentage, almost infallible use, you can always work when the percentage is low or high, start shopping and sales on time, great for analyzing entries!
In the images below we can see an example in gold in H4, where we are at
FREE

Double Breakout is an automatic expert advisor with two separate strateges that uses martingale. The MACD indicator with adjustable parameters is used as inputs for each flow of orders. The specified takeprofit and stoploss levels are used to exit the position. General recommendation
The minimum recommended deposit is 1000 cents. Spread is recommended not more than 3 points. It is better to use trend currency pairs. The martingale parameter can be set from 0.1 to any value. When martingale i
FREE

This utility is designed to receive volumes from order books from larger crypto exchanges and transfer information to the indicator RealCryptoLevels . The RealCryptoLevels indicator by downloading the order book of crypt exchanges with maximum depth shows horizontal volumes of popular crypto currencies on the chart, so you can see not only the volumes, but also the levels and them strength (see screenshots), which is very important for successful trading in all strategies from scalping to m
FREE

This is MT4 version of StochScanner It scans Stochastic from Multi Symbols and Multi Timeframes and displayed on the dashboard on a single chart. . 4 scanning modes: 1. Mode OverBought/OverSold Indicator scans Overbought and OverSold . OverBought : current stochastic is above level 80 and OverSold : current stochastic is below level 20 2. Mode Signal It means if the previous stochastic is on OverBought or OverSold ( either Main Line and Signal Line ) and the current Main Line cross over the curr

Trend reversal indicator, no repainting. Clean and light rendering There is no alternative buy-sell signal without taking into account the trend. Noise filtering capability. Works with all pairs.
Ideal for beginners and experienced traders It is best used on timeframes above the M30, from the beginning of the London session to America.
It should be remembered that there are no indicators that are not wrong. Any strategy requires confirmation of its signals. When building your own system, it i

Dear Friends,
Please rate this application for the better
Optimal Lot Size Calculator is a Utility tool to calculate the optimal lot size based on your risk percentage on your capital amount. Also you can set your reward Percentage and place your order from the tool itself. You can place all types of orders(Market orders,Limit orders and Stop orders) with stop loss in pips or price level. So will save your time and also easy to place orders with your risk management.
For Limit and Stop ord
FREE

Alert TIME LINE indicator warns that the price has reached a specified time level.
Drag the indicator onto the chart, press the SET TIME LINE button, move the line that appears to the desired time, when the chart reaches the specified time, an alert will be triggered.
This indicator is used as an auxiliary tool when trading time zones, using the free TIME LINE Forex System , see the results and screenshots below.
You can get the system for free in the technical support chat https://t.me/Cycl
FREE
Chart Link MT4 allows you to control multiple charts from one chart or multiple charts from multiple charts. Features 1. Synchronised Scrolling : Scrolling the master chart also scrolls all linked sub charts to the same position. Sub charts inherit offset and auto-scroll settings from the master chart. 2. Synchronised Timeframe : Switching the master chart timeframe also switches all linked sub charts. 3. Synchronised Symbol : Switching the master chart symbo
FREE

Dear Friends, Market Inforamtion Downloader is a simple utilities program to download the market informations in a separate excel file with the name of the current chart you are using with same time frame. You needed to enter the number of periods. example. I'm in EURUSD, Day time frame. I choose to download the data last 50 candles(50 days) then I will enter 50 in the periods. After you getting the data, you use it for various analysis. Regards, Sankar Ganesh
FREE

Forex trend has always been a friend of traders, and trend indicators help determine the trend and make the right decisions. Most of the trading systems developed by trading gurus are based on the trend.
It is best used on timeframes above the M30, from the beginning of the London session to America.
It should be remembered that there are no indicators that are not wrong. Any strategy requires confirmation of its signals. When building your own system, it is recommended to use several indicat
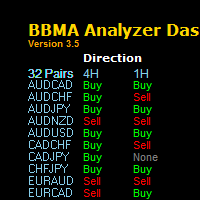
" The one of keys to trading success is a System Technique , MUST HAVE THIS SYSTEM!"
BBMA Analyzer Dashboard
BBMA is a popular technique that uses a combination of 2 indicators in MetaTrader 4 or MT4 which using Bollinger Band and Moving Average Indicator. Summary of BBMA Techniques has the basic elements:
RE-ENTRY
Formed after fall or price increase.
Price will form a Sideway to enable Re-Entry. CSAK (Strong Direction Candle)
The strong direction candle is a close candle direction above

LordTrendSignal is a financial market indicator for Meta Trader that checks signals through trends and candles, works on all TimeFrames (M1, M5, M15, M30, H1, H4, D1).
LordTrendSignal checks the signal through trends and candles and informs you via notification, alerts via email and push on the automatic screen.
The trend flexibility of LordTrendSignal is high, however, together with other of our indicators LordAutoFibonacci and LordAutoTrendLine you will be able to work very well to obtain m
MetaTraderマーケットは自動売買ロボットとテクニカル指標を販売するための最もいい場所です。
魅力的なデザインと説明を備えたMetaTraderプラットフォーム用アプリを開発するだけでいいのです。マーケットでプロダクトをパブリッシュして何百万ものMetaTraderユーザーに提供する方法をご覧ください。
取引の機会を逃しています。
- 無料取引アプリ
- 8千を超えるシグナルをコピー
- 金融ニュースで金融マーケットを探索
新規登録
ログイン