YouTubeにあるマーケットチュートリアルビデオをご覧ください
ロボットや指標を購入する
仮想ホスティングで
EAを実行
EAを実行
ロボットや指標を購入前にテストする
マーケットで収入を得る
販売のためにプロダクトをプレゼンテーションする方法
MetaTrader 4のための有料のテクニカル指標 - 4
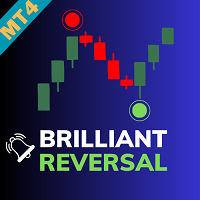
Brilliant Reversal Indicator - Your Ultimate Alert-Driven Trading Solution Unlock the potential for unparalleled trading success with the "Brilliant Reversal Indicator." This powerful tool has been meticulously designed to empower traders by identifying critical reversal opportunities with lightning-fast alerts. Key Features : Precise Reversal Detection : The Brilliant Reversal Indicator specializes in pinpointing potential trend reversals, helping you seize opportunities to enter or exit positi

As traders, we know that identifying price contractions and consolidations is crucial for profitable trading. Fortunately, we have a powerful tool at our disposal. The indicator to trade price consolidation is designed to identify price contraction and alerts us on formation. It does this by analyzing historical price data and identifying price action patterns. The algorithm then uses this information to mark the zone , potential targets and liquidity lines, giving us valuable insights into mark

BUY INDICATOR AND GET EA FOR FREE AS A BONUS + SOME OTHER GIFTS! ITALO TREND INDICATOR is the best trend indicator on the market, the Indicator works on all time-frames and assets, indicator built after 7 years of experience on forex and many other markets. You know many trend indicators around the internet are not complete, does not help, and it's difficult to trade, but the Italo Trend Indicator is different , the Italo Trend Indicator shows the signal to buy or sell, to confirm the signal t

volatility level indicator is a volatility oscillator to see trend reversal points. price trends has reverese when volatility inreased . this indicator show trend reversal points volatility. mostly same level up and down volatility is reversal points. red colour shows up points of volatilty.and probably trend will down. blue colour oscillator shows deep point of price when increased volatiliyty. on pictures horizontal lines on oscillator has drawed by hand.to see the before level and compare now

- 50% OFF -
Telegram group : https://t.me/+5RIceImV_OJmNDA0 MT5 version : https://www.mql5.com/en/market/product/85917?source=Site+Market+Product+Page
Master Pullback is a complete system that gives unique trading opportunities and a clear indication of the market: trend, signals as well as stop loss and take profit levels. This system has been designed to be as simple as possible and detects extreme overbought and oversold zones, support and resistance levels, as well as the major trend. You

The indicator signals the appearance of a possible divergent bar based on the shape of the bar without angulation detection. A bullish divergent bar is a bar that closes in its upper half (the higher the better), has a lower minimum than the previous bar, and drops sharply away from the Alligator indicator. A bearish divergent bar is a bar that closes in its lower half (the lower the better), has a higher high than the previous bar, and moves up sharply from the Alligator.
SETTINGS History - h
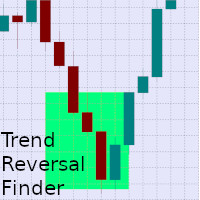
Listed in his faous book "Trading chart patterns like the pros", Suri Duddrella outlines the N-bar rally and decline reversal pattern, which simply states that when stocks make a new high or new low, momentum players will push this stock down or up until eventually they run out of steam. This indicator will look back a certain number of bars to find a continuous uninterrupted rally or decline. Once found, the pattern will look forwards to find the first bar that closes, within a certain range,

The Royal Mint New indicator for MetaTrader is a trend-following system that analyzes the trend bias of any currency pair. It is a superior version of the regular Heiken Ashi indicator, designed with more advanced technical tools like the trend reversals, a T3 line, and the moving average. The T3 line of the indicator works as an extra layer of confluence to confirm when the moving average crosses over. Moreover, the Heiken Ashi bars of the indicator would change to blue to depict a potential bu

on free demo press zoom out button to see back.. cnt number is bar numbers.you can change up to 3000 related to chart bars numbers. minimum value is 500. there is g value set to 10000. no need to change it.
this indicator almost grail,no repaint and all pairs ,all timeframe indicator. there is red and blue histograms. if gold x sign comes on red histogram that is sell signal. if blue x sign comes on blue histogram that is buy signal. this indicator on thise version works all pairs.al timeframe
このインジケーターは、入力パラメーター バー検出戦略を使用してブレイクアウトを除外します。 WaitForBarClosed 関数を使用してシグナル (true) を確認できますが、false よりも少し遅れてアクティブになることがあります。 インジケーターが別のウィンドウで開きます。 すべての時間枠とペアに適しています。 青い線はトレンドの方向を示しています。
任意のチャートにインジケーターを添付 ポップアップ表示されるインジケーター ダイアログ ボックスから、入力タブで目的の入力を選択します。 [OK] を選択して確認し、続行します。
パラメーター Lines_Break: 周期、推奨値は 3 ~ 21 です。周期が大きいほど、インジケーターが滑らかになります。 WaitForBarClosed: "true" または "false"。 よりタイトなストップ ロスと小さなテイク プロフィット レベルによって、より早いシグナルに「false」を使用できます。 確認済みシグナルには「true」を使用できます。 true と false の両方のオプションが一緒に使用されて
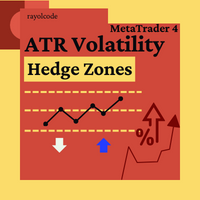
This indicator informs the user when the ATR is above a certain value defined by the user, as well as when the ATR prints a percentage increase or percentage decrease in its value, in order to offer the user information about the occurrence of spikes or drops in volatility which can be widely used within volatility-based trading systems or, especially, in Recovery Zone or Grid Hedge systems. Furthermore, as the volatility aspect is extremely determining for the success rate of any system based o

Gann Retracements Octaves Indicator Enhance your trading strategy with the Gann Retracements Octaves indicator, meticulously designed to integrate Gann's theories with modern technical analysis. This custom indicator provides you with precise retracement levels based on Gann's octaves, helping you identify key support and resistance levels, as well as potential reversal points in the market. Key Features: 24 Indicator Buffers : Tracks multiple retracement levels (-7/8 to 15/8) with distinct colo

Determining the current trend is one of the most important tasks of a trader, regardless of the trading style. The Gravity Trend indicator will help you do this with a fairly high probability.
Gravity Trend is a trend recognition indicator that uses the author's calculation algorithm. The indicator readings do not change under any conditions. The indicator is suitable for any currency pair, any timeframe.
Indicator Parameters Main Settings: HistoryBars - the number of bars to display. First

Contact me after payment to send you the User-Manual PDF File. How To Test
You can test the indicator by free version, to get the free version please contact me ( the free version scans charts in W1 and MN1 time-frames ) it's free.
123 Pattern Breakout
Trend is your friend, trade along the trend, but how do we identify trends? Sometimes the simplest methods have the best results. Pattern 123 is based on the breakout important price levels, when the price is trying to break the previou

This indicator scans for you up to 30 trading instruments and up to 8 timeframes for occurrences of the high probability reversal patterns: Double Tops/Bottoms with fake breakouts . Please read also the blog post " Professional Trading With Double Tops/Bottoms And Divergences! " which explains the concepts behind the ULTIMATE Double Top/Bottom indicator and how you can use a professional top-down approach. You can get alerts via MetaTrader 4, email and push notifications at the moment when a sig

Candle Power Signals is a trend indicator that uses a strategy of searching for potential volatile signals to make trading decisions.
By analyzing the market, the indicator identifies zones of increased and decreased volatility within the directional trend movement.
The main signal generation parameters have already been configured, the remaining settings and periods are indexed into 2 parameters for manual configuration:
1. "Candle calculation method" - 2 signal generation modes, it is rec

** All Symbols x All Timeframes scan just by pressing scanner button ** *** Contact me after the purchase to send you instructions and add you in "M W Scanner group" for sharing or seeing experiences with other users. Introduction: Double Top(M) and Double Bottom(W) is a very repetitive common type of price reversal patterns. Double Top resembles M pattern and indicates bearish reversal whereas Double Bottom resembles W pattern and indicates a bullish reversal that they have high win r
Most accurate BUY/SELL indicator on this market.
It works based on the result of multiple EMAs, with some specific averaging and algorithm . Output of an EMA is the input for another EMA.
Works on Forex, Commodities, Indicies, Stocks, Crypto, ... on all timeframes (but recommend 1H or 4H) and on every brooker.
If you want this and all my other products for FREE , create account here and then write me and I will send you all my actual and future product for FREE + VIP on my http://disc

Royal Prince Fibonacci , has the most advance Trend detection algorithm built into its Alert system combined with the RoyalPrince Non-repaint Arrows with it's own alert system you will never miss the opportunity of the trade.
2nd picture is how to use Guide on how i use it to Scalp or take long trades.
works on all Charts and all Timeframe on mt4. ︎Best Timeframe M15 for scalping H1 for Day Trading Options: • Fibonacci days High and Lows • Fibonacci Targets • Fibonacci Alert System • Tren

** All Symbols x All Time frames scan just by pressing scanner button ** *** Contact me after the purchase to send you instructions and add you in "Swing scanner group" for sharing or seeing experiences with other users. Introduction: Swing Scanner is the indicator designed to detect swings in the direction of the trend and possible reversal swings. The indicator studies several price and time vectors to track the aggregate trend direction and detects situations in which the market is oversold
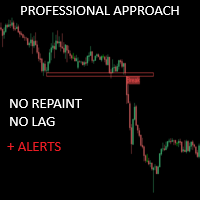
クリティカルゾーンは、より正確なマーケットエントリーを求める手動トレーダーのために特別に作成されました。このインディケータは、チャート上の最も関連性の高いサポートとレジスタンス、 およびそれらのブレイクアウトとリテストを計算することで、高度なアルゴリズ ムを使用して関心領域を検出します。このインディケータは、潜在的に有利な買い/売りの機会が検出された場 合にアラートと通知を送信するように設定でき、トレーダーが画面/ MT5 バージョンの前にいないときでも取引機会を把握することができます。
価格は$300に達するまで徐々に上昇します。次の価格 --> $69
特徴 リペイントなし このインディケータは、新しいデータが到着してもその値を変更しません 取引ペア すべてのFXペア 季節性 すべての季節性
パラメータ ===== サポートとレジスタンスの設定
計算のために参照するバー // サポートとレジスタンスのレベルを計算するために、現在のバーから 逆方向のバーの範囲。
===== 条件
ブレイクアウト // ブレイクアウト検出のオン/オフ
再

Multi timeframe ZigZag indicator. It displays the support/resistance horizontal lines and their breakouts, as well as draws the current targets of the market. It can also display lines of the Fractals indicator and candles from other periods (up to Quarterly).
The indicator redraws the last (current) point, and in some cases can change the last 2-3 points.
All lines are drawn as objects (not indicator buffers, but there is a possibility to receive the data for the EA ). When used in an Exp

What is a Point of Interest? Traders who follow Smart Money Concepts may call this a Liquidity Point, or where areas of liquidity have been built up by retail traders for for Big Banks to target to create large price movements in the market. As we all know, retail traders that use outdated and unreliable methods of trading like using trendlines, support and resistance, RSI, MACD, and many others to place trades and put their stop losses at keys points in the market. The "Big Banks" know these me
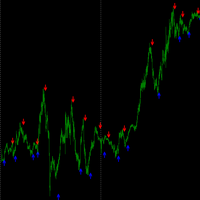
This indicator gives you nice trigger entry....whatever it is your trading style. You can use on different timeframes and also you can select from the setting the sensibility of the indicator itself, changing the input parameter "cycle period". For faster trigger signals you need to use shorter "cycle periods". You can use it in reversal strategy as well as in trending strategy. Added: - Sound Notification - PopUp Notification - Mobile Push Notification (To make it work follow the inst

地震計マーケット クエイク検出器。 Description in English :
https://www.mql5.com/en/market/product/113869?source=Site+Market+Product+Page#description How to use the Seismograph :
https://www.mql5.com/en/market/product/113869#!tab=comments&page=2&comment=52806941
Create an EA :
https://www.mql5.com/en/market/product/113869#!tab=comments&page=3&comment=52816509
どのような取引方法であれ、流動性の低い市場への参入は避けたいものです。 地震計は、市場が上昇する前に市場に参入する適切なタイミングに役立ちます。 しかし、忙しいはずの市場時間帯にエントリーするようにしたにもかかわらず、流動性の低い市場に閉じ込められてしまう人が多いのが実情です。 数時

The BB Reversal Arrows technical trading system has been developed to predict reverse points for making retail decisions.
The current market situation is analyzed by the indicator and structured for several criteria: the expectation of reversal moments, potential turning points, purchase and sale signals.
The indicator does not contain excess information, has a visual understandable interface, allowing traders to make reasonable decisions.
All arrows appear to close the candle, without redr
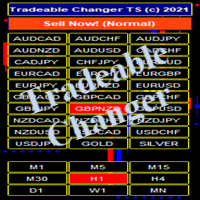
Tradeable Changer Indie
Trade-able Changer Indie is an indicator that serves several purposes. The idea behind this operating indicator is to have a minimal set of indicator
or experts on the chart in order to avoid clumsy chart window and at the same time have a great time trading profitably.
This is a combination of Symbol/Time-frame Changer and a Trading system based on Trends following.
It has a small board to display trade signals for the trader.
Due to the nature of these com

The indicator displays volume clusters or volume profiles to choose from.
Input variables
StepPoint - cluster step in points, if the value is zero, the step is assigned automatically. AssociatedTimeframe - binding the indicator to the specified timeframe of the chart, if the value is equal to Current, the indicator works on all timeframes. ClustersVolume - volume in clusters: All - all volume. Active - active volume (which produced the price movement). ClustersAsDelta - difference betw

Level Breakout Indicator is a technical analysis product that works from upper and lower boundaries, which can determine the direction of the trend. Works on candle 0 without redrawing or delays.
In its work, it uses a system of different indicators, the parameters of which have already been configured and combined into a single parameter - “ Scale ”, which performs gradation of periods.
The indicator is easy to use, does not require any calculations, using a single parameter you need to selec

M & W Pattern Pro is an advanced scanner for M and W patters , it uses extra filters to ensure scanned patterns are profitable.
The indicator can be used with all symbols and time frames.
The indicator is a non repaint indicator with accurate statistics calculations.
To use , simply scan the most profitable pair using the statistics dashboard accuracy , then enter trades on signal arrow and exit at the TP and SL levels.
STATISTICS : Accuracy 1 : This is the percentage of the times price hit

How to use Pair Trading Station Pair Trading Station is recommended for H1 time frame and you can use it for any currency pairs. To generate buy and sell signal, follow few steps below to apply Pair Trading Station to your MetaTrader terminal. When you load Pair Trading Station on your chart, Pair Trading station will assess available historical data in your MetaTrader platforms for each currency pair. On your chart, the amount of historical data available will be displayed for each currency pai

ZonePro Supply Demand は、新しいゾーン、テストされたゾーン、壊れたゾーン、古いゾーン、およびネストされたゾーンを最大 3 つの高いタイムフレームまで描画し、ゾーンがタッチされた場合、エントリーされた場合、または壊れた場合、または反転ローソク足がゾーンから離れた場合にアラートを送信します。 再塗装は不要です。
ゾーン情報:
ピップサイズ ゾーンがより高いタイムフレームにネストされている場合 ゾーンがテストされるかどうか、およびその回数は トレンドパネル (左上) :
時間を表示します 次のキャンドルまでの時間 全体的な傾向 短期的なトレンドの方向性 トレンドが始まってからの距離 壊れたゾーンの数 アラート ボタンをオンにすると、トレンドが変化したときにアラートを受け取ります!(アラート ボタンはアラート パネルでオンになっている必要があります!)
アラートパネル (右下):
ポップアップ、メール、プッシュ通知、 選択するゾーン アラート タイプ より高いタイムフレームがオンになっている場合、情報ラベルのオンとオフを切り替えることがで

Volatility Trend System - a trading system that gives signals for entries. The volatility system gives linear and point signals in the direction of the trend, as well as signals to exit it, without redrawing and delays.
The trend indicator monitors the direction of the medium-term trend, shows the direction and its change. The signal indicator is based on changes in volatility and shows market entries.
The indicator is equipped with several types of alerts. Can be applied to various trading

Did You Have A Profitable Trade But Suddenly Reversed? Exiting a trade is equally important as entering! Exit Scope helps maximize your current trade profit and avoid turning winning trades to losers.
Attention Exit Signals are NOT to be used in entering a trade! Exit means closing your trades to avoid correction/reversal which can wipe out existing profit or haunt break-even orders. Please watch presentation (Click Here)
Features Generates instant exit signals based on price action, volat

ON Trade Waves Patterns Harmonic Elliot Wolfeをご紹介します。これは手動および自動の方法を使用して市場のさまざまなパターンを検出するために設計された高度なインジケーターです。以下はその動作方法です: ハーモニックパターン: このインジケーターは、チャートに表示されるハーモニックパターンを識別できます。これらのパターンは、Scott Carneyの「Harmonic Trading vol 1および2」で説明されているように、ハーモニックトレーディング理論を実践するトレーダーにとって重要です。手動で描画するか、自動検出に頼るかにかかわらず、ON Trade Waves Patternsがお手伝いします。 コントロールパネル: このインジケーターはユーザーフレンドリーなコントロールパネルを備えています。チャートと時間枠の設定を保存し、異なる構成間をスムーズに切り替えることができます。チャートスペースを最大限に活用するために最小化することもできます。他の分析ツールで作業することを好む場合、閉じるボタンをクリックするだけで、すべてのインジケーターデ

Ace Supply Demand Zone Indicator The concept of supply demand relies on the quantity mismatching between buying and selling volumes in the financial market. Supply and demand zone can provide the good entry and exit. A zone is easier to trade than a line. The supply demand zone can provide the detailed trading plan and the risk management. Its ability to predict market direction is high. There are two distinctive points about Ace Supply Demand Zone Indicator. Ace Supply Demand Zone indicator was

Forex Breath System は、あらゆる市場で使用できるトレンドベースの取引システムです。このシステムは、通貨、金属、商品、指数、仮想通貨、さらには株式でも使用できます。任意の時間枠でも使用できます。システムは普遍的です。トレンドを示し、トレンドに伴う矢印シグナルを提供します。このインジケーターは、シグナルがトレンドの方向に現れたときに特別なタイプのアラートを提供することもできるため、トレンド取引が簡単になります。 このインジケーターは、理解しにくい設定に対処する必要がないため、非常に使いやすいです。 チャートに添付するだけで取引の準備が完了します。どのような取引スタイルを好む場合でも、このシステムは市場の方向性とトレンド方向への可能なエントリーポイントを確認するのに役立ちます。 このインジケーターは、PUSH 通知を含むあらゆる種類のアラートを提供します。 取引手順と素晴らしいボーナスを入手するには、購入後に私にご連絡ください。 幸せで収益性の高い取引をお祈りします!

このインジケータは、手動および自動的な方法でチャートに描かれたハーモニックパターンを検出します。ユーザーマニュアルは、このリンクから参照できます: あなたのレビューを追加し、入手するために私たちに連絡してください。 この製品をmt4で試すための無料版があります。 GartleyおよびNenstarパターンを検出するために使用できます。 https://www.mql5.com/en/market/product/30181 完全なMT4バージョンを購入するには、次の場所から購入できます。 https://www.mql5.com/en/market/product/15212 注 インジケータにはコントロールパネルがあり、すべての(チャート&時間枠)設定が保存されます。チャート上でスペースをより多く確保するために、最小化することができ、他の分析ツールで作業する場合は、すべてのインジケータデータを非表示にするために閉じるボタンを押すことができます。 このインジケータを使用して設定を変更し、移動平均やボリンジャーバンドなどのインジケータを追加すると、編集のテンプレートが自動的に保存され、必

Apollo Secret Trend は、任意のペアと時間枠でトレンドを見つけるために使用できるプロのトレンド インジケーターです。インジケーターは、取引するペアや時間枠に関係なく、市場のトレンドを検出するために使用できる主要な取引インジケーターになることができます。インジケーターで特別なパラメーターを使用することにより、シグナルを個人の取引スタイルに適応させることができます。 このインジケーターは、PUSH 通知を含むすべてのタイプのアラートを提供します。インジケータの信号は再描画しないでください!提供されたスクリーンショットでは、アポロ シークレット トレンド インジケーターと買われ過ぎ/売られ過ぎのオシレーター インジケーターを組み合わせて見ることができます。これは完全に無料で提供されます。 購入後、2 番目の買われすぎおよび売られすぎのオシレーター インジケーターを無料で入手するために私に連絡してください!また、システムの使用方法についても説明します。お得な特典もご用意しております!

BUY INDICATOR AND GET EA FOR FREE AS A BONUS + SOME OTHER GIFTS! ITALO TRIANGLE INDICATOR is the best triangle indicator ever created, and why is that? Using Geometry and Fibonacci the Indicator works on all time-frames and assets, indicator built after 7 years of experience on forex and many other markets. You know many triangle indicators around the internet are not complete, does not help, and it's difficult to trade, but the Italo Triangle Indicator is different , the Italo Triangle Indi

BUY INDICATOR AND GET A PIVOT POINT EA FOR FREE AS A BONUS + SOME OTHER GIFTS! ITALO PIVOTS INDICATOR is the best pivot point indicator for strong price reversals and continuations of price movements ever created , and why is that? You will have for the first time inside a pivot point indicator the pivots above the monthly, so, you will have the 3-month pivot lines, 6 months, 1 year, 2 years, 3 years, 5 years and 10 years, very strong support and resistances. Not only that but for the fi

まず最初に、このトレーディングシステムがリペイントされず、再描画されず、遅延しないことを強調する価値があります。これにより、プロのトレーディングに最適な状態になります。 オンラインコース、ユーザーマニュアル、デモ。 「スマートサポートアンドレジスタンストレーディングシステム」は、新規および経験豊富なトレーダー向けにカスタマイズされた高度なインジケーターです。この包括的なシステムは、7以上の戦略、10のインジケーター、およびデイトレード戦略、スイングトレード戦略、サポートおよびレジスタンス戦略、ローソク足パターン戦略、VWAP戦略、マルチタイムフレームトレンド戦略など、さまざまなトレーディングアプローチを組み合わせています。これは、矢印信号、エントリーポイント、出口ポイント、トレードアラート、より高い時間枠のトレンド分析、リアルタイムのトレードモニタリング、そして洞察力のあるトレンドとボリュームキャンドルの着色を提供します。自動的なサポートとレジスタンスの検出により、さまざまな市況下でトレーダーが的確な決定を下すのを支援する多面的なインジケーターとなっています。
スマートサポートア

"It's not about how much you do, but how much love you put into what you do that counts." - Mother Teresa Unlock the ultimate trading advantage today with the Arbitrage Thief Index. Throughout my successful trading career, this powerful indicator has been my secret weapon for securing perfect entry and exit points, ensuring consistent and safe profits. Now, I'm excited to share this revolutionary strategy with you. Top fund managers diversify their trades across multiple instruments to build a

Indicator of the price channel and breakpoint generator inside it. It gives an idea of the position of the price in relation to the period of use.
It contains smoothed trend bounce lines built along the channel borders and bounce points that determine entry and exit moments.
Works on various trading instruments and time frames.
How to work with the indicator
Follow the channel break line, the blue line is up inputs, the pink line is down inputs.
Entry points are generated on the current

# 33% off - limited time only #
ChartSync Pro MT4 is an indicator, designed for the MetaTrader 5 trading terminals. It enables the trader to perform better multi-timeframe technical analysis, by synchronizing symbols and objects into virtually unlimited charts. Built by traders for traders! Telegram Premium Support - Dd you purchase the Chart Sync indicator and need a bit of help? Send us a screenshot with your purchase and your Telegram ID so we can add you to our premium support Telegram

Place price Alerts on extended Rectangles and Trendlines - Risk reward indicator mt4 Extend Rectangles & Trendlines to the right edge Mark your supply demand zones with extended rectangle and draw support resistance lines with extended trendline. Find detailed manuals here . Find contacts on my profile . MT4 Rectangle extender indicator will simplify and make it easier for you to analyze markets and stay notified about important events. When you extend rectangle or trendline the action bu

Multicurrency and multi-timeframe indicator Inside Bar (IB). In the parameters, you can specify any desired currencies and timeframes. The panel displays the last found Inside Bar (and Mother Bar) pattern, the current price position and the breakout of the levels of the Mother and Inside Bars. You can set the size and color for bars and text in the cells. The indicator can also send notifications when levels are broken. By clicking on a cell with a period, the specified symbol and period will b

We have combined all of our beloved indicators the likes of: Key level order block , Key level supply and demand , Key level liquidity grab and Key level wedge into one single indicator and dashboard.
Whats new Dashboard : There is an easy access dashboard for all your needs. Multi-timeframe button : There is now a multi-timeframe option for Order Blocks and Supply and demand zones, making it easy to see higher timeframe zones easily on the current timeframe by just clicking the desired timefr

Introduction to Fibonacci Volatility Indicator Volatility indicator can help you to detect any statistical advantage for your trading. Especially, if you are trading with Price Action and Price Patterns, then we recommend to use the Volatility indicator together with your strategy. Especically, Fibonacci Volatility indicator combines the market volatiltiy with Fibonacci Analysis to provide you more advanced volatiltiy indicator. Main Features Fibonacci Volatility in Z score Configuration Mode Fi

Using the Likdon Forex indicator algorithm, you can quickly determine the current trend in the market. The Elephant indicator tracks long trends and can be used without restrictions on instruments or timeframes. With its help, you can try to predict future price values, but its main purpose is to generate buy and sell signals.
The indicator tracks the market trend, ignoring sharp fluctuations and market noise around the average price. It implements a technical analysis method based on the ass

Visualization of the trade deals, distributed by price levels. You can set any period for calculation: between 2 vertical lines, or set a fixed time interval. The histogram levels are relative: a wider bar means more trading volume. Distribution extremes can be used as a support and resistance levels.
All styles, sizes and colors are customizable. My #1 Utility : includes 65+ functions | Contact me if you have any questions | MT5 version In the settings of the indicator, you can config
MTFMA(マルチタイムフレーム移動平均)インジケーターは、異なる時間枠で複数の移動平均(MA)を使用して、メインチャートとは別のウィンドウで買いと売りのシグナル(リペイントしない)を提供します。これは、短時間枠でのスキャルピングや長時間枠での長期取引の両方に適しており、多用途で解釈が簡単です。 なぜマルチフレームなのか? マルチフレームという用語は、インジケーターが複数の時間枠のデータを使用および組み合わせる能力を指します。MTFMAは、4つのカスタマイズ可能な移動平均(MA)に基づいてシグナルを計算して表示します。各MAは、異なる期間、計算方法、および価格タイプに調整できるため、トレーダーは1つのチャートで短期および長期のトレンドの組み合わせを見ることができます。 重要なポイント: 多用途性:分から月まで、あらゆる時間枠で使用可能。スキャルピングから長期取引まで適しています。 リペイントしない:シグナル(上矢印または下矢印)が生成されると、その色は変わらず、トレーダーが生成されたシグナルに基づいて取引判断を行うことができます。 簡単な解釈:買いと売りのシグナルは、下部インジケーター

Extreme Value Sniper is a detrended price indicator Indicator finds the potential reversal levels by checking value ranges and price cycles. ***Indicator does NOT repaint so it provides accurate NO REPAINT REVERSAL SIGNALS***
MT5 Version of the product : https://www.mql5.com/en/market/product/114550
It shows the overbought and oversold levels using the average range. Overbought Levels are between 4 and 10 Oversold levels are bewtween -4 and -10
Those levels can be used as a reversal l

Keltner Channel Indicator Keltner Channel is an oscillator like Bollinger Bands.
Keltner Channel is a very good tool to time entries for your strategy.
Keltner Channel displays a channel where price is supposed to stay unless we are in overbought or oversold situations.
Various strategies use Keltner Channel indicator successfully to spot overbought / oversold situations and look for reversals.
Keltner Channel indicator uses ATR to determine overbought and oversold situations. Inputs of the

Ranging Market Detector scans the market for momentum and price to check whether the price is range- bound and the direction to which it will breakout. It works with all the all assets and visually shows you the instances when the market is either ranging or trending. Informs when the price has finished a retracement, an opportune time to re-enter the trend early. This will help you in position management. It works very well for Scalping, Day trading, and Swing trading. Helpful in all timefra
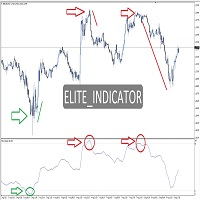
ELT Reversal MT4 (Elite_Indicator) is an indicator for the MetaTrader 4 terminal. . This indicator is based on the Counter-Trend strategy, but also uses Volatility. It is based on showing possible liquidity in the financial market, thus helping traders in their trading. ELT Reversal MT4 (Elite_Indicator) is a visual tool, intuitive, and easy to understand and use.
Recommended time frame for Scalping Trade : M1 M5 M15 Recommended time frame for Swing Trade : M30 upward Better precision:

Mean Reversion Supply Demand Indicator Mean Reversion Supply Demand is the indicator to detect the important supply demand zone in your chart. The concept of supply demand trading relies on the quantity mismatching between buying and selling volumes in the financial market. Typically, supply demand zone serves to predict the turning point. The wave pattern, for any supply demand zone to work as an successful trade, looks like the price must touch the base zone, move away and then return to zone

Dark Oscillator is an Indicator for intraday trading. This Indicator is based on Counter Trend strategy, trying to intercept changes in direction, in advance compared trend following indicators. We can enter in good price with this Indicator, in order to follow the inversion of the trend on the current instrument. It is advised to use low spread ECN brokers. This Indicator does Not repaint and N ot lag . Recommended timeframes are M5, M15 and H1. Recommended working pairs: All. I nst

Nas100 killer V2 (See video of how we test the indicator live) 1000% non-repaint indicator appears on current candlestick. Timeframes: M5, M15, M30, H1, H4. Works on pairs such as (NAS100, US30, SPX500, and Gold) The indicator is strictly for scalping do not hold trades for too long. Orange arrows look for selling opportunities. Light Blue arrows look for buying opportunities.

精密トレンドシグナルは、価格の反転ポイントをチャート上に矢印で表示するインジケーターです。緑の矢印は価格が上昇に反転する時を示し、赤の矢印は価格が下降に反転する時を示します。このインジケーターは、任意の時間枠と任意の通貨ペアで使用できます。 このインジケーターを使用したトレーディング戦略: 緑の矢印 :緑の矢印が表示されたら、以前に開いた売りポジション(もしあれば)を閉じて、買いポジションを開きます。 赤の矢印 :赤の矢印が表示されたら、以前に開いた買いポジション(もしあれば)を閉じて、売りポジションを開きます。 インジケーターの利点: 再描画しない :このインジケーターはシグナルを再描画しません。 明確な方向 :矢印で価格の動く方向を示します。 汎用性 :すべての通貨ペアで機能します。 柔軟な時間枠 :すべての時間枠で機能します。 インジケーターの設定: Step :パラボリックインジケーターのステップ。 Maximum :パラボリックインジケーターの最大ステップ。 MA_Period :シグナルフィルターとして使用する移動平均線の期間。 Arrow :矢印のサイズ。

スイングトレーディング は、トレンドの方向のスイングと可能な反転スイングを検出するように設計された最初のインジケーターです。トレーディングの文献で広く説明されているベースラインスイングトレーディングアプローチを使用します。インディケータは、いくつかの価格と時間のベクトルを調査して、全体的なトレンドの方向を追跡し、市場が売られ過ぎまたは買われ過ぎて修正の準備ができている状況を検出します。 [ インストールガイド | 更新ガイド | トラブルシューティング | よくある質問 | すべての製品 ]
むち打ちを起こさずに市場スイングの利益 インジケーターは常にトレンドの方向を表示します 色付きの価格帯は機会のベースラインを表します 色付きのダッシュは、可能な反転スイングを表します この指標は、独自の品質とパフォーマンスを分析します 複数時間枠のダッシュボードを実装します カスタマイズ可能なトレンドおよびスイング期間 電子メール/サウンド/プッシュアラートを実装します インジケータは再描画またはバックペインティングではありません
Swing Tradingとは Swing Tradi

通貨強度メーターは、現在どの通貨が強いか、どの通貨が弱いかをすばやく視覚的にガイドします。 メーターは、すべての外国為替クロスペアの強度を測定し、それらに計算を適用して、個々の通貨の全体的な強度を決定します。 28ペアのトレンドに基づいて通貨の強さに基づいて計算します。
MQL5ブログにアクセスすると、インジケーターの無料バージョンをダウンロードできます。 Metatrader Testerの制限なしで、購入する前に試してみてください: ここをクリック
1.ドキュメント すべてのトレンド通貨強度のドキュメント(手順)と戦略の詳細は、MQL5ブログのこの投稿で入手できます: ここをクリックしてください。
2.お問い合わせ ご不明な点がある場合やサポートが必要な場合は、プライベートメッセージでご連絡ください。
3.作成者 SAYADI ACHREF、フィンテックソフトウェアエンジニア、Finansyaの創設者。

The indicator calculates currency strength of eight major and also can calculate strength of any other currency, metal or CFD. You don't need to look through a lot of charts to determine the strong and weak currencies, as well as their current dynamics. The picture of the whole currency market for any period can be viewed in a single indicator window. Built-in tools for monitoring and controlling the situation will help you not to miss out on profits.
Main Features It is able to display only t

BUY INDICATOR AND GET EA FOR FREE AS A BONUS + SOME OTHER GIFTS! ITALO VOLUME INDICATOR is the best volume indicator ever created, and why is that? The Indicator works on all time-frames and assets, indicator built after 7 years of experience on forex and many other markets. You know many volume indicators around the internet are not complete, does not help, and it's difficult to trade, but the Italo Volume Indicator is different , the Italo Volume Indicator shows the wave volume, when market

The Volume Profile stands as an exceptional analytical tool, providing traders with an intricate view of market dynamics—capturing the continuous ebb and flow of price fluctuations over time. This live graphical representation organizes auction data, unveiling collective behavioral patterns inherent within market movements. At its core lies the Value Area, encapsulating the price range that houses 68% of a day’s trading activity. This zone, equivalent to a standard deviation, reflects where the

CONGESTION BREAKOUT PRO
This indicator scans the breakout of congestion zones . This indicator unlike any other congestion indicator you will find in the market right now, it uses an advanced algorithm not peculiar to most traditional congestion indicators available today . The advanced algorithm used to define the congestions is greatly responsible for the high rate real congestion zones and low rate fake congestion zones spotted by this product.
UNDERSTANDING CONGESTION
Congestion are

** All Symbols x All Timeframes scan just by pressing scanner button ** *** Contact me after the purchase to send you instructions and add you in "ABCD scanner group" for sharing or seeing experiences with other users. Introduction This indicator scans AB=CD retracement patterns in all charts. The ABCD is the basic foundation for all harmonic patterns and highly repetitive with a high success rate . The ABCD Scanner indicator is a scanner reversal ABCD pattern that helps you identify when the p

矢印を再描画しない外国為替スキャルピング インジケーター。 M5、M15、M30、H1 の時間枠で最適に機能します。デフォルト設定は M5 時間枠用です。下の図は、「期間 = 0.35」パラメーター値を使用して H1 チャートで作業する例を示しています。デモ版をダウンロードして、自分でテストできます。現在、ほとんどすべてのスキャルピング戦略でこのインジケーターのシグナルを使用しています。私たちの計算によると、そのシグナルの精度は時間枠に応じて約 95% です。このインジケーターは、すべての通貨ペアで機能します。すべての主要通貨ペアと金属でテストしました。どこでも±95%のほぼ同じ精度が得られました。
インジケーターの利点: 矢印を再描画しません すべての通貨ペアで動作します 高い信号精度 スキャルピングに良い
インジケーターの設定: period - 信号精度を計算するための期間。 price - インジケーターにどの価格を使用するかを指示します: CLOSE、OPEN、HIGH、LOW。デフォルトでは、インディケータは CLOSE 価格で動作します。

TTM Squeeze Indicator TTM Squeeze is an indicator to time entries based on volatility.
TMM Squeeze might well be one of the best and most overlooked indicator. It was created by famous trader John Carter and is also used by many traders like Nathan Bear.
Why is the TTM Squeeze indicator important? Because in trading correct timing entries might be more important than picking the right direction. This is a concept that is not very well understood in the trading community. Most trader think

または(BD%)は、ポイントではなくパーセントでボラティリティを測定するボラティリティ指数です。 BD%の考え方は、0から100パーセントの間で移動するClassic Standard Deviation(CSD)に応じてインデックスを作成することです。
BD%を使用して、異なる期間または異なる時間枠での同じ証券のボラティリティを比較できます。さらに、BD%を使用して、ポイントではなくパーセントで、さまざまな市場のさまざまな証券間のボラティリティを比較できます。
「BD%」の使い方
BD%が90%未満で、このレベルを上向きに超えた場合、これは価格がさまざまな領域で変動する可能性があることを示しています。 BD%が90%を上回り、その後このレベルを下向きに超え、価格がすでに単純移動平均を上回っている場合、これは新しい上昇トレンドの始まりの兆候です。 BD%がマイナス面に深くなるにつれて、ボラティリティとトレンドの強さが増しています。 BD%が0%の場合、これはボラティリティが最大値にあることを意味します。 BD%が90%を上回り、その後このレベルを下向きに超え、価
MetaTraderプラットフォームのためのアプリのストアであるMetaTraderアプリストアで自動売買ロボットを購入する方法をご覧ください。
MQL5.community支払いシステムでは、PayPalや銀行カードおよび人気の支払いシステムを通してトランザクションをすることができます。ご満足いただけるように購入前に自動売買ロボットをテストすることを強くお勧めします。
取引の機会を逃しています。
- 無料取引アプリ
- 8千を超えるシグナルをコピー
- 金融ニュースで金融マーケットを探索
新規登録
ログイン