YouTubeにあるマーケットチュートリアルビデオをご覧ください
ロボットや指標を購入する
仮想ホスティングで
EAを実行
EAを実行
ロボットや指標を購入前にテストする
マーケットで収入を得る
販売のためにプロダクトをプレゼンテーションする方法
MetaTrader 4のためのテクニカル指標 - 91

Introducing the Austin Trend Scanner: Your Ultimate Tool for Timely Trend Identification.
The Austin Trend Scanner is a groundbreaking MetaTrader 4 indicator meticulously engineered to provide traders with precise trend reversal signals across multiple timeframes. Built upon advanced algorithms and non-repainting technology, this indicator offers unparalleled accuracy in identifying profitable trading opportunities.
Key Features: 1. Non-Repainting Signals: The Austin Trend Scanner delivers non
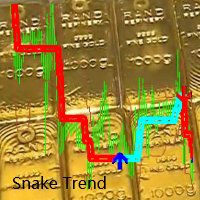
「一緒に成長!」 「協力QQ:556024」 「協力wechat:556024」 「協力メール:556024@qq.com」
「トレンドは形成されているか死にかけている、そして踊る蛇が旋回するのに続いて、一緒に前進し、決してあきらめない 「はっきりと見える長い判断と短い判断、それに従ってください!」 「ねじれた蛇は、トレンドにつながるはしごであり、一歩一歩、上昇と下降を繰り返します!」 「私たちはトレンドと良い友達であり、ショックは私たちの最高のパートナーでもあります!」 「一緒に成長!」
インデックスの内容: 1.ベンチマーク価格、ベンチマーク価格を参照してください。短期的には、価格は継続的かつ無秩序に変動し、短期的な運命は予測できないように見えます。 2.参照トレンド方向 3.複数の種類と複数の期間のトレンド表示
注:最大20種類の制限があります。そうしないと、システムがフリーズします。 提案: Kラインの短期的な変動を弱め、中長期的な傾向を追う。

The indicator allows you to trade binary options. The recommended time frame is М1 and the expiration time is 1,2 minutes. The indicator suitable for Auto and Manual trading. A possible signal is specified as a arrows above/under a candle. You should wait until the candle closes! Arrows are not re-painted Trade sessions: US section Currency pairs: Any Working time frame: M1 Expiration time: 1,2,3,4,5 (depend on pair-contact for get detail advise) With auto trading with Bot, buffer 1: call, bu

The indicator allows you to trade binary options. The recommended time frame is М1 and the expiration time is 2,3 minutes. The indicator suitable for Auto and Manual trading. A possible signal is specified as a arrows above/under a candle. You can entry current or new candle Arrows are not re-painted Trade sessions: US section Currency pairs: Any Working time frame: M1 Expiration time: 2,3,4,5 (depend on pair) With auto trading with Bot, buffer 1: call, buffer 0 : put The indicator shows good
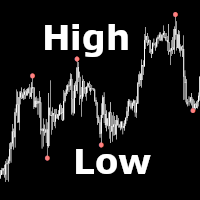
High Low FX draws dots if a new high or low occurs. The indicator is interesting for many different strategies. It can be used in EAs. High Low FX generates also alerts if a new high/low appears. The indicator is fast and not repainting.
️ High Low FX is not repainting.
️ High Low FX requires a minimum of CPU power.
️ High Low FX can be used in EAs.
In order to properly calculate the extremes the indicator is lagging
Inputs Left -> How many candles to the left must the high (low) exce

Introducing Trend Zones: Your Ultimate Tool for Precise Market Entry and Exit Points.
Trend Zones is a revolutionary MetaTrader 4 indicator designed to provide traders with clear buy and sell zones based on trend reversals and price action. Built upon advanced algorithms and non-repainting technology, this indicator offers unparalleled accuracy in identifying optimal entry and exit points in the forex market.
Key Features: 1. Non-Repainting Signals: Trend Zones delivers non-repainting signals,

Breakout Sniper draw trendlines by using improved fractals and plots the breakout and reversal points.
NO REPAINT AUTOMATED TRENDLINES MULTI TIMEFRAME
*** SINCE THE STRATEGY TESTER OF MT4 PALTFORM DOES NOR SUPPORT, YOU NEED TO TEST "CURRENT TIMEFRAME" INPUTS ONLY.*** A trendline is a line drawn over pivot highs or under pivot lows to show the prevailing direction of price . Trend lines are a visual representation of support and resistance in any time frame. They show direction and speed

xclusive Stairsは、MetaTrader4プラットフォームのトレンド指標です。その操作アルゴリズムは移動平均に基づいており、特別なフィルターと価格平滑化手法によって処理されます。これにより、専用階段は従来の移動平均よりもはるかに早く信号を生成できます。
このインディケータは、より短い時間枠で使用されるスカルパーと、良好な取引を得るために数日待つことをいとわないトレーダーの両方に適しています。
このインジケーターを購入すると、以下を受け取ることができます。 無料の製品サポート。 定期的な更新。 シンプルで簡単なインジケーター構成。 すべての時間枠で動作します。 あらゆる金融商品で機能します。
推奨記号 EUR / USD、AUD / USD、GBP / USD、GOLD(XAU / USD)。
使用上の推奨事項 買いシグナル:専用階段インジケーターラインを超える価格。
売りシグナル:排他的階段インジケーターラインを下回る価格。

The Multicurrency Trend Detector ( MTD ) indicator allows you to immediately and on one chart on a selected time interval (extending from a zero bar to a bar set in the settings by the value horizon) determine the presence, direction and strength of trends in all major currencies, as well as assess the reliability of these trends. This is achieved by calculating indices (non-relative purchasing power) of eight major currencies, namely: AUD, CAD, CHF, EUR, GBP, JPY, NZ
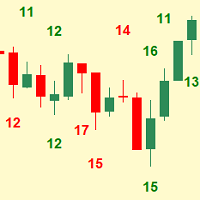
Simplest indicator for bar shadows. Very useful for Kangaroo Tail strategy.
"Shadows" - this is the distance from high and close of the bull bar and low and close of the bear bar. The purpose of the shadow is to show you if the bar is strong or not. Whether it is internal to the trend or is external. It even helps determine if a trend is starting. Very easy to recognise the pattern of the kangaroo tail and the reverse bar.
Input arguments: Timeframe
How many prevoius bars to calculate Value of
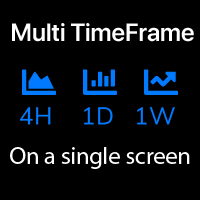
このインジケーターは、1つの画面で3つの異なる時間軸を分析するのに役立ちます:価格の全体的な動きを確認できます。 私の #1 トレードマネージャー をチェック:66+ 機能、このツールを含む | 質問があれば連絡 してください 初期設定では以下を設定できます: 時間軸1; 時間軸2; 時間軸3; 表示するバーの数; 強気と弱気のバーの色; 製品ファイルは'Indicators'ディレクトリに配置する必要があります。 私の #1 トレードマネージャー をチェック:66+ 機能、このツールを含む | 質問があれば連絡 してください 私の #1 トレードマネージャー をチェック:66+ 機能、このツールを含む | 質問があれば連絡 してください 私の #1 トレードマネージャー をチェック:66+ 機能、このツールを含む | 質問があれば連絡 してください

Fibonacci Channel
What is a Fibonacci Channel? The Fibonacci channel is a technical analysis tool that is used to estimate support and resistance levels based on the Fibonacci numbers. It is a variation of the Fibonacci retracement tool, except with the channel the lines run diagonally rather than horizontally. It can be applied to both short-term and long-term trends, as well as to uptrend and downtrends. Lines are drawn at 23.6, 38.2, 50, 61.8, 78.6, 100, 161.8, 200, 261.8, 361.8 and 423.6 p
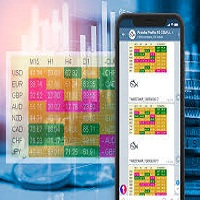
CurrencySt Alerts Metatrader 4 Forex Indicator
The CurrencySt Alerts MT4 forex indicator displays the trend strength for the 8 major currencies: NZD, EUR, GBP, USD, JPY, AUD, CAD and CHF.
It ranks the 8 currencies from very strong to very weak in a table directly visible on the MT4 activity chart.
How to trade with the Currency Strength indicator?
As a general rule, always trade the strongest currency versus the weakest currency.
For example, as shown in the NZD/USD chart below, the NZD
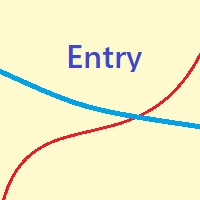
This cross MA and trend line indicator defines entries based on fast and slow MA and on the previous bot or top. The entry is displayed together with indicative prices for target and stoploss. It also gives a indicative pending sl and tp in case you set a reverse stop order. The prices are based on tops and bots from my strategy which I use in my other indicator - https://www.mql5.com/en/market/product/56045. The entry shows you if a correction is strong and will become reverse trend or if the c
Hello dear friend! Here's my story. I'm fast. After many attempts to trade manually, I decided to use expert. I started writing my robot. But testing took a lot of time! In parallel, I tried other people's robots. And again I spent a lot of time testing. Night scalpers, news scalpers, intraday scalpers, and many other classes... you needed to know exactly when the robot was trading, when it was making a profit, and when it Was losing. Some robots have time-based trading features that are not de

This is a professional TrendFact indicator. Knowledge of the entry point of each currency is very important for every trader trading in the forex market. This indicator measures the changes in the trend direction for any currency pair and timeframe, using the built-in authoring algorithm. The strategy for trading on trend, filtering and all the necessary functions are built into one tool! The indicator displays signals in a simple and accessible form in the form of arrows (when to buy and when t
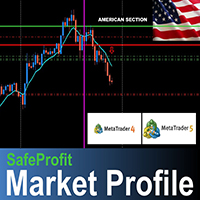
SafeProfitマーケットプロファイルは、外国為替市場で最も先進的な追跡指標です。これは、その日の各セッション(アジア、ヨーロッパ、アメリカ)の市場プロファイルを追跡するために開発されました。 このインジケーターを使用すると、日中の笑顔で操作できます...ビッグプレーヤーが配置されている場所と彼らが行く正確な瞬間を正確に知ることができます。 インジケーターはシンプル、高速、客観的で、ビッグプレーヤーのあらゆる動きを価格で追跡します。 コンピューターサイエンティスト、ソフトウェアエンジニア、金融市場スペシャリストのJonathas Rodriguesによって開発されたこのセンセーショナルなツールを失うだけの95%の統計から抜け出し、使用してください。 何も設定する必要はありません...それをチャートに追加し、ろうそくを閉じて休憩を待つだけです。 時間枠:30M。 SafeProfit mākettopurofairu wa, gaikoku kawase ichiba de mottomo senshin-tekina tsuiseki shihyōdesu. Kore wa, s

In Out Trend is a trend indicator for working in the Forex market. A feature of the indicator is that it confidently follows the trend, without changing the signal if the price slightly pierces the trend line. The indicator is not redrawn.
In Out Trend - the indicator gives entry signals at the most logical prices after the price pierces the trend line. The indicator works on the basis of mathematical calculations on the price chart. It is one of the most common and useful indicators for findi
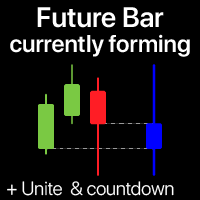
このインジケーターは、選択した時間軸で現在形成中のろうそく足を表示します 複数のバー を オプションで 1本のろうそく足に結合 できます:全体像を把握するのに役立ちます 多機能 ユーティリティ #1 : 65以上の機能、このインジケーターを含む | 質問はこちら まで | MT5版 入力設定で、将来のバーに使用する 時間軸 を選択してください: 現在価格の右側に、指定した間隔で形成中のバーが表示されます。 設定で有効にすると、選択したバーの終了までの カウントダウン が右下に表示されます。 役立つ場面: 複数の時間軸を使用する場合; 異なる期間から全体像を確認する場合; トレード設定の追加確認として; 色は手動で設定するか、自動検出(現在のテーマと同じ)できます。
Description:
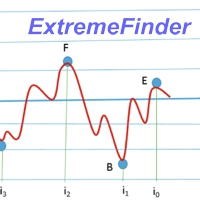
ExtremeFinder analyze chart and find local extremes - maximum and minimum. Searched extreme is always of opposite type then previous. Local extreme is confirmed when price difference is higher then set price difference, but not sooner then after set number of candles. Two different types of Local extreme confirmation are performed: Normal for common Price changes, Quick for steep Price changes. Price difference to confirm local extreme can be set as absolute value, in percent of lo
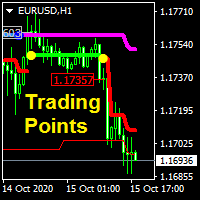
This indicator analyzes price in both current and larger timeframes to generate trendline, trading signals and take profit level. It can work on any financial instruments or securities. Features: Trend line, trend line is a 2 colors scheme thick line, blue line denotes uptrend and pink line for downtrend. Trading line, trading line is a 2 colors scheme thick line, green line denotes buy signal and red line for sell signal. Price label, the label shows the beginning price of new trading signal.
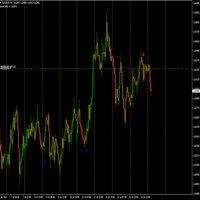
This indicator what the name says! it captures the biggest moves weekly on the 4 hour tine frame. This indicator can be used on any pair and any time frame but the 4 hour is most reliable. It works best before high impact news releases, check forexfactory.com to get when high impact news releases are happening. Its simple to use, just trade when you see the arrows appear.

Primary Trend is a handy tool if you are used to trading on a clean chart, but sometimes you need to take a look at Primary Trend. The Primary Trend indicator studies price action as a collection of price and time vectors, and uses the average vector to determine the direction and strength of the market. This indicator highlights the short-term direction and strength of the market. The indicator is not redrawn. The indicator implements a breakout strategy. The arrows show the direction of the ma

The Your Chance indicator studies price action as a collection of price and time vectors, and uses the average vector to determine the direction and strength of the market. It also estimates the market trend based on rough measurements of price movement. This indicator is confirming and can be especially useful for traders looking for price movements. This indicator highlights the direction and strength of the market and can be used to trade price fluctuations.

Unexpected Decision is a trend indicator that uses an original calculation algorithm. This is a new product that allows you to identify the current market phase (uptrend, downtrend or flat). The indicator is applicable for any data and periods. The middle of the trend wave, as well as the edges, are places of special heat and market behavior; when writing the indicator, an attempt was made to implement precisely finding the middle. This indicator paints arrows in different colors depending on th

Trend Analytics is a technical analysis indicator that allows you to determine with sufficient probability when a trend and its direction or flat prevail in the foreign exchange market. The indicator is built on special algorithms. The dignity of which you see in the screenshots. The indicator can work on any timeframe, but to minimize the likelihood of false signals, you should set a timeframe from H15 and higher. In this case, you should use a small stop loss to protect against false signals.

Stochastic indicator timeframe optional simple adaptable strategy Possibility to set other time frames. Displays the signal, value, time frame that is set. BUY strategy> time frame setting D1 or H4 We trade on the H1 time frame If the signal is BUY, we are looking for shops to BUY We are looking for the lowest support SELL strategy> time frame setting D1 or H4 We trade on the H1 time frame If the signal is SELL, we are looking for trades on SELL We are looking for the highest resistance Als

Here's a technical brief for the Austin-Bat-Indicator:
The Austin-Bat-Indicator is a sophisticated trend-following indicator designed for MetaTrader 4 (MT4) platforms. It aims to provide stable trend identification by filtering out market noise and adapting to market volatility.
Key Features: 1. Dual Moving Average System: Utilizes a fast and slow moving average for trend determination. 2. Customizable Parameters: Offers extensive customization options for smoothing periods, price types, and m

EZT Bollinger Trendline
Indicator based on multiple settings of Bollinger Band. In the menu you can choose the similar settings than bollinger band indicator. Trend period and trend deviations. Also paint and arrow on chart when direction change. Three different kind of alert , such as pop up, e-mail and push notification. Try different settings on different timeframes.
Please help my work and rate and comment my products!
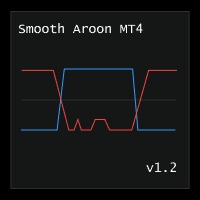
Smooth Aroon MT4 is a version of the Aroon Up and Down with smoothing and filtering.
Features :
Smoothing : You have smoothing from 0 to 99 . To smooth a signal, find the maximum value of the points in question then set the smoothing level above the maximum value. For example : If you want to smooth all signals below 30, then you should set the smoothing level above 30 This also smooths all signals above 70, since the Aroon Up and Down Oscillates between 0 and 100. Filtering : If you only

I present to you an indicator for manual trading on DeMark's trend lines. All significant levels, as well as the indicator signals are stored in the buffers of the indicator, which opens the possibility for full automation of the system. Bars for calculate (0 = unlimited) - Number of bars to search for points DeMark range (bars) - Shoulder size to determine point
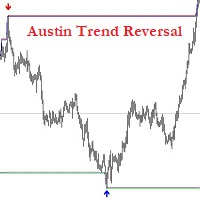
Introducing the Austin Trend Reversal Indicator: Your Key to Identifying Profitable Market Reversals.
The Austin Trend Reversal Indicator is a revolutionary MetaTrader 4 tool designed to provide traders with reliable signals for trend reversals. Powered by advanced techniques and algorithms, this non-repainting indicator offers unparalleled accuracy in pinpointing potential turning points in the market.
Key Features: 1. Non-Repainting Signals: The Austin Trend Reversal Indicator provides non-r

The IndicatorPivot indicator is suitable for using forex trading strategies designed for intraday trading. "IndicatorPivot" displays on the price chart of a currency pair the Pivot level (average price for the current day) and the three closest support and resistance levels, calculated based on Fibonacci levels. The "Indicator Pivot" indicator uses Fibonacci levels to solve the problem of building support and resistance levels in Forex trading. This indicator is very easy to understand and to ap

The PatternMMB trading indicator finds the most common candlestick analysis patterns and provides trading recommendations based on them. The PatternMMB trading indicator is designed to search for candlestick patterns on the price chart and issue trading recommendations depending on the nature of the found candlestick pattern. It is also possible to send sound notifications when all or any of the selected patterns appear, with an explanation of the pattern and its interpretation. In addition, th
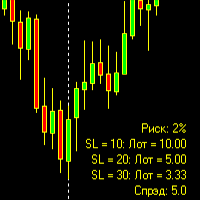
インジケーターの情報パネルには、指定した数のパラメーターが表示されます。設置場所に応じて、いずれかのコーナーに情報が表示されます。 つまり、取引を開始する必要がある場合は、情報パネルを見て、SL値のある行を見つけ、配置するロットを確認する必要があります。 インジケーターの情報パネルには、指定した数のパラメーターが表示されます。設置場所に応じて、いずれかのコーナーに情報が表示されます。 インジケーターは、それ自体で取引することなく情報を表示するだけです。 つまり、取引を開始する必要がある場合は、情報パネルを見て、SL値のある行を見つけ、配置するロットを確認する必要があります。 インジケーターの情報パネルには、指定した数のパラメーターが表示されます。設置場所に応じて、いずれかのコーナーに情報が表示されます。 インジケーターは、それ自体で取引することなく情報を表示するだけです。 つまり、取引を開始する必要がある場合は、情報パネルを見て、SL値のある行を見つけ、配置するロットを確認する必要があります。

This is a simple trend indicator. It draws the arrows live and shows when the potential trend starts or ends. It is separated by my indicator for positions on the trend direction Cross MAs Trend Entry , so that you can use it practice with it and get more familiar with my strategies. Note : the indicator does not redraw arrows, it works absolutely live and for every period and simbol ( it is most optimized for M5 )
It has simple input parameters, the default values are optimized for M5 for most

The reason why many traders new to using the Fibonacci retracement tool find it hard to effectively use it is because they are having trouble identifying swing points that are significant enough to be considered.
Main Features Show Fibonacci number with LL to HH in multitimeframe
Show 23.6,38.2,50,61.8,78.6,88.6,100,112.8,127.2,141.4,161.8,200,224,261.8,314,361.8 and 423 of Fibonacci number
Easy to use with simple interface. Real time information for the Fibonacci number .
Settings Global Sett
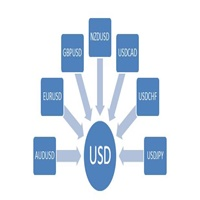
The USDIndex is the USD dollar index, which is integrated for the seven currencies of AUDUSD, EURUSD, GBPUSD, NZDUSD, USDCAD, USDCHF and USDJPY. Through this index, the direction of USD overall trend can be intuitively understood. The USDIndex works better with other indexes in combination. For example, the combination of USDIndex and AUDIndex can directly reflect the trend of currency AUDUSD. It is easy to understand that the currency AUDUSD is split into two indices, one is the USDIndex and
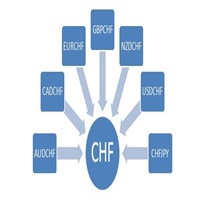
The CHFIndex is the Swiss franc index, which is integrated for the seven currencies of AUDCHF, CADCHF, EURCHF, GBPCHF, NZDCHF, USDCHF and CHFJPY. Through this index, the direction of CHF overall trend can be intuitively understood. The CHFIndex works better with other indexes in combination. For example, the combination of CHFIndex and JPYIndex can directly reflect the trend of currency CHFJPY. It is easy to understand that the currency CHFJPY is split into two indices, one is the CHFIndex an
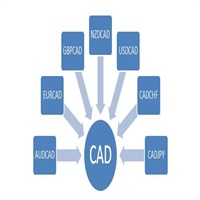
The CADIndex is the Canadian dollar index, which is integrated for the seven currencies of AUDCAD, EURCAD, GBPCAD, NZDCAD, USDCAD, CADCHF and CADJPY. Through this index, the direction of CAD overall trend can be intuitively understood. The CADIndex works better with other indexes in combination. For example, the combination of CADIndex and EURIndex can directly reflect the trend of currency EURCAD. It is easy to understand that the currency EURCAD is split into two indices, one is the CADInde
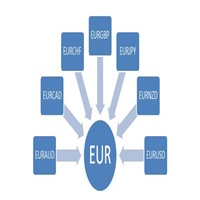
The EURIndex is the Europe dollar index, which is integrated for the seven currencies of EURAUD, EURCAD, EURCHF, EURGBP, EURJPY, EURNZD and EURUSD. Through this index, the direction of EUR overall trend can be intuitively understood. The EURIndex works better with other indexes in combination. For example, the combination of EURIndex and CHFIndex can directly reflect the trend of currency EURCHF. It is easy to understand that the currency EURCHF is split into two indices, one is the EURIndex
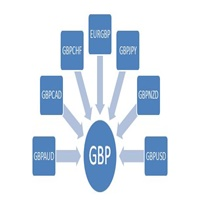
The GBPIndex is the Pound index, which is integrated for the seven currencies of GBPAUD, GBPCAD, GBPCHF, GBPJPY, GBPNZD, GBPUSD and EURGBP. Through this index, the direction of USD overall trend can be intuitively understood. The GBPIndex works better with other indexes in combination. For example, the combination of GBPIndex and NZDIndex can directly reflect the trend of currency GBPNZD. It is easy to understand that the currency GBPNZD is split into two indices, one is the GBPIndex and the
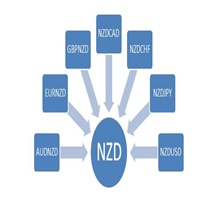
The NZDIndex is the Pound index, which is integrated for the seven currencies of AUDNZD, EURNZD, GBPNZD, NZDCAD, NZDCHF, NZDJPY and NZDUSD. Through this index, the direction of USD overall trend can be intuitively understood. The NZDIndex works better with other indexes in combination. For example, the combination of NZDIndex and GBPIndex can directly reflect the trend of currency GBPNZD. It is easy to understand that the currency GBPNZD is split into two indices, one is the NZDIndex and the
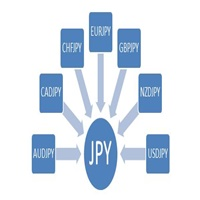
The JPYIndex is the YEN index, which is integrated for the seven currencies of AUDJPY, CADJPY, CHFJPY, EURJPY, GBPJPY, NZDJPY and USDJPY. The JPY Index works better with other indexes in combination. For example, the combination of JPYIndex and AUDIndex can directly reflect the trend of currency AUDJPY. It is easy to understand that the currency AUDJPY is split into two indices, one is the JPYIndex and the other is the AUDIndex. Through the analysis, it can be intuitively found that, in a

Pattern Trader No Repaint Indicator
MT5 Version of the indicator: https://www.mql5.com/en/market/product/57462 Advanced Chart Patterns Tracker MT4: https://www.mql5.com/en/market/product/68550
I ndicator searches for 123 Pattern, 1234 Pattern, Double Top, Double Bottom Patterns , Head and Shoulders, Inverse Head and Shoulders and ZigZag 1.618 Pattern.
Pattern Trader indicator uses Zig Zag Indicator and Improved Fractals to determine the patterns. Targets and Stop Loss Levels are defined by

Description
SuperCCI is an indicator based on the standard CCI indicator. It identifies and displays convergences/divergences in the market and forms the corresponding entry points. Also, using the trading channel index, it determines the direction of the trend and displays the levels of support and resistance .
Features Not repaint. Shows entry points. Shows the direction of the current trend and support/resistance levels. Has notifications. Recommendations
Use convergence/divergence to ide

FXC iCCI-DivergencE MT4 Indicator
This is an advanced CCI indicator that finds trend-turn divergences on the current symbol. The indicator detects divergence between the CCI and the price movements as a strong trend-turn pattern.
Main features: Advanced divergence settings
Price based on Close, Open or High/Low prices Give Buy/Sell open signals PUSH notifications
E-mail sending Pop-up alert Customizeable Information panel Input parameters: CCI Period: The Period size of the CCI indicator.
CCI Ap

You cannot predict 100% where the price will go ... However, having a better price zone to open a trade when there is a trading signal always puts you in a better position.
Indicator "PivoZone" is based on the author's method for determining price reversal-continuation zones. Indicator supports all timeframes with clear visualization on the chart. Unlike standard pivot points, it takes into account the volatility of an asset and allows for a better definition of the market entry zone. Suitable

This gives you many opportunities and gives you beautiful goals in a short time that you can see for yourself and this indicator depends on the foundations and rules of special knowledge It also gives you entry and exit areas with very good and profitable goals This is an indicator that I have been training on for a long time The results were more than impressive

FXC iDeM-DivergencE MT4 Indicator
This is an advanced DeMarker indicator that finds trend-turn divergences on the current symbol. The indicator detects divergence between the DeMarker and the price movements as a strong trend-turn pattern.
Main features: Advanced divergence settings
Price based on Close, Open or High/Low prices Give Buy/Sell open signals PUSH notifications
E-mail sending Pop-up alert Customizeable Information panel Input parameters: DeM Period: The Period size of the DeMarker in

The Supertrend indicator available on the MQL5 Market for MetaTrader 4 is an exceptional tool for traders seeking to identify prevailing trends in specific trading instruments. This indicator boasts two built-in indicators, Average True Range and Standard Deviation, allowing traders to choose the most suitable indicator based on their preferred trading strategy. Additionally, users can customize the period of these indicators and select the price (Close, High, Low, Open, Weighted) to which it s

This indicator Super Turbo indicator.Indicator displays trend movement. Indicator calculates automatically line. Features
FiltPer - displays indicator period. Step - displays indicator Step. Trend - displays indicator trend (true/false). X - move the trend left and right.
Y - move the trend up and down.
How to understand the status:
If the Trend color is green, trend is up.
If the Trend color is red, trend is down.
///////////////////////////////////////////////////////////////////////////

Indicator user manual: https://www.mql5.com/en/blogs/post/741402
A moving average is a widely used technical indicator and it often acts as dynamic support or resistance. MA bounce is useful tool based on this technical indicator. It can be used as proximity sensor , so you will get alert when price is near selected moving average. It can be used as bounce indicator as well, and you will get non-repainting BUY/SELL arrows, when there is high probability of a price bounce from

Hi. The main obstacle for multi timeframe traders or traders who use multiple indicators on multiple charts is when they want to do analysis on multiple pairs quickly. You can imagine if there are 3 or 10 charts that must be opened when you want to do analysis. and each chart has its own template. of course it will take a long time to replace one by one before analysis. how many opportunities are lost due to the time spent changing charts. or maybe when a mentor wants to explain to his students

This indicator watch the Fibonacci retracement for levels and timeframes selected by the trader. In the workload of day trading, having your eyes on all the timeframes to validate some information, for Fibonacci traders, is really time consuming and requires constant focus. With this in mind, this tool allows you to have your attention on other trading details while this one monitors the retracements of each timeframe in real time. In the charts, this indicator data (retracement %, age of the r

Positon index is the cyclical index of market trend movement, and Positon's value ranges from 0 to 100. When Positon value is below 10, it means that the market is in extreme decline, the market atmosphere is extremely pessimistic, and the market is about to hit bottom and turn around. When Positon value is above 80, it means that the market is in extreme excitement, the market atmosphere is extremely bullish, the market is about to peak and there is a sharp decline.
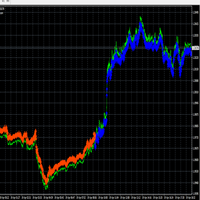
忍耐はストレスのないスキャルピングの鍵です。 200の移動平均を通過するのを確認したら、矢印をトレードし、移動平均フィルターを使用せずに、最後のスイングポイントから拡大またはトレンドを作成します。 1分間の時間枠に最適で、日中の動きの勢いを捉えます。 トレーリングストップを使用して、簡単に20ピップを取るか、より大きなトレンドのために長く滞在します。 この指標からの本当に大きな取引の写真の例を見てください。 1分の時間枠が最適です。 ズームアウトしてトレンドを確認します。 矢印は再描画または再計算されません。 1分の時間枠に添付して取引を調査し、それが戦略に使用できるかどうかを確認します。
私
ルール:
購入のための青 販売のための赤 横向きの期間を避けてください 大量の取引と勢いの取引 ストップロスを使用する

This is a combination of 3 customized indicators, to make chart clean, we only showing up or down arrows. This gives good result in 1 hour and above time frames. In one hour chart, please set sl around 50 pips. Once price moves into your direction, it would be good to trail your sl by 30 to 50 pips to get more profit as this indicator kinda trend follower. In four hour chart, set ls around 100 pips. Works in all major pairs and winning ration is around 70 % based on back test in mt4.

How to use this indicator is simple.
Please look on pictures. Please use Pending Limit order only.
Set Pending order according line, with Take Profit and Stop Loss base on line. example1: Put pending order Sell Limit 1 on the line of Sell Limit 1 and Take Profit on Take Profit 1 line, Stop Loss on Stop Loss line...skip... example2: Put pending order Sell Limit 5 on the line of Sell Limit 5 and Take Profit on Take Profit 3,4,5 line, Stop Loss on Stop Loss line.
and do to opposite buy limit ord

This is indicator for checking your trades. Please see the pictures attachment, the indicator show info about: - Breakeven Level; - Margin Call Level; - Two volume info, past and current (With color exchange base on the past volume); - Spreads; - Swap Long and Swap Short (With color change, positive and negative swap); - Running Price; -Today High Low Pips; - Today Open to Current Running Price pips.
This indicator not for trading entry, only to assist your trade management
Regards

The Alpha Trend Experience the cutting-edge in trend analysis. The Alpha Trend doesn't just identify trends—it filters out the noise, focusing only on the primary movements of price. Whether you're a Binary Option pro or a scalping enthusiast in the Forex world, this tool is tailored for you. Here's the secret: The initial thrust of a major trend often sets its enduring direction, irrespective of the minor fluctuations within. With Alpha Trend, you can decode this momentum, pinpointing the most
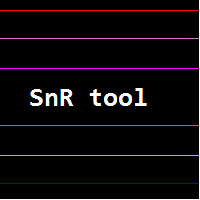
This is a SnR tool.
It is built based on the body candle.
It is a multi timeframe indicator.
There is a powerful scalabar for vertical line slides to limit the candle bars.
Color for each line can also be changed.
It can detect:
1. Support && Resistance
2. Support become Resistance && vice versa
3.Support become Resistance become Support && vice versa
It also can be used for trading tools and studies on SnR *New Version avaiable

Zip Trend This is a hybrid trend indicator as it is based on average true range signals that determine the range of low and high price fluctuations, as well as closing prices. As a result, it indicates the current market volatility. The indicator of the oscillator family is also used. The indicator helps to calculate the oversold and overbought levels of a trading instrument.
This indicator allows you to find the most likely trend reversal points. When the trend changes, the Zip Trend indicato

The Trends Definitive indicator does not redraw and does not lag, it shows points for entering the market, points of potential market reversal. Uses one parameter for settings.
Currency pairs never rise or fall in a straight line. Their ups and downs are interspersed with pullbacks and reversals. Every rise and every fall is reflected in your emotional state: hope is replaced by fear, and when it passes, hope appears again. The market uses your fear to prevent you from taking advantage of a st

The Trrend indicator tracks the market trend while ignoring the sharp market fluctuations and noise around the average price. It catches the trend and shows favorable moments of entering the market with arrows. The indicator can be used both for pipsing on small periods and for long-term trading. The indicator implements a kind of technical analysis based on the idea that the market is cyclical in nature. Simple, visual and efficient trend detection. The indicator does not redraw and does not l

Time Range Pivot Points is an indicator that will plot Pivot Point + Support and Resistance levels on the chart, but it will calculate the formula based on a specific time range, that can be defined in the settings. If you want to successfully trade the European and US sessions it will be smart to check all levels generated by the Asian session time range. This indicator will allow you to do that. Everything is designed to get you an advantage of the potential support and resistance levels for t

This is a very complex indicator that calculates resistance and supportlevels. When the calculation is done, it merges levels that are close to eachother. It support different timeframes, simply by changing timeframe.
Features: See support and resistance levels Alarm can be set off when price enters a support/resistance zone Different timeframes
See screenshots for visual.

BeST_ADX Scalping Strategy is an MT4 Strategy of an Entry and Exit Signals Indicator based on the ADX values that is an excellent tool for scalpers to scalp the currency market multiple times a day for profit .
It is built mainly for scalping purposes although it can also be used as a breakout indicator . Its Signals produce a complete and standalone trading system of impressive results . The indicator comes with a new enhanced Real Time Updated Info and Statistics Panel that can improve its ove

This system never paints. This system created by using Envolpes bands and parabloic Sars. This indicator is only working in M5 period and EURUSD Symbol. This system is for long term and profitable. Signals are shown as arrows. as an optional limit orders. You can set a voice alarm or email notification. You can fins our other products from link : https://www.mql5.com/en/users/drbastem/seller Also, you can ask all your questins from email : haskayafx@gmail.com or mobile : +90 530 8

Description Complete breaker market maker Key zones indicator, It provides precise zones where could be an excellent break or reversal opportunity. KEY LINKS: How to Install - Frequent Questions - All Products How is this indicator useful? It will allow you to trade retracement or breakout patterns, every time they occur in a given zone. NEVER repaints. It signals clear possible money management levels as stop and take profit. You’ll be able to identify potential resistance or support lev
MetaTraderマーケットが取引戦略とテクニカル指標を販売するための最適な場所である理由をご存じですか?宣伝もソフトウェア保護も必要なく、支払いのトラブルもないことです。これらはすべて、MetaTraderマーケットで提供されます。
取引の機会を逃しています。
- 無料取引アプリ
- 8千を超えるシグナルをコピー
- 金融ニュースで金融マーケットを探索
新規登録
ログイン