YouTubeにあるマーケットチュートリアルビデオをご覧ください
ロボットや指標を購入する
仮想ホスティングで
EAを実行
EAを実行
ロボットや指標を購入前にテストする
マーケットで収入を得る
販売のためにプロダクトをプレゼンテーションする方法
MetaTrader 4のための新しいテクニカル指標 - 103

Identify Take - trend trading strategy, market noise filtering and all necessary functions built into one tool! The system itself shows in the form of arrows when to buy and when to sell. Uses only one setting parameter. Simple, visual and effective trend detection.
The intelligent algorithm of the Identify Take indicator shows the points of a potential market reversal. Most often, a good trend can be seen visually on the price chart. But an experienced trader must clearly understand the curr
***** The REAL , ORIGINAL, Non-Repainting, Non-Delaying, Arrow Trade Entry indicator for Very Low-Risk market execution *****
***This is the Golden standard in arrow indicators for MT4.*** BING Setup Arrows Indicator(BSA) will show easy-to-read High Probability trading situations with Non-Repainting , Non-Delaying , Up or Down arrows on the graph. So simple, it's brilliant. Always shows very good trading setups, no flashy colors, confusing configurations, hard-to-read dashboards, etc. Perfe

We Trade Live Trend Levels This indicator is a fantastic addition to the We Trade Live Trend Max this helps filter out noise and helps with better entries into a trade this add on is a must have and we use it all the time along side We Trade Live Trend Max this is a fantastic tool to help with entering a trade and exiting a trade, This indicator Calculates Volume strength indicating levels of support and resistance for a trade, measures momentum in a market making buying or selling into the
FREE

We Trade Live Trend Candle Stick can help identify potential trend in the market when trading, spot market trends and predict future prices. We Trade Live Trend Candle Stick has a smoother look, as it is essentially taking an average of the movement. candles will stay RED during a downtrend and Green during an uptrend . We believe It's useful for making candlestick charts more readable and trends easier to analyse. As a breakout trader you are looking for trades that are ‘breaking out’ of
FREE
Being flat is a position taken by a trader in Forex trading when s/he is unsure about the direction of currencies trading in the market. If you had no positions in the U.S. dollar or your long and short positions canceled each other out, you would be flat or have a flat book
A flat market is one where there is little price movement; the market typically trades within a tight range, rather than forming a clear up or down trend. This indicator shows potential fl

The Better Volume indictator improves the comprehension on volume by coloring the classical histogram bars . The colors point out differents nature of volume . Further through two buttons and without change the main chart it is possibile to change the time frames and navigate among three symbols . The alerts will work accordingly. For each symbol can be choosed the LookBack and Ma periods . The possibility to show/hide the indicator allows you to focus on the price .
The subwindow can be hid

Trend and Signals indicator scans 30 trading Instruments (Forex, Metals and Indices). It uses special algorithm on the current market based on Pure Price Action and display the overall trend and signal on the dashboard. When signals are produced the indicator sends alert and notification. Strategy for Signals This indicator uses the daily timeframe to determine the direction of the trend. The hourly timeframe is used to identify possible entries. Main trend and is determined by strong Bull
Индикатор производит поиск различных паттернов и сортировку рыночной информации.
Полученную информацию фильтрует и выводит на экран, обновляя ее с заданной периодичностью.
Имеется возможность сохранять собственные списки инструментов.
Имеет сортировку по:
названию инструмента; типу инструмента; по диапазону значений от N до M; выделенным в ручную маркерам;
Важно!!! Индикатор спроектирован так, чтоб была возможность
добавлять новые паттерны и значения для сортировки.
Если вам необход
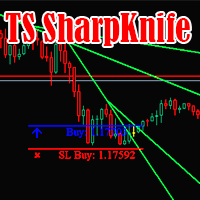
The SharpKnife trading strategy is formed into one indicator. The indicator informs with a message (Alert or mail) about the need to make deals.
Check it out in the strategy tester right now! Support: https://www.mql5.com/en/channels/TrendHunter The indicator is completely ready for operation immediately after installation.
Can be used on any trading instrument.
Recommended for use on timeframes 1H and higher. Settings: Signal Trend direction - Alert of the trend direction; Number of last

The Signal Point Channel indicator predicts the most likely short-term price movement based on complex mathematical calculations. One of the biggest challenges traders face is finding a trading system that's right for them. This indicator is designed to detect trends in price movement and allows you to quickly determine not only the direction of the trend, but also to understand the levels of interaction between buyers and sellers. It has no settings and therefore can be perceived as it signals.
For metatrader 4 - MT4 version
There are 2 oscillator plots - fast & slow. Fast plot shows the price location with in the medium term channel, while slow plot shows the location of short term midline of cycle channel with respect to medium term channel.
Usage of this is similar to %b oscillator. The slow plot can be considered as the signal line. This makes use of the default 10/30 values of Hurst Cycle Channel, but may need tuning for your instrument.
This indicator can also be used t

WHAT IS NEXT MOVE? SIMPLE ANSWER IS, THIS PROGRAM IS BASED ON PRICE ACTION THEREFORE FINDING NEXT MOVE IS EASY TO IDENTIFY THIS PROGRAM IS USING STANDARD CALCULATIONS FOR SUPPORT RESISTANCE IN SHAPE OF 2 WAYS TREND LINES SELECT HORIZONTAL LINES TREND LINES WILL GUIDE TRADERS TO TRADE IN RANGE WITH PIVOT LEVEL ALSO HORIZONTAL LINES GUIDE YOU ABOUT SUPPORT RESISTANCE OF DIFFERENT TIMEFRAMES FOR EXAMPLE: IF TRADER INTERESTED TO TRADE IN 15 MINUTES TIME FRAME, THEN HE CAN SELECT 15 MINUTES IN PR
FREE

SETIS TREND FILTER is a multi timeframe sophisticated MT4 indicator, created by french professionnal traders and quants experts , in order to detect the best trades for any markets (forex, commodities, indexes, stocks, cryptos and so on...)
Quantums France , is a french start-up, that codes advanced trading solutions, both for retails such MQL4 indicators but also python experts advisors for sophisticated investors.
This indicator does not repaint and actualize its functions in realtime .

A ratio between 0 and 1 with the higher values representing a more efficient or trending market, It is used in the calculation of Perry J. Kaufman Adaptive Moving Average (KAMA), dividing the price change over a period by the absolute sum of the price movements that occurred to achieve that change. The Fractal Efficiency or also known as Efficiency Ratio was first published by Perry J. Kaufman in his book ‘Smarter Trading‘. This is mostly considered a filter for volatile markets none the less
FREE

LE Oscillator - индикатор предназначенный для поиска локальных экстремумов, определения текущей тенденции. В расчетах индикатора используется авторская методика. С помощью индикатора можно определять места возможного разворота цены желательно в направлении тенденции, но также с достаточной точностью и против нее. Также с помощью индикатора можно определять текущую тенденцию. Индикатор подходит для любых валютных пар, но для адекватного отображения показания необходимо, чтобы было достаточно ис

Индикатор для синхронизации и позиционировании графиков на одном и более терминалах одновременно. Выполняет ряд часто необходимых при анализе графиков функций: 1. Синхронизация графиков локально - в пределах одного терминала при прокрутке, изменении масштаба, переключении периодов графиков, все графики делают это одновременно. 2. Синхронизация графиков глобально - тоже самое, но на двух и более терминалах, как МТ4, так и МТ5. 3. Позиционирование графика на заданном месте при переключении периодо
FREE

The Alpha Trend Experience the cutting-edge in trend analysis. The Alpha Trend doesn't just identify trends—it filters out the noise, focusing only on the primary movements of price. Whether you're a Binary Option pro or a scalping enthusiast in the Forex world, this tool is tailored for you. Here's the secret: The initial thrust of a major trend often sets its enduring direction, irrespective of the minor fluctuations within. With Alpha Trend, you can decode this momentum, pinpointing the most

This is Command Prompt(CP) for MT4. By using this,you can access info that only brokers and programmers can access. For example,do you know your freeze level,margin mode,or how much memory used by MT4? Knowing these info,you can improve your trading.
How to Use Type following commands into command prompt box(Shown in photos.) and press Enter. For example,if you want to know maximum permitted amount of a lot,then type "maxlot". By typing "info",CP will show all commands available. By typing "he
This Indicator can help you to identify your entry. Enter when the arrow appears. The Indicator shows you as well the trend direction. you can see at the attached image the profit you would have made. If the trend goes against you it shows the minus pips. The Indicator is working on all frames and all pairs. Please consider carefully before you enter as the FX Market is unpredictable.

Besides signals in form of Percent on the chart, the system also gives MT4 alerts when an entry signal is generated.
The original rules of the system say that you should simply follow the signals. However, if trading would be really that simple then you could simply program an expert advisor based on the mechanical signals of this system.
But as every experienced trader knows, trading is not that simple. The real edge will come from the trader who uses the system. With time the trader ha
Telegram Channel & Group :https://t.me/joinchat/sdHZOjGc9V0xYjQ0
V.I.P Group Access: Send Payment Proof to our Inbox https://easypippin.com/ The Easypippin collector indicator gives u a indication of direction,based on several settings all put together to make it Easy to detect where the market possible is going to. The indicator gives u a X inthebox and a X , if u see them painting together the possible direction is strong. The indicator also can be used as a support and resistence zone.

The MA is a simple tool that smooths out price data by creating a constantly updated average price . The average is taken over a specific period of time. This is a Multi Time Frame Exponential Moving Averages indicator. It made for a M5 TF and shows a Moving Average data from H1 (white line) and M15 (magenta line). If a M15 EMA crossed a H1 EMA from bottom up then you may go Long. If a M15 EMA crossed a H1 EMA from top down then you may go Short.
----< High Accuracy Entry Signals and Trend Indicator >----
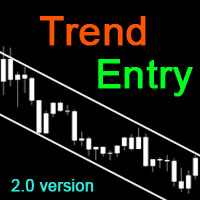
TrendEntry could tell you the trend direction, resistance and support, when to open orders and where to set stoploss & takeprofit. this is a multifunctional indicator, can work well on all symbols and timeframes.
Features:
real-time analysis of trend direction filter out all the minor waves show resistance and support along as price goes give highly accurate entry signals frequently send alert in popup, email, notification way a

Simply the " Wilder Exponential Moving Average " An exponential moving average with a somewhat different formula. It is one of the most common and widely used moving averages on various trading platforms. It can be used on all symbols, from forex to indices, it has a single parameter with a default value of 10 It can also be used within expert advisor, I hope it will be useful.

This indicator plots a moving average in 2 colors: Green if the slope is bullish Red if the slope is bearish NB: if the last value of the moving average is equal to the previous one, the color will be red. You can obviously edit the Period of the moving average, the width, the MA mode (Simple, Exponential, Smoothed and Linear Weighted) and the MA price (Close, Open, High, Low, Median Price, Typical Price, Weighted Close).
FREE

Akendicator X is a Non-repainting Indicator for trading at 5-15 minutes Timeframe. Akendicator X extimates with clear arrows, in which direction the next candlestick will move. Pratically, when the length of the last candle reaches and exceeds a particular value (called Candle Power) immediately, after its closing, an arrow appears indicating whether the next candle could be Bullish or Bearish. I created a manual in pdf where you should learn exactly how to use AKENDICATOR X correctly; I will s

---------------------------------------------------------------------------------------- Double Stochastic Candle Changer ---------------------------------------------------------------------
Features Find overbought and oversold situations Trading always trading towards the trend *Non-Repainting* For Desktop MT4 Only *Great For Scalping *Great For Swing Trading *Arrow Entry Alerts *Mobile Alerts *Works On Any Timeframe *Works On Any Mt4 Pair
Basic Strategy Look for shorts when the price

ADR反転インジケーターは、通常の1日の平均レンジに関連して価格が現在取引されている場所を一目で示します。価格が選択した平均範囲とレベルを超えると、ポップアップ、電子メール、またはプッシュを介して即座にアラートを受け取るため、プルバックと逆転にすばやくジャンプできます。インディケータは、チャート上に1日の平均レンジの極値で水平線を描画し、それらを超える価格の数学的確率が付加されているレベルを超える延長も描画します。詳細については、以下をご覧ください... インジケーターとモニターを補完するADRアラートダッシュボードここでも利用可能なすべてのペア:https:// www.mql5.com/en/market/product/62756
MT5バージョンはこちらからも入手できます:https:// www.mql5.com/en/market/product/64477/
通常の1日平均レンジ(ADR)内で価格が取引され、これらのレベルを上回っている時間の約60%は、通常、その後の引き戻し(利益確定)の動きを伴う急激な価格の動きの指標です。毎日の範囲の上部または下部からの

どうもこんにちは! 私は日本の個人投資家のタツロンです。FXで10億円以上運用していました。 そこで、私が使っていてとても便利なインディケータをご紹介しましょう。
環境確認型インディケーター。 世界のマーケットが意識するpivotをデイリーとマンスリーの二つに絞りました。 デイリーは1日のトレードの目安になり、マンスリーはスピードの速いブレイク相場でブレイクまたは反転の材料となります。 自信のトレンドラインと重なった場合など、根拠の積み上げとして役に立ちます! 他のインディケーターと一緒にお使いください!
日本語のスクリーンショットのサポートが必要な場合は、 こちら をご覧ください。 実際にインディケータが動いている動画もありますのでご確認ください。 Jpivotは1:48付近からスタートします。
FREE

どうもこんにちは! 私は日本の個人投資家のタツロンです。FXで10億円以上運用していました。 そこで、私が使っていてとても便利なインディケータをご紹介しましょう。
相場の基軸となるインディケーター。 ThreeLine(スリーライン)は、移動平均線(SMA)を改良し長期のSMAの数値設定に答えを出しました。 日々のトレードや検証を繰り返すほど、このThreeLineの信頼感は増していくことでしょう。 ThreeLineの角度が上向きなら白くなります。下向きならそれぞれの色です。 視野的にも上げ、下げ、がわかりやすいので、相場の環境も一目で確認できます。
長期用の移動平均線(SMA)の数値はどのように設定すればよいのか。 そういった悩みから解放されます。 ブレイクアウト手法や、カウンタートレンドも狙いやすいです。 トレード、インディケータの基本でもあるSMAはこの ThreeLineにお任せください。
日本語のスクリーンショットのサポートが必要な場合は、 こちら をご覧ください。 実際にインディケータが動いている動画もありますのでご確認ください。 ThreeLineは1:12
FREE

Extended version of the indicator of the same name. Optimized work order. Added settings to the indicator menu for finding accurate signals. There are separate settings for Buy and Sell.
Scalper indicator designed for accurate entry into trade transactions. Designed for intraday and medium-term trading on any instrument. The indicator does not redraw and does not lag. There is the possibility of visual and sound notification of the appearance of a signal to enter. The indicator also sends sig
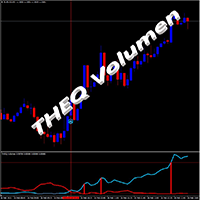
THEQ Volumeは、正確なボリュームオシレーターを表示します。次のトレンドまたは起こりうるトレンド変化を取引するために使用できます。 THEQ Volumeには、THEQ Volume Arrows、シグナルとアラートを備えたインジケーター、および実際の/デモ、バックテストと最適化、または独自の戦略を作成するためのTHEQ VolumeEAも含まれています。 追加のインジケーターとロボットEAは、支払い後に別々に出荷されます。 THEQボリュームは再描画せず、ラグがなく、キャンドルが閉じても信号が消えることはありません。 また、準備が整い、市場に迅速に参入するための事前シグナルもあります。 マニュアルと最適な設定インジケーターとEAを使用して、必要なときにいつでもサポートとヘルプを利用できます。新しいバージョンは常に最初の支払いに含まれています。 チップ: -EURUSDペアとM5TFの過去5年間を最も正確な方法(ティック)でバックテストして、購入したものがスクリーンショットやビデオと同じであることを確認します。 -EAが履歴データを読み取らないことを確認します。 -デモアカウン

VR Pivot - これは、主要なピボットポイント(pivot)の指標です。 ピボットポイントは、最強の価格帯を識別するために使用される特別なタイプのサポートレベル(support)と抵抗(resistance)です。プロのトレーダーは、価格の反転の高い確率がある価格を決定するために逆転のポイントを使用します.レベルは、特別な数式に従って計算され、終了、開口部、最大、前の期間の最小値の価格が考慮されます。最も効果的なのは、毎日の期間です。一見すると、これらのレベルに特別なものは何もないと思われるかもしれませんが、ピボットポイントのレベルの助けを借りて価格の動きを分析すると、ほとんどの場合、これらのレベルが良好で正確な結果を示していることがわかります。 テクニカルサポート、設定およびソフトウェアの体験版は、作者のプロファイルによりリクエスト できます。 逆転ポイントは、ピボットポイントとしてだけでなく、最大利益のために可能な限り効率的に使用できるレベルとして使用することができます, 損失を最小限に抑えるために損失を停止, リスクを軽減するために、損失ゾーンにポジションを転送. インジケ

このインジケーターは、ゴールデンクロス、デッドクロス、MACDに基づく太い青と赤のLINEのトレンドを示します。 パラメータ設定で自由に数値を調整できます(MA期間、MACD値)。 したがって、このインディケータ を取引通貨の種類や期間などに合わせてカスタマイズできます。このインディケータのデフォルトは、 USD / JPY M30 または H1 取引に適しています。 このインディケーターのデフォルトはUSDJPYに設定されています。 したがって、このインディケーターを他の通貨ペアまたは時間枠で使用する場合は、0.00037に変更してください。 使い方 青い線:上昇、購入 赤い線:下降、売り パラメータ(カスタマイズ可能) MAPeriod1(短期) MAPeriod2(長期) MACDBUY_Value(MACDは値を上回っています。) MACDSELL_Value(MACDは値を下回っています。) Audible_Alerts = trueまたはfalse
無料デモをダウンロードして、製品をチェックしてください! このインディケータに機能がさらに必要な場合は、お気軽にお

️️ Attention: There is a new update at 22-08-2024. What's new in this update? -* New strategy integration. -* The trade is with the price trend only. -* The success rate of trades has increased by a very large percentage. No more losses with this indicator, test it for years ago and see if there is losses in one day results. but before testing it please see the explaining video down here. FxBears Powers is working on all forex pairs, metals, commodities, futures, indices, energies,

Dark Oscillator is an Indicator for intraday trading. This Indicator is based on Counter Trend strategy, trying to intercept changes in direction, in advance compared trend following indicators. We can enter in good price with this Indicator, in order to follow the inversion of the trend on the current instrument. It is advised to use low spread ECN brokers. This Indicator does Not repaint and N ot lag . Recommended timeframes are M5, M15 and H1. Recommended working pairs: All. I nst

Arrow indicator without redrawing and delay The indicator shows the best trend entry points on the chart. It is better to use it in conjunction with other trend indicators as a filter. The indicator shows good results on lower timeframes. The signal is generated inside the candle and appears as blue and red arrows. Displays signals at the zero bar
Settings
Step : Calculation of bars in history
Bar : Shows bars in history
Delta : Offset of the signal from the candle

All-in-one trading powerhouse: trend, reversal, and exhaustion detection
This indicator is a personal implementation of the famous Traders Dynamic Index, which uses RSI, moving averages and volatility bands to find trends, reversals and price exhaustions. However, this particular implementation supports not only RSI, but many others. It is suitable for scalping, day trading, and swing trading and aims to provide a full picture of the current market conditions. [ Installation Guide | Update Gui

Fundamental Signals Indicator is a Non-Repaint Indicator with a powerful calculation engine that can predict market movement over 3000 pips (30000 points). The indicator does not analyze the market fundamentally, it is named fundamental because it can predict trends with large movements, no complicated inputs and low risk. Also Indicator can alert on market trend changes.
Using Indicator :
The Indicator is very simple and without complicated input parameters. (No need to optimize anythin

Индикатор Adapter определяет господствующую тенденцию, помогает анализировать рынок на выбранном временном интервале. Прост в настройке и работает на всех парах и всех временных интервалах.
Индикаторы тренда дают возможность классифицировать направление ценового движения, определив его силу. Решение этой проблемы помогает инвесторам вовремя войти в рынок и получить хорошую отдачу. Для любого трейдера крайне важно правильно определить направление и силу трендового движения. К сожалению, единст

Maltese cross GBP Универсальный инструмент для определения трендов, флетов и торговли по графическим паттернам. Объединяет техники Гана, Эллиота, Мюррея.
Просто разместите его на графике и он покажет направление и скорость движения цены, выделит разворотные моменты. Maltese cross поможет точно определять узловые моменты в истории, планировать торговые действия и сопровождать открытые сделки. Эта бесплатная демонстрационная версия MalteseCross ограничена GBPUSD и кроссами GBP. Никаких прочих
FREE
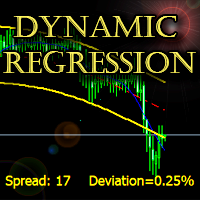
The indicator builds a dynamic regression channel with high accuracy without lagging.
Channel deviation is calculated using a unique formula and displayed on the graph.
Support: https://www.mql5.com/en/channels/TrendHunter
Can be used on any timeframe and any instrument. MT5-version: https://www.mql5.com/en/market/product/64257 Can be used as a ready-made trading system, as well as an addition to the existing one.
Settings: Fast Period - Fast smoothing period; Slow Period - Slow smoo

The Search for Reversal trend indicator can be used both for pipsing on small periods and for long-term trading. Indicator showing signals for entry. Displays both entry points and the trend itself. Shows statistically calculated times to enter the market with arrows. Using the indicator, you can optimally distribute the risk coefficient.
Uses all one parameter for settings. When choosing a parameter, it is necessary to visually resemble so that the corresponding graph has an excellent projec

The key difference between the Real Channel indicator and other channel indicators (for example, from the same Bollinger) is that the Real Channel takes into account not simple moving averages, but twice smoothed ones, which, on the one hand, makes it possible to more clearly determine the market movement, and on the other hand makes the indicator less sensitive. Real Channel is a non-redrawing channel indicator based on moving averages.

The Direction Arrows indicator tracks the market trend while ignoring the sharp market fluctuations and noise around the average price. The indicator implements a kind of technical analysis based on the idea that the market is cyclical in nature. It catches the trend and shows favorable moments of entering the market with arrows. The indicator can be used both for pipsing on small periods and for long-term trading.

Balanced Costing - shows signals - can be used with an optimal risk factor. The indicator can be used both for pipsing on small periods and for long-term trading. The Balanced Costing trend indicator uses reliable algorithms in its calculations. Shows favorable moments for entering the market with arrows, that is, using the indicator is quite simple.
Works on all currency pairs and on all timeframes. Of course, the approach to trading should be complex and in order to make a decision, you sho

Ichimoku Map (instant look at the markets) - built on the basis of the legendary Ichimoku Kinko Hyo indicator.
The task of the Ichimoku Map is to provide information about the market strength on the selected time periods and instruments, from the point of view of the Ichimoku indicator. The indicator displays 7 degrees of buy signal strength and 7 degrees of sell signal strength.
The stronger the trend, the brighter the signal rectangle in the table. The table can be dragged with the mouse.
T

The Keltner Channel is a volatility-based technical indicator composed of three separate lines. The middle line is an exponential moving average (EMA) of the price. Additional lines are placed above and below the EMA. The upper band is typically set two times the Average True Range (ATR) above the EMA, and the lower band is typically set two times the ATR below the EMA. The bands expand and contract as volatility (measured by ATR) expands and contracts. Since most price action will be encompasse
FREE
MetaTraderプラットフォームのためのアプリのストアであるMetaTraderアプリストアで自動売買ロボットを購入する方法をご覧ください。
MQL5.community支払いシステムでは、PayPalや銀行カードおよび人気の支払いシステムを通してトランザクションをすることができます。ご満足いただけるように購入前に自動売買ロボットをテストすることを強くお勧めします。
取引の機会を逃しています。
- 無料取引アプリ
- 8千を超えるシグナルをコピー
- 金融ニュースで金融マーケットを探索
新規登録
ログイン