Guarda i video tutorial del Market su YouTube
Come acquistare un Robot di Trading o un indicatore
Esegui il tuo EA
hosting virtuale
hosting virtuale
Prova un indicatore/robot di trading prima di acquistarlo
Vuoi guadagnare nel Market?
Come presentare un prodotto per venderlo con successo
Expert Advisors e Indicatori per MetaTrader 4 - 108

MMM Momentum EA strategy: The robot uses its internal Momentum indicator all the time and does a calculation to determine the prices trends. If it indicates the price will be bullish, it sends a buy order. If the Stochastic indicator indicates the price will be bearish, it sends a sell order; It will not send an order unless the calculations determines a good trend of profit; Like all MMM products it is also programmed to minimize your losses and protect your money from the hostile market. We ha

The Expert Advisor strategy is based on the intersection of moving averages. Buy - the fast МА (Moving Average) crosses the slow MA upwards, sell - fast МА crosses the slow MA downwards. It uses an adaptive grid and averaging with a time delay. Adapted for 4 and 5-digit quotes. Working timeframe is H1. Recommended initial deposit is at least 1000 units of the base currency.
Parameters MaFast_period , MaSlow_period – periods of the fast and slow moving averages; MaFast_method , MaSlow_method – a
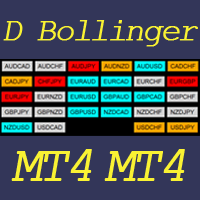
This indicator helps to visualize the Bollinger Band status of 28 pairs. With the feature of color panel, alert, and notification features, user can catch the potential Bollinger Bounce opportunities from 28 main pairs on one Dashboard quickly. Dashboard Bollinger Band is an intuitive and handy graphic tool to help you to monitor all 28 pairs and provide trading signals based on the Bollinger Bounce Rules (Overbought/Oversold and Bollinger Band Cross). COLOR LEGEND:
clrOrange: price is above the
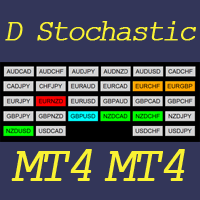
This indicator helps to visualize the Stochastic status of 28 pairs. With the feature of color panel, alert, and notification features, user can catch the potential buy and sell opportunities when the 28 main pairs cross the oversold/overbought area on one Dashboard quickly.
Dashboard Stochastic is an intuitive and handy graphic tool to help you to monitor all 28 pairs and provide trading signals based on the Stochastic Classic Rules (Overbought/Oversold and Stochastic Cross).
COLOR LEGEND: cl
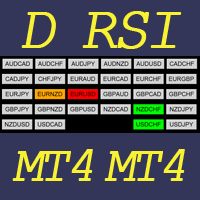
This indicator helps to visualize the RSI status of 28 pairs. With the feature of color panel, alert, and notification features, user can catch the potential buy and sell opportunities when the 28 main pairs cross the oversold/overbought area on one Dashboard quickly. Dashboard RSI is an intuitive and handy graphic tool to help you to monitor all 28 pairs and provide trading signals based on the RSI Rules (Overbought/Oversold and Stochastic Cross). COLOR LEGEND:
clrOrange: RSI signal is above th

The Expert Advisor uses 3 different strategies based on news fluctuations. The EA downloads the news from economic sites. The EA takes into account only HIGH and MEDIUM impact news and trades on their basis. The EA uses a smart profit taking system. It was backtested and optimized using real ticks with 99,9% quality. Monitoring : https://www.mql5.com/en/signals/author/profi_mql . Optimized for EURUSD, AUDUSD, GBPUSD, USDJPY, NZDUSD / H1 For the EA to work correctly, open Tools > Options > Expert

The MultiCurrency RSI indicator calculates the values of the standard RSI indicator for each of 8 major currencies: EUR, GBP, AUD, NZD, USD, CAD, CHF, JPY.
Advantage of the indicator: The calculation is performed based on 8 virtual currency charts: EUR, GBP, AUD, NZD, USD, CAD, CHF, JPY; Shows the strength of currencies, not depending on the currency pair; Allows any time to determine the strongest and the weakest currency, also sorts currencies by strength; At any time it shows the current str
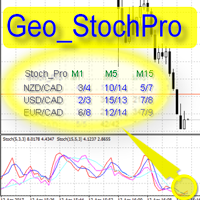
Geo_StochPro is a profile, or professional Stochastic. Geo_StochPro is one of the well-known currency profile indicators. It displays two Stochastic indicators on all timeframes and multiple currency pairs forming the currency profile in the matrix form simultaneously . Thus, you can see the current state of the selected instrument as well as other pairs containing that instrument (overbought/oversold) without switching timeframes. The indicator is perfect for scalpers, intraday and medium-term

QuickClose: Instant Order Management Made Simple QuickClose allows you to instantly close all orders with a single click. It operates at high speed, giving you the flexibility to close orders for a specific symbol or all symbols at once. This makes trade management significantly faster and more efficient. This Expert Advisor (EA) can swiftly close all buy and sell orders either for a selected symbol or across all trades. The SymbolButton is specifically designed for order closure, fea

This indicator can determine the current direction of the market and the most probable future direction on the basis of its own algorithms which only analyze the price action. The indicator calculates and displays current buy/sell levels, as well as required buy/sell levels for a balanced movement. The indicator generates buy/sell signals. These signals can be filtered both manual and automatically, and you can also enable both filters.
Features fast, convenient, easy working wherever possible
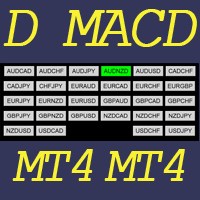
This indicator helps to visualize the MACD status of 28 pairs. With the feature of color panel, alert, and notification features, user can catch the potential buy and sell opportunities when the 28 main pairs’ fast EMA cross the slow EMA on one Dashboard quickly. Dashboard MACD is an intuitive and handy graphic tool to help you to monitor all 28 pairs and provide trading signals based on the MACD Rules (Fast EMA Cross Slow). COLOR LEGEND: clrRed: MACD fast EMA down cross MACD slow EAM and MACD f
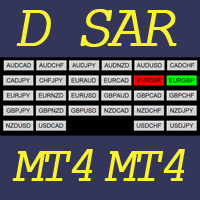
This indicator helps to visualize the SAR status of 28 pairs. With the feature of color panel, alert, and notification features, user can catch the potential buy and sell opportunities when the 28 main pairs’ SAR dots are switching between the above/below of candles on one Dashboard quickly. Dashboard SAR is an intuitive and handy graphic tool to help you to monitor all 28 pairs and provide trading signals based on the SAR Rules (SAR dots are switching between the above/below of candles). COLOR

Professional traders know that a reversal in market price is the best entry points to trade. The trend changes K line state changes the most obvious. The SoarSignal is good to identify these changes, because we have incorporated the KDJ indicators. It is the closest to the K line state of the indicators. The two lines of KDJ Winner move within a range of 0 and 100. Values above 80 are considered to be in overbought territory and indicate that a reversal in price is possible. Values below 20 are

§ Lot - is initial lot of trade. § Koef - coefficient of multiplication of lot. § Dig-2 - average figure to the 100-th lot shares, "1" - average figure to the tenth lot shares, "2" - in the 100-th shares of the warrant. § Maxlot - is the maximum lot of volume in a series. § Stoploss - is the number of points from the warrant. § Lz is - the volume of the warrant at which a series is closed in without a loss. § Takeprofit - is the number of points from the warrant. § Pips - i

This product (later referred to as "script") is intended for qualitative analysis of raw data and statistics when choosing trading signals for subscription. The script also performs calculations regarding compatibility of quotes data between signal provider's trading server and subscriber's trading server. Possible discrepancies in values of quotes are determined through retroactive analysis of transactions carried out by the signal provider. If said compatibility percentage is less than 90%, th

MMM Ichimoku EA strategy: The robot uses its built in Ichimoku indicator all the time and does a calculation to determine the prices trends. If it indicates the price will be bullish, it sends a buy order. If the indicator indicates the price will be bearish, it sends a sell order; It will not send an order unless the calculations determines a good trend of profit; Like all MMM products it is also programmed to minimize your losses and protect your money from the hostile market. We have protecti
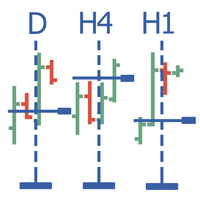
Multitimeframe navigation and research tool MT4 ( XY expert advisor) is a convenient tool that allows analyzing the trading instruments on different time frames and fast switching between them. Easy to use. It has no adjustable parameters. Charts with an XY Expert Advisor can be either the same symbol (instrument) or different (from version 2.0). When a symbol is changed on one of the charts with the XY expert advisor , cascade change of symbols occurs on other charts with the XY attached. The X
Gold Digger Martingale Robot is a fully automated scalping Expert Advisor based on Heiken Ashi, Moving Average and Ichimoku Kinko Hyo. Each entry point is calculated using an advanced entry filter based on Price Action by following the trend.
Advantages Money management system. Indicators are Heiken Ashi, Moving Average and Ichimoku Kinko Hyo for filter sideway and scalping by following the trend. Easy to set up.
Requirements Symbols: XAUUSD H4. Minimum deposit: $500. Leverage: 1:400-1:500. An

Neurone is a trend strategy based on neural network analysis.
Strategy Description The strategy is based on the algorithm of a self-learning neural network. The idea of the algorithm was taken from a famous demonstration of artificial intelligence training in the game with 11 matches. The trading day is divided into 6 trading intervals, which are associated with the H4 candles. Each candle withing a day is a neuron. The history data associated with the neuron are passed as input for the neurons

I present you the Goliath scalping Expert Advisor. The trade operations are performed according to a certain algorithm. Only one order can be opened on one financial instrument at a time. Also, Stop Loss and Take Profit are always set when opening orders. Timeframe: M5
Parameters Lot - specified lot value of a trading position Risk - automated calculation per deal StopLoss - maximum allowed loss level TakeProfit - maximum profit value StartHour - trading start time, hours
StartMinute - trading

The Triple Exponential Moving Average (TEMA) combines a single EMA, a double EMA and a triple EMA. TEMA = 3*EMA - 3*EMA(EMA) + EMA(EMA(EMA)) Setting is very easy, you must set only period of one EMA. I prefer to use two TEMAs for accurate signal.
Settings Period of EMA - defined period of EMA. Test it on Demo account before Real Account. Trading is risky and at your own risk.

Strx Super Grid is a grid system with many advanced features. It places the first 2 orders as BUY_STOP and SELL_STOP distanced from current price by the GridPoints specified; when an order becomes active, the other is canceled. User can also choose to open immediately a position or a pending order via the new FirstImmediateOrder input. If GridPoints is 0 (default), grid is auto-sized based on last 500 bars (max-min closes) divided by MaxOrders input parameter. If trade becomes profitable, after
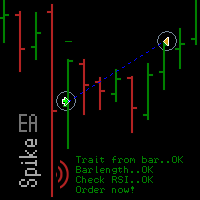
Spike missed? The EA_Spike reacts to spike and uses the RSI indicator as filter. The trade selection and frequency is set with Barlength, TradesperDay and the RSI. The expert advisor is open for many underlyings and all chart periods. It feels most comfortable in a portfolio and can run on several charts with various settings at the same time. You will find suitable settings with the optimization.
Backtest Examples as screenshots. Based on tick data .
Inputs The setting options of the EA are:
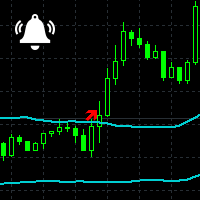
Channel Notifier is a universal indicator, which can plot different types of channels with the ability to send notifications about the channel breakouts. A breakout can be registered based on different rules, such as the price directly reaching a new level, a bar closing beyond the channel, the whole bar being outside the channel, etc. The notifications can be configured as alerts in the MetaTrader terminal, or as push notifications to mobile devices.
Input parameters
Indicator - type of the i

This indicator can display 1-3 CCI indicator on different time frames and settings. The active indicators can give visual and sound alert on oversold/overbought level if the user choose that option. Alert can be set on one or all active indicator, even if the time frame, the period and the oversold/overbought level different on each. There is a display panel with buttons on the main chart, what is show the active indicators and their settings. There is an option to hide this panel. With the butt

This indicator is based on ADX, RSI and CCI. Each indicator show trend arrows on each timeframe. If all arrows are in the same trend, the SELL/BUY signal is the strongest.
Settings Spread Threshold - value of spread threshold ADX Setup ADX Period ADX Price - price of ADX (Close, Open, High, Low, Median(High + Low)/2, Typical(High + Low + Close)/3, Weighted(High + Low + Close + Close)/4). Level of ADX Trend - ADX level Strong of ADX Trend - ADX for Strong Signal RSI Setup M1...MN period Price -
Algo Zones is an indicator that simplify the visual approach and it gives you very quickly the information of your favorite indicator. The indicator colors areas based on indicator and levels chosen in input. This graphic display improves significantly your market attitude and it prevents you from making silly mistakes. The zones are colored in base of levels of this indicators: ATR, Momentum, RSI, MACD and Stochastic.
Input values Number_of_Bars (default 100) numbers of bars where show coloure

This indicator is built on a high-precision strategy, which is based on a set of different Moving Averages. Together they form a strategy that provides stable, and most importantly accurate signals.
What is a Moving Average (MA) It is one of the most popular, proven and effective ways to work in the Forex market. Its task is to average price values by smoothing local movements, thereby helping the trader to focus on the major price movements.
How to Trade By default, the indicator has 2 lines

This tool set Stop Loss and Take Profit, which are invisible for the broker. But keep in mind that the terminal must be constantly running and connected. It means that you cannot turn off your computer or close the terminal. In the strategy tester, the tool opens positions and manages them using stop-order for demonstration purposes.
Parameters Take Profit Stop Loss Slippage

RiverScope Lite automatically determines the nearest most important price levels and support and resistance zones in history, it also identifies a large number of price action patterns (the lite version is limited to 10, while the full version has 30+). The support and resistance levels are determined based on an algorithm that calculates and filters the historical values of the price, its movement character, volumes, etc. It displays the current situation, therefore the nearest levels change in

SMArtin is an adaptation of the classic SMA+WPR strategy, which enters the market at the overbought/oversold states of the WPR indicator, with the SMA indicator as a filter. Trading is performed during the European and at the beginning of the American sessions. If there is a loss, the next entry will be made with an increased lot, and with an increased take profit in a trade series (which allows using a smaller order volume and, correspondingly, decrease the deposit load). Symbol : EURUSD; Timef
ChartTrader is a professional trading tool that every trader needs in their toolbox. It has been developed to work with the MT4 Platform. ChartTrader offers a number of options to make placing orders in the Forex market quick and easy. The GUI sits on the chart window so there is no need to navigate to separate windows when placing orders. The program allows you to set pending and instant orders. It has a built in risk management system, so every trade can risk a percentage or a fixed amount in
Saint Volume Trader EA consists of the two sets of strategy. When "read volume" parameter is on, the EA trades with special build-in software to extract volume data from the data provider. Data provider updates real time data for every two minutes. When "read volume" set to false , the EA trade with standard MetaTrader 4 volume indicator. Both strategies have the same concept to read aggregated volume figures from the standard MetaTrader 4 volume indicator or data provider on a certain timeframe

MultiCurrency Indicators is a multi-currency indicator which calculates the values of multiple standard indicators for each of the 8 major currencies: EUR, GBP, AUD, NZD, USD, CAD, CHF, JPY.
Advantages of the indicator Calculation is performed for 8 virtual charts of the currencies: EUR, GBP, AUD, NZD, USD, CAD, CHF, JPY; Show the currency strength, which does not depend on the currency pair; It allows determining the strongest and the weakest currencies at any moment, it also sorts currencies

The RSI Signals Manager Expert Advisor trades the signals of the RSI indicator. Trades are performed in an appropriate direction when the indicator reaches the value of RSI_Level_Down or RSI_Level_Up . If the indicator exceeds RSI_Level_Up , Short direction is selected for initial trades. If the indicator falls below RSI_Level_Down , Long one is selected. If Inversion = true , the trades are opened in the reverse direction. Profitable trades are closed by take profit. Loss-making ones are averag
This Expert Advisor uses ATR as CORE indicator for GRID operative.ATR measures intrinsec volatility. Using ATR on a GRID, you will give enought space between lines considering current volatility.
On this EA, you can set ATR period and timeframe parameters, and also you can set a ATR multiplier factor, to increase margin between each GRID level. In the same way, you can also configure the number of GRID levels (up and down) as well as the color of the drawn lines.
In addition, it has a start/en

LogicalTraderEA is a Hedging expert advisor which uses a grid recovery strategy. Trading Strategy LogicalTraderEA trades on all types of pairs. It works most efficiently on an account with a high margin, which plays a huge role in any strategy. The user has to be able to consider withdrawal as a part of the strategy. This EA works on all time frames without losing its efficiency, but it works most efficiently in the H1 time frame. I have already set the most optimal default parameters in accorda
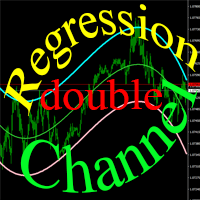
Trading robot for a real account. It is a continuation of the idea used as the basis of the popular Regression Channel EA. Unlike its predecessor, it uses a bidirectional trading algorithm. The robot trades inside a channel formed by regression curves. Deals are always by stop losses.
Strategy Features The robot trades inside a trend channel bound by the curves of a polynomial regression. The trend direction and strength are determined by the gradient of the channel cures during the trading. Ma

BG Robonight is an Expert Advisor that works at the junction of the American and Pacific sessions. The default settings are designed for trading on the M15 timeframe. With these settings, the EA operates in the classic night scalper mode. The initial objective of the EA was to enable multicurrency trading with the same settings for all pairs. By default, the EA is recommended for use on the following currency pairs: AUDCAD, CADCHF, EURCAD, GBPCAD, AUDCHF, GBPAUD. The EA features a news filter, w

The Expert Advisor of the Forex Fraus family, the system is designed for scalping and adapted for the accounts with fast execution of orders.
Operation Principle It buys and sells based on the values of the internal indicator; When a signal is received, the orders are opened by injection, using tick data; Always sets a stop loss; Positions are closed by Trailing Stop; Not closed positions are closed at the opposite trade; Built-in adjustable risk management block. Depending on the balance, it m

This is a multitimeframe version of the popular Force index oscillator. Interpretation of the conventional version of the indicator is relatively complex, therefore, its multitimeframe representation is especially relevant. Monitoring different periods becomes comfortable and the indicator turns out to be more informative. It provides the ability to show or hide any graphs, from minute to daily inclusive. It is also possible to select the oscillator plotting style: line, section or histogram. Yo

Unlock powerful breakout opportunities
The 123 Pattern is one of the most popular, powerful and flexible chart patterns. The pattern is made up of three price points: a bottom, a peak or valley, and a Fibonacci retracement between 38.2% and 71.8%. A pattern is considered valid when the price breaks beyond the last peak or valley, moment at which the indicator plots an arrow, rises an alert, and the trade can be placed. [ Installation Guide | Update Guide | Troubleshooting | FAQ | All Products ]

This is a simple but sophisticated scalper designed to grab the big, quick moves - always ready to pounce. The STALKER ELITE works by waiting for when the market starts moving quickly and then pounces with quick acting trades. It does this by placing pending buy and sell stop orders above and below the current market price and regularly updates these orders regularly to ensure no false triggers. If the market has a sudden move in any direction, one of these trades will be triggered and the money

The Name Green Wall : Arrows hits a lot of TP, by changing the idea of non using SL as something bad, but instead use Small TP and a lot of free Margin and Patience. Use micro TP and a lot of Free Margin with this indicator on Forex. It also can be used with Binary Options. This strategy is intended to be traded Manually. This Indicator runs on Open Bar, arrows will delete when price are against it. The only Indicator Parameter is Alerts true/false, all the rest is included inside the code. Arro
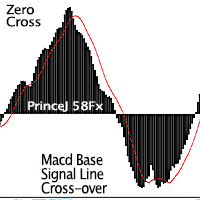
Purpose : Used as a tool for Traders and Investors This product is a Macd alert Indicator, which gives two (2) sets of Alerts: Main line and Macd Signal line cross over for early indications of retracements or trend change above or below. While the zero cross is the flipping over effect of the histogram to the opposite side of the zero line, which can be seen on the standard Macd Oscillator. Regular Arrows: Up and down arrows shows the cross over Of the Signal Line and Main Line from above for

Renko Charts now have the alerts and the Win-rate . Now you can know which signal will give you that edge your trading needs. Risk to Reward Settings Wins versus Losses Count There are four alert types to choose from for notification on screen, email or phone notification. The alert types also have buffers for use with automation. This indicator can be incorporated with any system that requires renko charts. The four (4) alert types are: Three-bar Formation ; Pinbar ; Marabozu and Engulfing Ba
Heiken Ashi Bar Type based indicator: Enter Trades with the Confidence that higher timeframes agree. This tool will display the condition and direction bias all in one window, without need to look at the charts. Professional Traders who do trend trading or scalping with the trend, this is a great tool to be alerted by when the asset is ready. Example: Choose any MT4 timeframe you want Daily timeframe H4 timeframe H1 timeframe Choosing your favourite moving average method: EMA 50/ EMA 100 / EMA

The fully automated Yellow EA works on short-term trend changes creating the price "corridor" set in the parameters. Trading is carried out at the external borders of this corridor by opening positions in different directions with different lot sizes.
Version of Yellow Expert Advisor for MetaTrader5 .
The strategy is simple, but effective.
Presence of a sufficient number of parameters allows trader to customize the advisor in accordance with his trading style.
Telegram: https://t.me/realfor
Price Line EA is an utility designed for manual trading. This expert advisor offers the ability to trade in automatic on your favorites levels. Default levels are created on chart when you upload the expert and after you can move them to your selected levels. When the market reaches the price levels, it opens orders. This algorithm allows an increase on risk management to grow your exposure. The utility opens operations with stop and reverse strategy, so place the levels on an important market r

This indicator can display 1 or 2 MACD indicator on different time-frames and settings. Uses EMA for calculation. The active indicators can give visual and sound alert on zero-level-cross if the user choose that option. Alert can be set on one or both active indicator, even if the time-frame, and the period different on each. When alert set to both, the two MACD histogram must be on the same size of the 0 level to get an arrow. There is a display panel with buttons on the main chart, what is sho

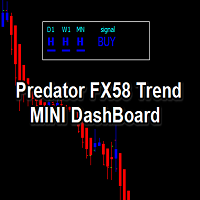
Slide Trend is a simple indicator that shows a trend and allows for easy and fast navigation between charts. It was designed for quick analysis and aids you to scroll very fast through all the charts in the inputs list. The minimalist graphic allows receiving data on trend on D1, W1 and MN timeframes. The Trend feature (in the inputs) allows you to filter and view only the most powerful symbols. In this case, the circles are all of the same color. This indicator is a utility that speeds up navig
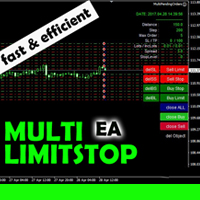
This EA is designed for automatic placing of pending orders (sell limit, buy limit, sell stop, buy stop) including Stop Loss & Take Profit levels (editable) with only one button click.
This EA can make order multi pending level / pending orders grid. So, with this EA placing pending orders will be faster, more accurate and more efficient.
Main Purposes Automation Pending orders grid style trading. Automation of the process of placing the Pending Orders: fast accurate efficient Automation of cl

Do you want to see the candlestick formation on a higher timeframe, but do not want to be detached from the lower chart you trade on? Then this indicator is for you! It draws candles of any timeframe as histogram bars and accurately replicates the proportions between the candle body and wicks. At the same time, the time scale is not interrupted. For example, on a minute chart, each M5 candle will take up 5 bars. Each candle formed before the start of the indicator will be replicated five times w
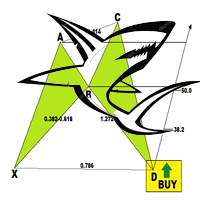
The Shark Pattern is dependent upon the powerful 88.6% retracement and the 113% Reciprocal Ratio, works extremely well retesting prior support/resistance points (0.886/1.13) as a strong counter-trend reaction. Represents a temporary extreme structure that seeks to capitalize on the extended nature of the Extreme Harmonic Impulse Wave. The indicator demands immediate change in price action character following pattern completion. Extreme Harmonic Impulse Wave utilized depends upon location of 88.6

Note : the spread value, the broker's slippage and the VPS speed affect the Expert Advisor trading results. Recommendations: gold with spread up to 3, USDJPY with spread up to 1.7, EURUSD with spread up to 1.5. Results will be better with better conditions. The Ping value between VPS and the broker server should be below 10 ms. In addition, the smaller the broker's stop-level requirement, the better; 0 is the best. The Expert Advisor is based on a breakthrough system and carefully controls all

Did you ever encounter a problem that your terminal failed to reestablish a connection and caused your EA to stop working? How much money did you lose because you were not aware of the connection error? Worry no more, I am here to present you a solution for your nightmare. This utility indicator sends a real time push notification or email when your terminal encounters a connection failure. You will be notified immediately even if your terminal is yet to establish a success connection to your br

This robot is based on Bollinger Bands, Stochastic Oscillator,CCI and RSI indicator. When the Bollinger Bands is in the right level (upper band for Sell signal or lower band for Buy signal), Stochastic Oscillator,CCI and RSI are in the right level, order is open. If the trend is not correct, system open other orders at specified distance. The EA trade on any symbol, on any timeframe (recommended optimization for specific timeframe). Minimum recommended deposit is 1000$ with 0.01 Lot for 7 major
Trend Scanner looks at the Market watchlist and Checks to see if there are trending cases between three (3) timeframes selected by the user.
The analysis can assist in finding pairs to focus on for a particular session where a trader may need to have a bias in terms of direction to place trades for a particular system which requires multiple timeframe filtration of bar momentum. 3 Main indicators are involved: Moving Average, MACD and Heiken Ashi. User is able to select timeframes available on

I recommend you to read the product's blog (manual) from start to end so that it is clear from the beginning what the indicator offers. This multi time frame and multi symbol indicator scans for engulfing and tweezer formations. The indicator can also be used in single chart mode. Combined with your own rules and techniques, this indicator will allow you to create (or enhance) your own powerful system. Features Can monitor all symbols visible in your Market Watch window at the same time. Ap

Yihaa Shoot applies a unique range calculation and time management to enter a trade. It has a unique money management system which calculates the risk before it takes a trade. Suggested pairs: GBPJPY and USDJPY Timeframe: H1 Suggested balance: $500 ($1000 is recomended) Risk in dollar suggested: 4 (0.5% from $1000)
Parameters Signal Settings Margin Top (pip) >> margin top from range Margin Bottom (pip) >> margin bottom from range TP Buy deduct (pip) >> reduce the TP spot TP Sell deduct (pip) >

The Expert Advisor implements the Fibonacci level trading. Pending orders (Buy Limit, Sell Limit) are placed at levels ~38.2,~50.0 and ~61.8. The grid of pending orders is built following the trend . Orders are closed by the total take profit or stop loss.
Settings and Inputs Risk: Risk - risk (<0.01 - low, >0.01 - high); Levels for placing pending orders: Level1 (0 - don't set) - level 1 (~38.2%) 0 - do not place a pending order Level2 (0 - don't set) - level 2 (~50.0%) 0 - do not place a pend

The EA has two strategies, each designed for a particular market behavior. Using both strategies allows you to cover a significant range of trading time and get high and stable results. The Channel strategy is based on the principle of scalping within the channel bounds, during periods of low volatility. (Modified strategy from version 1.1) Trend strategy builds on the principle of following the trend in during the high volatility hours. (New Strategy) The trading periods are selected based on t

The Expert Advisor is based purely on price action analysis and applies three combined adaptive trading algorithms using pending orders. The robot follows the market price removing "noise" and selecting the most suitable trading strategy. The EA features dynamic trailing stop and brerakeven. The robot works with five-digit quotes. Economic news are used. Monitoring : https://www.mql5.com/en/signals/author/profi_mql . Optimized for EURUSD, AUDUSD, GBPUSD, USDJPY, NZDUSD, EURAUD / H1. For the EA o

L'indicatore di fattibilità del grado avanzato AIS è progettato per prevedere i livelli che il prezzo potrebbe raggiungere in futuro. Il suo compito è analizzare le ultime tre barre e costruire una previsione basata su queste. L'indicatore può essere utilizzato su qualsiasi intervallo di tempo e qualsiasi coppia di valute. Con l'aiuto delle impostazioni, puoi ottenere la qualità desiderata della previsione.
Profondità di previsione: imposta la profondità di previsione desiderata in barre. Si c

Super signal series magic arrows is an indicator that generates trade arrows. It generates trade arrows with its own algorithm. These arrows give buying and selling signals. The indicator certainly does not repaint. Can be used in all pairs. Sends a signal to the user with the alert feature.
Trade rules Enter the signal when the buy signal arrives. In order to exit from the transaction, an opposite signal must be received. It is absolutely necessary to close the operation when an opposite signa

Tired of online risk calculators that you manually have to fill out? This neat little dashboard instantly shows you, your risk, reward and risk vs reward as soon as you've sat your Stop-loss or Take-profit. Works on both market and pending orders. By far, my most used indicator when trading manually on mt4.
Advantages Can handle multiple positions. And gives the total risk and reward for all positions on all manually placed or pending positions on the current chart. Automatically recalculates t

This indicator consists in two different algorithms, in order to profit all fast movements created during noises of the market.
First of all, it plots normalized trend bands to can filter the possible trades. The normalized trend bands are calcualted using an exclusive mathematical algorithm to has both the correct trend and the fast adaptability to the change of trends.
With those bands you can know when you are inside the trend, or when you are outside. The second alhorithm uses a private fo

The axiom of the Forex market is that any trend will be broken. The Expert Advisor determines trend direction (the pink line), and calculates levels for opening opposite orders depending on the settings. The value of Away from the trend line for Deal will be different for each pair and timeframe, depending on the volatility of the trading instrument. Next orders can be opened with an increased lot (a static lot is used by default). See the screenshots to understand the idea of the Expert Advisor
The Impulse Checker indicator is designed for informing about the price acceleration and determining the optimal entry points during an increased market volatility (for example, at the opening of the market or during the release of high-impact news). The indicator utilizes the fundamental regularity of the market, which assumes that after an impulse of a certain size at a certain point appears, the price movement continues, which allows earning a large number of points.
Description of the indic
This is a true Price Rate-of-Change multi-timeframe indicator. It shows the charts of various timeframes in a single window converting them to the time scale used to perform trades. You are able to select both higher and lower timeframes, as well as change the main trading timeframe. You will always see all the lines of the indicator on the right scale. Two color scheme variants are available: with color change when crossing zero, and without. You can also define the data display style (lines or
Scopri come acquistare un robot di trading dal MetaTrader Market, il negozio di applicazioni per la piattaforma MetaTrader.
Il sistema di pagamento di MQL5.community supporta le transazioni tramite PayPal, carte bancarie e gli altri sistemi di pagamento più diffusi. Per essere pienamente soddisfatto, ti consigliamo vivamente di testare il robot di trading prima di acquistarlo.
Ti stai perdendo delle opportunità di trading:
- App di trading gratuite
- Oltre 8.000 segnali per il copy trading
- Notizie economiche per esplorare i mercati finanziari
Registrazione
Accedi
Se non hai un account, registrati
Consenti l'uso dei cookie per accedere al sito MQL5.com.
Abilita le impostazioni necessarie nel browser, altrimenti non sarà possibile accedere.