Robots comerciales e indicadores para MetaTrader 4 - 108
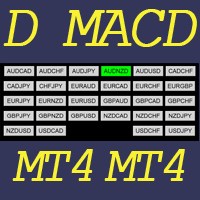
This indicator helps to visualize the MACD status of 28 pairs. With the feature of color panel, alert, and notification features, user can catch the potential buy and sell opportunities when the 28 main pairs’ fast EMA cross the slow EMA on one Dashboard quickly. Dashboard MACD is an intuitive and handy graphic tool to help you to monitor all 28 pairs and provide trading signals based on the MACD Rules (Fast EMA Cross Slow). COLOR LEGEND: clrRed: MACD fast EMA down cross MACD slow EAM and MACD f
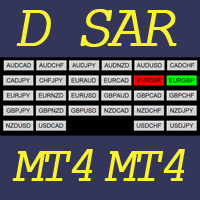
This indicator helps to visualize the SAR status of 28 pairs. With the feature of color panel, alert, and notification features, user can catch the potential buy and sell opportunities when the 28 main pairs’ SAR dots are switching between the above/below of candles on one Dashboard quickly. Dashboard SAR is an intuitive and handy graphic tool to help you to monitor all 28 pairs and provide trading signals based on the SAR Rules (SAR dots are switching between the above/below of candles). COLOR

Professional traders know that a reversal in market price is the best entry points to trade. The trend changes K line state changes the most obvious. The SoarSignal is good to identify these changes, because we have incorporated the KDJ indicators. It is the closest to the K line state of the indicators. The two lines of KDJ Winner move within a range of 0 and 100. Values above 80 are considered to be in overbought territory and indicate that a reversal in price is possible. Values below 20 are

§ Lot - is initial lot of trade. § Koef - coefficient of multiplication of lot. § Dig-2 - average figure to the 100-th lot shares, "1" - average figure to the tenth lot shares, "2" - in the 100-th shares of the warrant. § Maxlot - is the maximum lot of volume in a series. § Stoploss - is the number of points from the warrant. § Lz is - the volume of the warrant at which a series is closed in without a loss. § Takeprofit - is the number of points from the warrant. § Pips - i

This product (later referred to as "script") is intended for qualitative analysis of raw data and statistics when choosing trading signals for subscription. The script also performs calculations regarding compatibility of quotes data between signal provider's trading server and subscriber's trading server. Possible discrepancies in values of quotes are determined through retroactive analysis of transactions carried out by the signal provider. If said compatibility percentage is less than 90%, th

MMM Ichimoku EA strategy: The robot uses its built in Ichimoku indicator all the time and does a calculation to determine the prices trends. If it indicates the price will be bullish, it sends a buy order. If the indicator indicates the price will be bearish, it sends a sell order; It will not send an order unless the calculations determines a good trend of profit; Like all MMM products it is also programmed to minimize your losses and protect your money from the hostile market. We have protecti
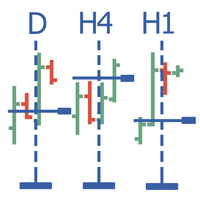
Multitimeframe navigation and research tool MT4 ( XY expert advisor) is a convenient tool that allows analyzing the trading instruments on different time frames and fast switching between them. Easy to use. It has no adjustable parameters. Charts with an XY Expert Advisor can be either the same symbol (instrument) or different (from version 2.0). When a symbol is changed on one of the charts with the XY expert advisor , cascade change of symbols occurs on other charts with the XY attached. The X
Gold Digger Martingale Robot is a fully automated scalping Expert Advisor based on Heiken Ashi, Moving Average and Ichimoku Kinko Hyo. Each entry point is calculated using an advanced entry filter based on Price Action by following the trend.
Advantages Money management system. Indicators are Heiken Ashi, Moving Average and Ichimoku Kinko Hyo for filter sideway and scalping by following the trend. Easy to set up.
Requirements Symbols: XAUUSD H4. Minimum deposit: $500. Leverage: 1:400-1:500. An

Neurone is a trend strategy based on neural network analysis.
Strategy Description The strategy is based on the algorithm of a self-learning neural network. The idea of the algorithm was taken from a famous demonstration of artificial intelligence training in the game with 11 matches. The trading day is divided into 6 trading intervals, which are associated with the H4 candles. Each candle withing a day is a neuron. The history data associated with the neuron are passed as input for the neurons

I present you the Goliath scalping Expert Advisor. The trade operations are performed according to a certain algorithm. Only one order can be opened on one financial instrument at a time. Also, Stop Loss and Take Profit are always set when opening orders. Timeframe: M5
Parameters Lot - specified lot value of a trading position Risk - automated calculation per deal StopLoss - maximum allowed loss level TakeProfit - maximum profit value StartHour - trading start time, hours
StartMinute - trading

The Triple Exponential Moving Average (TEMA) combines a single EMA, a double EMA and a triple EMA. TEMA = 3*EMA - 3*EMA(EMA) + EMA(EMA(EMA)) Setting is very easy, you must set only period of one EMA. I prefer to use two TEMAs for accurate signal.
Settings Period of EMA - defined period of EMA. Test it on Demo account before Real Account. Trading is risky and at your own risk.

Strx Super Grid is a grid system with many advanced features. It places the first 2 orders as BUY_STOP and SELL_STOP distanced from current price by the GridPoints specified; when an order becomes active, the other is canceled. User can also choose to open immediately a position or a pending order via the new FirstImmediateOrder input. If GridPoints is 0 (default), grid is auto-sized based on last 500 bars (max-min closes) divided by MaxOrders input parameter. If trade becomes profitable, after
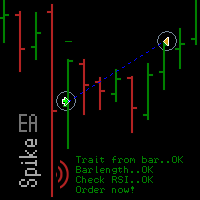
Spike missed? The EA_Spike reacts to spike and uses the RSI indicator as filter. The trade selection and frequency is set with Barlength, TradesperDay and the RSI. The expert advisor is open for many underlyings and all chart periods. It feels most comfortable in a portfolio and can run on several charts with various settings at the same time. You will find suitable settings with the optimization.
Backtest Examples as screenshots. Based on tick data .
Inputs The setting options of the EA are:
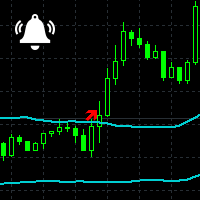
Channel Notifier is a universal indicator, which can plot different types of channels with the ability to send notifications about the channel breakouts. A breakout can be registered based on different rules, such as the price directly reaching a new level, a bar closing beyond the channel, the whole bar being outside the channel, etc. The notifications can be configured as alerts in the MetaTrader terminal, or as push notifications to mobile devices.
Input parameters
Indicator - type of the i

This indicator can display 1-3 CCI indicator on different time frames and settings. The active indicators can give visual and sound alert on oversold/overbought level if the user choose that option. Alert can be set on one or all active indicator, even if the time frame, the period and the oversold/overbought level different on each. There is a display panel with buttons on the main chart, what is show the active indicators and their settings. There is an option to hide this panel. With the butt

This indicator is based on ADX, RSI and CCI. Each indicator show trend arrows on each timeframe. If all arrows are in the same trend, the SELL/BUY signal is the strongest.
Settings Spread Threshold - value of spread threshold ADX Setup ADX Period ADX Price - price of ADX (Close, Open, High, Low, Median(High + Low)/2, Typical(High + Low + Close)/3, Weighted(High + Low + Close + Close)/4). Level of ADX Trend - ADX level Strong of ADX Trend - ADX for Strong Signal RSI Setup M1...MN period Price -
Algo Zones is an indicator that simplify the visual approach and it gives you very quickly the information of your favorite indicator. The indicator colors areas based on indicator and levels chosen in input. This graphic display improves significantly your market attitude and it prevents you from making silly mistakes. The zones are colored in base of levels of this indicators: ATR, Momentum, RSI, MACD and Stochastic.
Input values Number_of_Bars (default 100) numbers of bars where show coloure

This indicator is built on a high-precision strategy, which is based on a set of different Moving Averages. Together they form a strategy that provides stable, and most importantly accurate signals.
What is a Moving Average (MA) It is one of the most popular, proven and effective ways to work in the Forex market. Its task is to average price values by smoothing local movements, thereby helping the trader to focus on the major price movements.
How to Trade By default, the indicator has 2 lines

This tool set Stop Loss and Take Profit, which are invisible for the broker. But keep in mind that the terminal must be constantly running and connected. It means that you cannot turn off your computer or close the terminal. In the strategy tester, the tool opens positions and manages them using stop-order for demonstration purposes.
Parameters Take Profit Stop Loss Slippage

RiverScope Lite automatically determines the nearest most important price levels and support and resistance zones in history, it also identifies a large number of price action patterns (the lite version is limited to 10, while the full version has 30+). The support and resistance levels are determined based on an algorithm that calculates and filters the historical values of the price, its movement character, volumes, etc. It displays the current situation, therefore the nearest levels change in

SMArtin is an adaptation of the classic SMA+WPR strategy, which enters the market at the overbought/oversold states of the WPR indicator, with the SMA indicator as a filter. Trading is performed during the European and at the beginning of the American sessions. If there is a loss, the next entry will be made with an increased lot, and with an increased take profit in a trade series (which allows using a smaller order volume and, correspondingly, decrease the deposit load). Symbol : EURUSD; Timef
ChartTrader is a professional trading tool that every trader needs in their toolbox. It has been developed to work with the MT4 Platform. ChartTrader offers a number of options to make placing orders in the Forex market quick and easy. The GUI sits on the chart window so there is no need to navigate to separate windows when placing orders. The program allows you to set pending and instant orders. It has a built in risk management system, so every trade can risk a percentage or a fixed amount in
Saint Volume Trader EA consists of the two sets of strategy. When "read volume" parameter is on, the EA trades with special build-in software to extract volume data from the data provider. Data provider updates real time data for every two minutes. When "read volume" set to false , the EA trade with standard MetaTrader 4 volume indicator. Both strategies have the same concept to read aggregated volume figures from the standard MetaTrader 4 volume indicator or data provider on a certain timeframe

MultiCurrency Indicators is a multi-currency indicator which calculates the values of multiple standard indicators for each of the 8 major currencies: EUR, GBP, AUD, NZD, USD, CAD, CHF, JPY.
Advantages of the indicator Calculation is performed for 8 virtual charts of the currencies: EUR, GBP, AUD, NZD, USD, CAD, CHF, JPY; Show the currency strength, which does not depend on the currency pair; It allows determining the strongest and the weakest currencies at any moment, it also sorts currencies

The RSI Signals Manager Expert Advisor trades the signals of the RSI indicator. Trades are performed in an appropriate direction when the indicator reaches the value of RSI_Level_Down or RSI_Level_Up . If the indicator exceeds RSI_Level_Up , Short direction is selected for initial trades. If the indicator falls below RSI_Level_Down , Long one is selected. If Inversion = true , the trades are opened in the reverse direction. Profitable trades are closed by take profit. Loss-making ones are averag
Es un Expert Advisor que utiliza el ATR como indicador para la operativa GRID. El ATR mide la volatilidad intrínseca del activo. Gracias al ATR, podemos configurar el GRID respetando la volatilidad actual del par en cada nivel.
En el EA se puede configurar los parámetros del ATR, en periodo y timeframe, además de poder aplicar un factor multiplicador para dar más margen dela volatilidad media a cada uno de los niveles de GRID. Del mismo modo, también se pueden configurar el número de niveles de

LogicalTraderEA is a Hedging expert advisor which uses a grid recovery strategy. Trading Strategy LogicalTraderEA trades on all types of pairs. It works most efficiently on an account with a high margin, which plays a huge role in any strategy. The user has to be able to consider withdrawal as a part of the strategy. This EA works on all time frames without losing its efficiency, but it works most efficiently in the H1 time frame. I have already set the most optimal default parameters in accorda
Trading robot for a real account. It is a continuation of the idea used as the basis of the popular Regression Channel EA. Unlike its predecessor, it uses a bidirectional trading algorithm. The robot trades inside a channel formed by regression curves. Deals are always by stop losses.
Strategy Features The robot trades inside a trend channel bound by the curves of a polynomial regression. The trend direction and strength are determined by the gradient of the channel cures during the trading. Ma

BG Robonight is an Expert Advisor that works at the junction of the American and Pacific sessions. The default settings are designed for trading on the M15 timeframe. With these settings, the EA operates in the classic night scalper mode. The initial objective of the EA was to enable multicurrency trading with the same settings for all pairs. By default, the EA is recommended for use on the following currency pairs: AUDCAD, CADCHF, EURCAD, GBPCAD, AUDCHF, GBPAUD. The EA features a news filter, w

The Expert Advisor of the Forex Fraus family, the system is designed for scalping and adapted for the accounts with fast execution of orders.
Operation Principle It buys and sells based on the values of the internal indicator; When a signal is received, the orders are opened by injection, using tick data; Always sets a stop loss; Positions are closed by Trailing Stop; Not closed positions are closed at the opposite trade; Built-in adjustable risk management block. Depending on the balance, it m
This is a multitimeframe version of the popular Force index oscillator. Interpretation of the conventional version of the indicator is relatively complex, therefore, its multitimeframe representation is especially relevant. Monitoring different periods becomes comfortable and the indicator turns out to be more informative. It provides the ability to show or hide any graphs, from minute to daily inclusive. It is also possible to select the oscillator plotting style: line, section or histogram. Yo

El patrón 123 es uno de los patrones de gráficos más populares, potentes y flexibles. El patrón se compone de tres puntos de precio: un fondo, un pico o valle, y un retroceso de Fibonacci entre 38.2% y 71.8%. Un patrón se considera válido cuando el precio se rompe más allá del último pico o valle, momento en el que el indicador traza una flecha, levanta una alerta y se puede colocar el comercio. [ Guía de instalación | Guía de actualización | Solución de problemas | FAQ | Todos los productos ]

This is a simple but sophisticated scalper designed to grab the big, quick moves - always ready to pounce. The STALKER ELITE works by waiting for when the market starts moving quickly and then pounces with quick acting trades. It does this by placing pending buy and sell stop orders above and below the current market price and regularly updates these orders regularly to ensure no false triggers. If the market has a sudden move in any direction, one of these trades will be triggered and the money

El Nombre Green_Wall_Arrows : Usando un Tp pequeño y mucho free margin, nos da la oportunidad de generar una muralla verde de profits que van saliendo, a medida que vamos tomando TP. Sin necesidad de usar SL para equilibrar los Tp pequeños de salida. Esta estrategia es una forma de operar los mercados, creada por mi y el indicador tan solo una herramienta mas. Puede ser Usado en Binarios. Este indicador Funciona en Barras Abiertas, Las flechas desaparecen si el mercado en contra de las flechas.
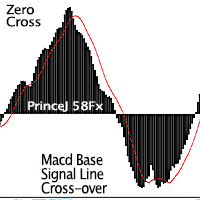
Purpose : Used as a tool for Traders and Investors This product is a Macd alert Indicator, which gives two (2) sets of Alerts: Main line and Macd Signal line cross over for early indications of retracements or trend change above or below. While the zero cross is the flipping over effect of the histogram to the opposite side of the zero line, which can be seen on the standard Macd Oscillator. Regular Arrows: Up and down arrows shows the cross over Of the Signal Line and Main Line from above for

Renko Charts now have the alerts and the Win-rate . Now you can know which signal will give you that edge your trading needs. Risk to Reward Settings Wins versus Losses Count There are four alert types to choose from for notification on screen, email or phone notification. The alert types also have buffers for use with automation. This indicator can be incorporated with any system that requires renko charts. The four (4) alert types are: Three-bar Formation ; Pinbar ; Marabozu and Engulfing Ba
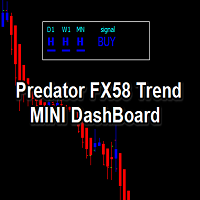
Heiken Ashi Bar Type based indicator: Enter Trades with the Confidence that higher timeframes agree. This tool will display the condition and direction bias all in one window, without need to look at the charts. Professional Traders who do trend trading or scalping with the trend, this is a great tool to be alerted by when the asset is ready. Example: Choose any MT4 timeframe you want Daily timeframe H4 timeframe H1 timeframe Choosing your favourite moving average method: EMA 50/ EMA 100 / EMA

El Asesor Experto Amarillo totalmente automatizado trabaja en cambios de tendencia a corto plazo creando el "corredor" de precios establecido en los parámetros. El comercio se lleva a cabo en los bordes externos de este corredor abriendo posiciones en diferentes direcciones con diferentes tamaños de lote.
Versión de Yellow EA para MetaTrader5.
La estrategia es simple, pero efectiva.
La presencia de un número suficiente de parámetros permite al operador personalizar el robot de acuerdo con su
Price Line EA is an utility designed for manual trading. This expert advisor offers the ability to trade in automatic on your favorites levels. Default levels are created on chart when you upload the expert and after you can move them to your selected levels. When the market reaches the price levels, it opens orders. This algorithm allows an increase on risk management to grow your exposure. The utility opens operations with stop and reverse strategy, so place the levels on an important market r

This indicator can display 1 or 2 MACD indicator on different time-frames and settings. Uses EMA for calculation. The active indicators can give visual and sound alert on zero-level-cross if the user choose that option. Alert can be set on one or both active indicator, even if the time-frame, and the period different on each. When alert set to both, the two MACD histogram must be on the same size of the 0 level to get an arrow. There is a display panel with buttons on the main chart, what is sho

Slide Trend is a simple indicator that shows a trend and allows for easy and fast navigation between charts. It was designed for quick analysis and aids you to scroll very fast through all the charts in the inputs list. The minimalist graphic allows receiving data on trend on D1, W1 and MN timeframes. The Trend feature (in the inputs) allows you to filter and view only the most powerful symbols. In this case, the circles are all of the same color. This indicator is a utility that speeds up navig
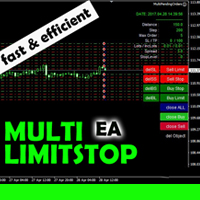
This EA is designed for automatic placing of pending orders (sell limit, buy limit, sell stop, buy stop) including Stop Loss & Take Profit levels (editable) with only one button click.
This EA can make order multi pending level / pending orders grid. So, with this EA placing pending orders will be faster, more accurate and more efficient.
Main Purposes Automation Pending orders grid style trading. Automation of the process of placing the Pending Orders: fast accurate efficient Automation of cl

Do you want to see the candlestick formation on a higher timeframe, but do not want to be detached from the lower chart you trade on? Then this indicator is for you! It draws candles of any timeframe as histogram bars and accurately replicates the proportions between the candle body and wicks. At the same time, the time scale is not interrupted. For example, on a minute chart, each M5 candle will take up 5 bars. Each candle formed before the start of the indicator will be replicated five times w
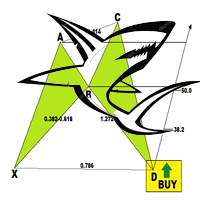
The Shark Pattern is dependent upon the powerful 88.6% retracement and the 113% Reciprocal Ratio, works extremely well retesting prior support/resistance points (0.886/1.13) as a strong counter-trend reaction. Represents a temporary extreme structure that seeks to capitalize on the extended nature of the Extreme Harmonic Impulse Wave. The indicator demands immediate change in price action character following pattern completion. Extreme Harmonic Impulse Wave utilized depends upon location of 88.6

Note : the spread value, the broker's slippage and the VPS speed affect the Expert Advisor trading results. Recommendations: gold with spread up to 3, USDJPY with spread up to 1.7, EURUSD with spread up to 1.5. Results will be better with better conditions. The Ping value between VPS and the broker server should be below 10 ms. In addition, the smaller the broker's stop-level requirement, the better; 0 is the best. The Expert Advisor is based on a breakthrough system and carefully controls all

Did you ever encounter a problem that your terminal failed to reestablish a connection and caused your EA to stop working? How much money did you lose because you were not aware of the connection error? Worry no more, I am here to present you a solution for your nightmare. This utility indicator sends a real time push notification or email when your terminal encounters a connection failure. You will be notified immediately even if your terminal is yet to establish a success connection to your br

This robot is based on Bollinger Bands, Stochastic Oscillator,CCI and RSI indicator. When the Bollinger Bands is in the right level (upper band for Sell signal or lower band for Buy signal), Stochastic Oscillator,CCI and RSI are in the right level, order is open. If the trend is not correct, system open other orders at specified distance. The EA trade on any symbol, on any timeframe (recommended optimization for specific timeframe). Minimum recommended deposit is 1000$ with 0.01 Lot for 7 major
Trend Scanner looks at the Market watchlist and Checks to see if there are trending cases between three (3) timeframes selected by the user.
The analysis can assist in finding pairs to focus on for a particular session where a trader may need to have a bias in terms of direction to place trades for a particular system which requires multiple timeframe filtration of bar momentum. 3 Main indicators are involved: Moving Average, MACD and Heiken Ashi. User is able to select timeframes available on

Este indicador de marco de tiempo múltiple y de símbolo múltiple escanea en busca de formaciones envolventes y de pinzas. Características Puede monitorear todos los símbolos visibles en su ventana Market Watch al mismo tiempo. Aplique el indicador a un solo gráfico y monitoree instantáneamente todo el mercado. Monitorea cada período de tiempo, desde M1 hasta MN, y le envía una alerta en tiempo real cuando se identifica una formación de Pinzas o Engulling. Se admiten todos los tipos de alertas na

Yihaa Shoot applies a unique range calculation and time management to enter a trade. It has a unique money management system which calculates the risk before it takes a trade. Suggested pairs: GBPJPY and USDJPY Timeframe: H1 Suggested balance: $500 ($1000 is recomended) Risk in dollar suggested: 4 (0.5% from $1000)
Parameters Signal Settings Margin Top (pip) >> margin top from range Margin Bottom (pip) >> margin bottom from range TP Buy deduct (pip) >> reduce the TP spot TP Sell deduct (pip) >

The Expert Advisor implements the Fibonacci level trading. Pending orders (Buy Limit, Sell Limit) are placed at levels ~38.2,~50.0 and ~61.8. The grid of pending orders is built following the trend . Orders are closed by the total take profit or stop loss.
Settings and Inputs Risk: Risk - risk (<0.01 - low, >0.01 - high); Levels for placing pending orders: Level1 (0 - don't set) - level 1 (~38.2%) 0 - do not place a pending order Level2 (0 - don't set) - level 2 (~50.0%) 0 - do not place a pend

The EA has two strategies, each designed for a particular market behavior. Using both strategies allows you to cover a significant range of trading time and get high and stable results. The Channel strategy is based on the principle of scalping within the channel bounds, during periods of low volatility. (Modified strategy from version 1.1) Trend strategy builds on the principle of following the trend in during the high volatility hours. (New Strategy) The trading periods are selected based on t

The Expert Advisor is based purely on price action analysis and applies three combined adaptive trading algorithms using pending orders. The robot follows the market price removing "noise" and selecting the most suitable trading strategy. The EA features dynamic trailing stop and brerakeven. The robot works with five-digit quotes. Economic news are used. Monitoring : https://www.mql5.com/en/signals/author/profi_mql . Optimized for EURUSD, AUDUSD, GBPUSD, USDJPY, NZDUSD, EURAUD / H1. For the EA o

El indicador de factibilidad de grado avanzado de AIS está diseñado para predecir los niveles que el precio puede alcanzar en el futuro. Su trabajo es analizar las últimas tres barras y construir un pronóstico basado en eso. El indicador se puede utilizar en cualquier período de tiempo y cualquier par de divisas. Con la ayuda de la configuración, puede lograr la calidad deseada del pronóstico.
Profundidad de pronóstico: establece la profundidad de pronóstico deseada en barras. Se recomienda se

Super signal series magic arrows is an indicator that generates trade arrows. It generates trade arrows with its own algorithm. These arrows give buying and selling signals. The indicator certainly does not repaint. Can be used in all pairs. Sends a signal to the user with the alert feature.
Trade rules Enter the signal when the buy signal arrives. In order to exit from the transaction, an opposite signal must be received. It is absolutely necessary to close the operation when an opposite signa

Tired of online risk calculators that you manually have to fill out? This neat little dashboard instantly shows you, your risk, reward and risk vs reward as soon as you've sat your Stop-loss or Take-profit. Works on both market and pending orders. By far, my most used indicator when trading manually on mt4.
Advantages Can handle multiple positions. And gives the total risk and reward for all positions on all manually placed or pending positions on the current chart. Automatically recalculates t

This indicator consists in two different algorithms, in order to profit all fast movements created during noises of the market.
First of all, it plots normalized trend bands to can filter the possible trades. The normalized trend bands are calcualted using an exclusive mathematical algorithm to has both the correct trend and the fast adaptability to the change of trends.
With those bands you can know when you are inside the trend, or when you are outside. The second alhorithm uses a private fo

The axiom of the Forex market is that any trend will be broken. The Expert Advisor determines trend direction (the pink line), and calculates levels for opening opposite orders depending on the settings. The value of Away from the trend line for Deal will be different for each pair and timeframe, depending on the volatility of the trading instrument. Next orders can be opened with an increased lot (a static lot is used by default). See the screenshots to understand the idea of the Expert Advisor
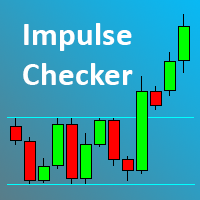
The Impulse Checker indicator is designed for informing about the price acceleration and determining the optimal entry points during an increased market volatility (for example, at the opening of the market or during the release of high-impact news). The indicator utilizes the fundamental regularity of the market, which assumes that after an impulse of a certain size at a certain point appears, the price movement continues, which allows earning a large number of points.
Description of the indic
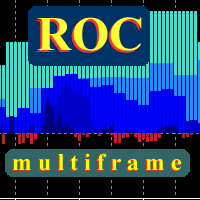
This is a true Price Rate-of-Change multi-timeframe indicator. It shows the charts of various timeframes in a single window converting them to the time scale used to perform trades. You are able to select both higher and lower timeframes, as well as change the main trading timeframe. You will always see all the lines of the indicator on the right scale. Two color scheme variants are available: with color change when crossing zero, and without. You can also define the data display style (lines or
This oscillator generates trade signals based on the analysis of two smoothed Price Rate-of-Change graphs, which are calculated using different periods. One of the graphs is used as the main one, the second as the signal line. The difference between them is displayed as an oscillator in the form of a histogram, divided into four phases: the beginning of the rise, the completion of the rise, the beginning of the fall and the end of the fall. When the color is bright blue, the ROC indicator intens
EA is primarily a Hedging and Multiples Strategy. It support to seize every opportunity in any direction as MILCH COW MIX but with multiple profit results without increasing the risk. Milch Cow Mix EA starts to open Hedge at first level only But EA opens Hedge at every level Not just opens the deals, but chooses the right time to close the open positions to begin trading again. We recommend the use of an expert with a pair of high volatility for the currency, such as GBPAUD, AUDCAD Experts inter
The FX Scientific Scalper is a fully aitomated trading system for efficient scalping trading in the Forex market. The Expert Advisor uses a number of mathematical calculations for position opening. Does not use martingale. Does not use aggressive trading. Does not accumulate drawdown. The Expert Advisor trades smoothly and gradually increases its capacity. Its priority is saving the deposit. This significantly increases the chances of successful trading and minimizes risk. The robot can calculat

The Expert Advisor finds strong trend movements of a currency pair over the specified number of bars. It also finds correction to this trend (for the same period). When the trend is strong enough, and the correction becomes equal to the values specified in the EA parameters, the Expert Advisor opens the a trade in the trend direction. The advantage of this is that the EA will not buy at the trend maximum or sell at its minimum - trhe EA only trades after correction. However, you can set differen
MILCH COW Turbo EA is primarily a multi-currency strategy. It supports 9 or 10 pairs as collection of currencies (GBPJPY, GBPUSD, EURCHF,EURGBP, EURJPY, EURUSD, USDCAD, USDCHF, USDJPY). If you choose Trade_Calc = false, only one pair is turned on. The EA depends on a special indicator to set Buy stop, Buy limit, Sell stop and Sell limit orders Note: If enabled Pendingorders = false, the EA will use the prices shown on the chart in live orders (buy and sell). In this case, the EA uses stop loss a

Alan Hull's moving average, more sensitive to the current price activity than the normal MA. Reacts to the trend changes faster, displays the price movement more clearly. No Repaint Version on separate Windows shows the trend 1 and -1 . Improvement of the original version of the indicator by WizardSerg <wizardserg@mail.ru>. Suitable for all timeframes.
Parameters Period - period, recommended values are from 9 to 64. The greater the period, the smoother the indicator. Method - method, suitable v

The EA consists of multiple virtual Prototype-1 robots (up to 100 strategies depending on the currency pair). Each strategy has different settings. Once the lot sizes for all strategies are calculated, the EA obtains the resulting trading lot. The operation principle is trading within a corridor. When leaving the corridor, the EA closes the positions and saves them for opening in the future. The best condition for trading is a flat, the worst condition is a long trend without rollbacks. Recommen

"Creo que el mejor dinero se gana en los giros del mercado. Todo el mundo dice que te matan tratando de elegir los máximos y los mínimos y que haces todo tu dinero jugando la tendencia en el medio. Bueno, durante doce años he estado perdiendo la carne en el medio, pero he hecho un montón de dinero en los máximos y mínimos".
- Paul Tudor Jones -
Estrategia de inversión: entrar en el mercado cuando se produce un cambio de tendencia o un retroceso. Par de divisas: EUR/USD. Depósito mínimo recome

The Expert Advisor determines the moments of strong movements and opens a position in the direction of the most probable price movement. The strategy always uses stop loss and take profit. Several independent orders can be in the market (the maximum number is set in parameters). The goal of the EA's underlying trading system is the quantitative excess of the number of profitable deals over the number of losing ones. Recommended: EURUSD 5m; GBPUSD 5m; USDJPY 5m. The Expert Advisor is able to work
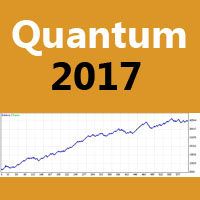
The Quantum Expert Advisor is designed for trading EURUSD H1 . The trading algorithm lies in placing pending orders at the peaks of currency fluctuations, after a preliminary analysis of the market conditions. Trading is fully automated. Lot size is calculated automatically based on the lot percentage.
Parameters MaxRisk - percentage of the deposit, used for the automatic calculation of the lot. LongWave - long wave of price fluctuation. ShortWave - short wave of price fluctuation. Level contro
MetaTrader Market ofrece a todos los desarrollador de programas de trading una sencilla y cómoda plataforma para ponerlos a la venta.
Le ayudaremos con la presentación y explicaremos cómo preparar la descripción de su producto para el Market. Todos los programas que se venden a través del Market están protegidos por una codificación adicional y pueden ser iniciados sólo en el ordenador del comprador. La copia ilegal es imposible.
Está perdiendo oportunidades comerciales:
- Aplicaciones de trading gratuitas
- 8 000+ señales para copiar
- Noticias económicas para analizar los mercados financieros
Registro
Entrada
Si no tiene cuenta de usuario, regístrese
Para iniciar sesión y usar el sitio web MQL5.com es necesario permitir el uso de Сookies.
Por favor, active este ajuste en su navegador, de lo contrario, no podrá iniciar sesión.