Guarda i video tutorial del Market su YouTube
Come acquistare un Robot di Trading o un indicatore
Esegui il tuo EA
hosting virtuale
hosting virtuale
Prova un indicatore/robot di trading prima di acquistarlo
Vuoi guadagnare nel Market?
Come presentare un prodotto per venderlo con successo
Nuovi indicatori tecnici per MetaTrader 4 - 41

Waterstrider Band Waterstrider Band Indicator is a custom Indicator based on my experience in fx trade. This indicator also gives buy or sell signal when the condition are meet the open position rules. For Stop Loss you can put in the highest 3 previous candle + some pips (if SELL position) or put the lowest 3 previous candles + some pips (if BUY position).Trailing stop loss is good when the profit reach 20 pips. Do with your own risk, as we not guaranteed if any loss happen. Thanks H
This indicator changes all the open charts to one single currency pair. This is useful when scanning multiple timeframes for setups and when backtesting strategies across multiple currency pairs.
The image combines this indicator (Set Symbol For All Charts) with the ABHSyncScroller and a Currency Picker. IF you have this indicator and the ABHSyncScroller , send me a message and I will send you the Currency picker and a template for FREE.
Simply add the indicator to one open chart. All th

Ora $ 147 (aumentando a $ 499 dopo alcuni aggiornamenti) - account illimitati (PC o MAC)
Manuale utente di RelicusRoad + Video di formazione + Accesso al gruppo Discord privato + Stato VIP
UN NUOVO MODO DI GUARDARE IL MERCATO
RelicusRoad è l'indicatore di trading più potente al mondo per forex, futures, criptovalute, azioni e indici, fornendo ai trader tutte le informazioni e gli strumenti di cui hanno bisogno per rimanere redditizi. Forniamo analisi tecniche e piani di trading per aiuta

Apollo Price Action System è un indicatore completamente basato sul principio Price Action. L'indicatore fornisce un segnale di acquisto o vendita non appena si formano le condizioni per entrare nel mercato secondo la strategia dell'indicatore. L'indicatore può essere utilizzato come sistema di trading di base o come aggiunta al proprio sistema di trading. L'indicatore può funzionare con qualsiasi intervallo di tempo, ma si consiglia di utilizzare D1. Questo indicatore è molto facile da usare.
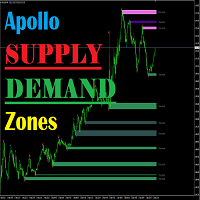
Apollo Supply Demand Zones è un indicatore che calcola i livelli di supporto e resistenza. L'indicatore sarà utile a tutti i trader, indipendentemente dalla strategia che utilizzano. Questo indicatore può diventare uno degli elementi principali del tuo sistema di trading. L'indicatore calcola i livelli sia sull'intervallo di tempo corrente e può funzionare in modalità MTF, visualizzando i livelli da un intervallo di tempo più alto. Questo indicatore può essere utilizzato assolutamente in qualsia
Les opportunités d'arbitrage triangulaire RedeeCash montrent les triades de devises disponibles et chaque configuration de position commerciale de devise en tant que variable globale, sous la forme de
AAA/BBB, CCC/AAA, CCC/BBB : AAA/BBB -1|0|1
AAA/BBB, CCC/AAA, CCC/BBB : CCC/AAA -1|0|1
AAA/BBB, CCC/AAA, CCC/BBB : CCC/BBB -1|0|1
où la valeur est la direction commerciale de OP_BUY ou OP_SELL. Si la direction du commerce indique -1, alors aucun commerce ne devrait avoir lieu pour cette pai
FREE

Lo scanner HFT Scalper scansiona le tendenze del mercato da un indicatore tecnico accurato di Multi-Symbols e Multi-Time frame e lo visualizza su un pannello mobile sul grafico. Il trader può selezionare più coppie di sua scelta per la visualizzazione.
È un ottimo strumento per vedere la direzione della tendenza e può essere utilizzato per il trading manuale o il trading EA consentendo solo di acquistare o vendere ordini in base alla tendenza.

Ready scalping system!
F1 Scalping for MT4 is a complete trading system that analyzes the market instead of you, shows you when you need to open orders and at what level to place TakeProfit and StopLoss in order to get a good result. This is a whole trading complex of tools, packed into one technical indicator. Also, this system can send signals to the trader on the phone. This greatly facilitates the trading process. You receive a signal on your phone, go to your PC and see where you need to
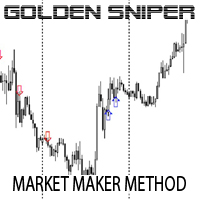
Indicator is based on Market Maker Strategy. NO REPAINT.
MM's are traders and their objective is to make money. This includes strategies to trade against retails traders. The major difference between them and other traders is that they have the ability, through access to massive volumes, to move price at their will. So to make money, they aim to buy at a lower price and then sell at a higher price. They achieve this by: 1. Inducing traders to take positions. This is achieved by using a ran
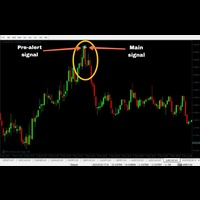
100% non-repaint MT4 indicator with advance pre alert
Recommended candle timeframe M15
Trade expiry 15 minutes
Call buffer 0
Put buffer 1
Intrabar
Pros Neural Network based Advance price action algorithms Advance trend filtering algorithms Advance consolidation filtering algo
Pre-alert (get ready) signals
Non-delay indications
Auto-trading supported
100% Non repaint
100% No lag
No recalculating
Lifetime license
Cons Very few signals
Instructions to use
1 Do not ente
FREE

Night Crawler is a moving average trend trading strategy and delivers over 89 to 90% wining ratio when applied and traded properly. It work for all Timeframe and for every currency pairs trading on the MQL4 Platform. To have a clear trend bias of the market Apply EMA 50 and EMA 21 to your chat to get the best out of this strategy for your overall Trend View.
The Best Timefarme to use is H1 or H4
ENTRY RULES :
For Buy trades :
1. Wait for EMA 21 to Cross Above 50 2. When the arrow (Bl
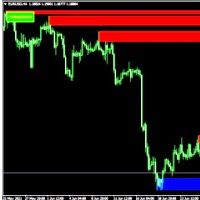
Use the indicator only in retest zones The newly formed zone should be used for scalping only New zones are repainted or recalculated When supports and resistances are violated, they are deleted as they no longer function. Recommended on M30 and higher timeframes You will see the trading zones and identify the most profitable points to open positions. The indicator marks the supply and demand zones. With this show you will now make profitable trades that will set the trends. Shows all support a

The Moving Average Crossover Dashboard indicator is a technical tool that displays the crossovers of 2 selected moving averages on the price chart indicating whether it is a bullish or bearish crossover. In addition, as its name indicates, it shows a signal dashboard that indicates in which market and time frame a crossover of the two moving averages occurs. In the setting window the user can select the markets and time frames that can be displayed on the dashboard. You also have the option

66% discount only for the first 5 buyers (4 left), main price: 300 $
Show the signal as a line graph Prediction of 10 future candles and advanced display Prediction of individual candles graphically Can be used in the gold symbol Can be used in 15 minutes time frame Can be used only in gold symbol and only 15 minutes time frame
How the indicator works:
Using complex mathematical calculations, it predicts the future 10 candles. The predictions of this indicator are based on price. Ther
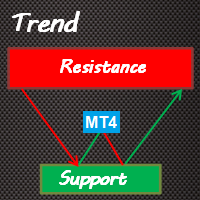
Trend Support Resistance is a fairly simple indicator that provides traders with confirmed immediate support and resistance in whatever timeframe you monitor. It's good for short-term and long-term order blocks. With the default settings, the indicator identifies critical support and resistance areas. Bearish Order Blocks are around the OrangeRed areas while Bullish Order Blocks almost always form near the LawnGreen areas. We have also added a Multi-timeframe feature that can be helpful to allow

This indicator uses a different approach from the previous version to get it's trendlines. This method is derived from Orchard Forex, and the process of making the indicator is demonstrated in there video https://www.youtube.com/watch?v=mEaiurw56wY&t=1425s .
The basic idea behind this indicator is it draws a tangent line on the highest levels and lowest levels of the bars used for calculation, while ensuring that the lines don't intersect with the bars in review (alittle confusing? I kno
FREE
Beta Fort Trader is a moving average trend trading method and gives above over 75 to 90% wining ratio when used according to the given instructions.
The Best Timeframe to use is H1 or H4
It work for all Timeframe and for every currency pairs trading on the MQL4 Platform. To have a clear trend bias of the market Apply EMA 50 and EMA 21 to your chat to get the best out of this strategy for your overall Trend View.
TRADING INSTRUCTION :
For Sell trades :
1. Look out for EMA 21 to Cross

What does this do? It shows you on the chart which stop belongs to which entry. Have you ever had multiple positions or trades open on a single pair and were confused which stop loss goes with what entry? Even worse, the stop loss orders for buy and sells are the same color on the chart. Well, your problem has been solved! This indicator will show you which stop belongs to which entry. It will place a vertical line and an arrow on the chart for each open trade. A yellow line connects the entry

Optimized for Asia- London- US- Open-Session the best Features from MOMENTUM-SOLO true Momentum - time-based Indicator it's based on a self-developed candle Pattern, in relation to the ATR
Filter
Daytime Weekdays Moving Averages Keltner-Channel
Advantages Optimized for Asia- London- US- Open-Session choose your personal times to trade - select Daytime and Weekdays Keltner-Channel => to reduce market noise - sideways movement will be hidden 3x Moving Averages => for the Trend Sig

BeST_Gann Swing Oscillator is an MT4 indicator that is based on the corresponding work of Robert Krausz who introduced it in the book “ A.W.D Gann Treasure Discovered ” .
The Gann Swing Oscillator is a range-bounding technical indicator that oscillates between +1 and -1 and thus it describes the market swings.
Generally when the market is in an upswing, the Gann Swing Oscillator describes it as 2 higher highs with the value of +1 while after an upswing, the downswing is expected.
Also the do

Master Candle (MC) Indicator automatically detects "Master Candles", also known as "Mother Candles", i.e. candle that engulf several candles that follow them. See screenshots. You can choose how many candles Master Candle should engulf. By default it is set to 4. Feel free to change colour and thickness of lines as it suites you.
I find this indicator to be very useful to identify congestions and breakouts, especially on 60 minutes charts. Usually if you see candle closing above or below "Mast
FREE

Infometer индикатор для вывода информации в одном из углов - сколько пунктов (пипсов) или в валюте депозита профита во всех отрытых ордеров данного торгового инструмента. В меню индикатора внесены такие данные 1. Угол вывода информации. 2. Цвет вывода информации. 3. вывод валюты депозита и пипсов. 4. Выбор вывода информации - профит и пункты - профит -пункты. На белом фоне автоматически информация выводится черным цветом на других фонах цвет вывода информации определяется в меню.
FREE
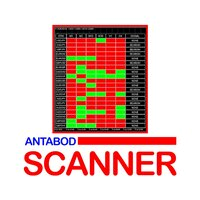
Antabod Scanner, Is a multi-timeframe scanner. It's a metatrader 4 indicator, which allows the detection of the trend of several pairs at a glance. I t will display on the platform any pair or pairs that all the timeframes, from the higher time frame to the lower timeframe, in the inputs, are all bullish or all bearish. When a pair is completely bullish, all the timeframes will be green, or when bearish all the timeframes will be red, and a sound will alert and a written alert will be displayed

Welcome to Investment Castle products This product is exclusively available in the MQL5 market and is not available and will not be available anywehere else. The Combined indicator is a multi-time frame indicator and it is built using 3 indicators: Bands indicator which draws the support and resistance key levels using up to 5 different time frames Patterns indicator which draws the chart patterns using up to 6 different time frames Spots indicator which shows the common candlestick pattern

At the heart of any form of trading is the need to anticipate the direction the markets will go. To make this decision traders cannot afford to ignore trend analysis. Apply this before taking any trades otherwise you will loose. Market Trend Analysis is fundamental part of trading that's based on many indicators, patterns to predict future prices. The process of analysing each symbol can take weeks. This indicator saves the time of sitting and determining the direction of the markets. This indic
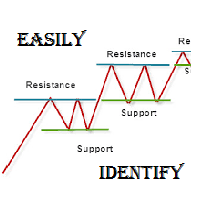
SUPPORT RESISTANCE
Function: Trader will find rejections, Movements & Easily understand to take positions Time Frames: 1 Hour, 4 Hours, Daily Types: Standard, Woodie, Fibonacci Font size & Name: Any Colours: Default black, Trader will find their own Finally this is very important to understand what is indicator. Indicator is just use for indicate not confirmation therefore, experienced traders always guide that do proper cash management & trade wisely. Good Day, Best of Luck :)

This indicator tool provides mini charts, with adjustable symbol/tf that can be dragged and resized into place. Lightweight operation with multiple mini charts are supported.
Chart features: adjustable symbol and tf draggable resizeable multiple mini charts color styling and font sizing, foreground/background colors candle coloring candle styles; candles, bars, line, high-low channel
optional background color gradient predfined period separators on all tf's (eg 1hr/1day sep on 1Min, 4hr/1day

Adaptiv Ma это индикатор средняя линия значение которой выставляется в меню и применяется на тейфрейме Н4. В последствии она адаптируется к выбранному определенному таймфрейму. В меню индикатора задаются следующие параметры 1. Период индикатора 2.Метод определения Ма. 3. Стиль Ма. 4.Толщина линии Ма. 5.Цвет линии Ма.
При переключении между таймфреймами автоматически переключается значение периода Ма для адаптации к новому таймфрейму. Пишите насколько вам была полезен такой индикатор.
FREE
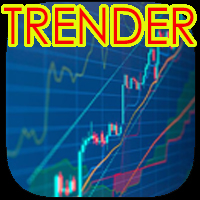
Trender is a special TrendLine Indicator because it is combined with a NON-REPAINT Signal Settings: showBars = if showBars= 0 so the indicator will be shown for all the chart PointLevel = Point Levels; 2 = central bar will be higher (lower) then 2 bars on the left side and 2 bars on the right one. qSteps = number of steps/ no more than 3 BackStep = number of steps back startBar= if startBar=0 so we have recommendation for the current bar, if 1 - for possible next bar TrendLine= True = Trendli

This trend following system was designed by Dennis Gartman and Bill Eckhart , and relies on breakouts of historical highs and lows to take and close trades: it is the complete opposite to the "buy low and sell high" approach. This trend following system was taught to a group of average and normal individuals, and almost everyone turned into a profitable trader.
The main rule is "Trade an N-day breakout and take profits when an M-day high or low is breached (N must me above M)" . Example
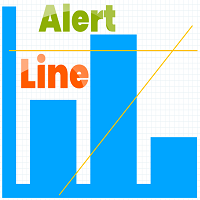
Indicator Rua Alert Line. This indicator will notify when the High-price of candle breaks any TrendLine or HorizontalLine on the chart. Notifications will be sent to the phone and on MT4. And it have ArrowBuy/ArrowSell on chart. It is very useful for those of you who use the TrendLine or HorizontalLine but do not have time to observe the chart. RuaCoder Zalo_Tel: 033.818.8914 Telegram : https://t.me/Ruacoder
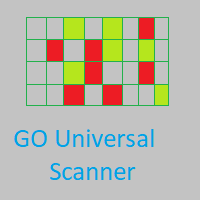
GO Universal Scanner is a simple scanner tool that can be used to scan any indicator on multiple symbols and timeframes. From now on, you don't have to ask anyone for a scanner of your favorite indicator, this scanner can do all the job for you.
You can also jump to the desired symbol and timeframe by simply clicking on the signal on the scanner dashboard. More than that, you the scanner can load your desired template on the newly opened chart. However, please note that, due to mt4 limitations

Scontato a 299 dollari! I prezzi potrebbero aumentare in futuro! Leggi la descrizione qui sotto!
Il miglior sistema di ingresso per la plancia Ultimate Sniper: LIVELLI DINAMICI FINALI. (Si prega di controllare i miei prodotti)
L'Ultimate Sniper Dashboard funziona SOLO sui mercati live a causa dei limiti di test della MT4 multicurrency.
Vi presentiamo l'Ultimate Sniper Dashboard! Il nostro migliore che contiene sia HA-Sniper, MA-Sniper e molte modalità speciali. Il cruscotto Ultimate Sni

Apollo Global Trends è un indicatore di tendenza creato per prevedere il movimento di una tendenza di mercato su qualsiasi coppia di valute, nonché su qualsiasi strumento di trading, inclusi metalli, indici, azioni, criptovalute e altri strumenti di trading. Questo indicatore può essere utilizzato per qualsiasi intervallo di tempo. L'indicatore è adatto sia per il trading a lungo termine che a breve termine. L'indicatore può fungere da sistema principale o da filtro per i tuoi indicatori. Questo
GT Trend è un indicatore di tendenza appositamente progettato per il trading sui grafici M1 e M5 . L'indicatore è ideale per i trader che preferiscono il trading intraday. Puoi utilizzare questo indicatore come base per il tuo sistema di trading o come soluzione di trading autonoma. L'indicatore è facile da usare. Devi solo seguire i segnali. Fornirò inoltre indicatori aggiuntivi a tutti gli utenti di questo indicatore gratuitamente, che aiuteranno a utilizzare questo metodo nel modo più efficie

Un indicatore che visualizza il pattern candela inghiottendo. Nelle impostazioni, è possibile specificare il tipo di engulfing (corpo, ombra e combinazione). È possibile filtrare per tendenza (2 medie mobili) e per inversione (RSI e Bande di Bollinger). Questo è un modello di azione dei prezzi molto popolare. È disponibile una dashboard multi-valuta. Con esso, puoi facilmente passare da un grafico all'altro.
Modelli di trading: Ripetere il test per tendenza. Falso breakout. Blocco ordine. Alt
Solo 9 copie rimaste a 149! Prossimo prezzo 199!
Il nostro cruscotto MA-Sniper è in diretta!
Trova il cruscotto alternativo HA-Sniper qui [ https://www.mql5.com/en/market/product/85666 ]
La soluzione migliore per qualsiasi principiante o trader esperto! NON perdere mai una mossa di nuovo!
Per i commercianti che amano la semplicità e pips, abbiamo un prodotto speciale per voi. Semplice in natura, il cruscotto fa tutto il lavoro guardando 28 coppie di valute con il nostro algorit

L'indicatore mostra segnali basati sull'oscillatore RSI terminale sul grafico. È possibile filtrare i segnali ripetuti.
Qui l'oscillatore viene utilizzato per cercare un segnale inverso. È raccomandato come punto di ingresso nelle strategie swing e nel trading dai livelli.
È disponibile una dashboard multi-valuta. Con esso, puoi facilmente passare da un grafico all'altro. Nelle discussioni sui prodotti, è possibile suggerire un algoritmo in cui è possibile incorporare un dashboard.
Parame
FREE

Questo indicatore mostrerà le sessioni di trading attive e inattive e imposterà variabili globali a seconda che la sessione di trading sia attiva (1) o inattiva (0). Utilizzando la funzione della libreria iCustom, puoi richiamare questo indicatore da un Expert Advisor o da uno script, come segue, // Richiama l'indicatore personalizzato iCustom ( Symbol (), PERIOD_D1 , "Market/RedeeCash_TimeZone" , 0 , 0 ,Blue,Red); // ottenere i valori delle variabili globali double NewYorkSessionIsActive = Glob
FREE

harmonic patterns Harmonic patterns can be used to spot new trading opportunities and pricing trends – but only if you know exactly what you are looking for. Harmonic patterns are formed by combining geometric shapes and Fibonacci levels. As a result, Fibonacci levels are the key concept of these patterns. Identifying harmonic patterns requires more practice than other market classical patterns. But by learning these patterns, you can recognize the future trend of the price chart. These patter
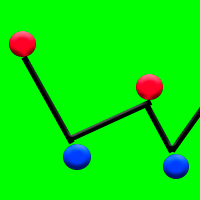
Punto cuoio capelluto: mostra i punti di inversione del prezzo con una precisione del 93%. Non ridisegna punti. Funziona bene durante il movimento laterale dei prezzi quando il mercato è piatto. L'indicatore disegna i punti di inversione o pullback dei prezzi sul grafico.
Come utilizzare questo indicatore nel trading? Aggiungi l'indicatore Dot scalp al grafico. Scarica anche su Internet qualsiasi indicatore di canale che mostra il canale sul grafico. Attendi il movimento laterale del prezzo
A ready-made trading system that shows with arrows when to buy and when to sell. The indicator does not redraw its arrows. Shows signals with 94% accuracy. Works on all currency pairs and all timeframes (recommended timeframes M5, M15, M30, H1). This is a ready-made trading system that trades according to the scalping strategy. The intraday indicator shows a large number of signals on the M5 and M15 timeframes.
How to trade with this indicator? When the red arrow appears, we need to look at t

28 mercati in un unico indicatore! Sono disponibili 8 linee e ognuna rappresenta una valuta { EUR - USD - GBP - JPY - AUD - NZD - CAD - CHF }.
Cosa fa? Calcola un oscillatore personalizzato su tutte i 28 cambi del Forex e traccia la forza di ciascuna valuta. In questo modo è possibile analizzare la tendenza e la volatilità su multivaluta. Inoltre, cliccando su due valute diverse, il mercato cambia istantaneamente, quindi è molto utile per navigare i mercati valutari.
Come usarlo? È possibil
FREE

This indicators automatically draws the support and resistances levels (key levels) for you once you've dropped it on a chart. It reduces the hustle of drawing and redrawing these levels every time you analyse prices on a chart. With it, all you have to do is drop it on a chart, adjust the settings to your liking and let the indicator do the rest.
But wait, it gets better; the indicator is absolutely free! For more information: https://youtu.be/rTxbPOBu3nY For more free stuff visit: https
FREE

RJT SALAMANDER, the indicator as in a video game
VERSION 2
Pilot your PRICE spaceship inside the cavern and avoid the collision against the stalactites (green) and stalagmites (red), dodging these obstacles to win.
When these objects are forming (or disappearing) then you must make the decision how to move your ship (just like in a video game)
Depending on the market and the size of the candles/bars you can adjust the calculation of stalactites and stalagmites (based on the last bars) in
FREE

Have you ever wondered which currency is the strongest at any particular time? Or which currency pair is trending the most. Well, the currency strength meter helps with just that. It compares USD , EUR , AUD , CHF , GBP , CAD and NZD depending on the timeline you have chosen in settings, and ranks them on the number of pips each has moved compared to the rest. N/B: All currency charts of the above pairs must have loaded. You can do this by highlighting all major and minor currencies
FREE

The currency strength momentum has a lot of similarities with currency strength meter presented in the previous page, but the difference are much more pronounced. You can try putting both in the same chart and see the difference in results. Currency strength momentum measures strength of a currency based on (you guess it) it's momentum relative to other currencies, while currency strength meter measures the strength of a currency based on pips it has moved in a certain direction.
FREE

Divergence and Convergence are important harbingers of reversals in stock markets.
The Divergence Sync indicator is designed to automatically search for divergences on a large number of indicators with different parameters.
The search for divergences is carried out on these indicators: (CCI, CHO, DeMarker, MACD, MFI, Momentum, OBV, OsMA, RSI, Stochastic, WPR, Awesome Oscillator ).
To search for divergences, you can use one technical indicator or search simultaneously on any number of indic

Gold Trend Pro Buy & Sell Signal Indicator Pairs : XAUUSD - XAGUSD - Crude OiL, EURUSD,GBPUSD,USDJPY,AUDUSD,GBPJPY,BTCUSD TimeFrame - 1 Min , 5Min, 15Min Once All Are Green Bar , And Also Englufing The Candle You Can Enter To Buy Once All Are Red Bar, And Also Engulfing The Candle You Can Entry To Sell And Next Once Change The Bar Colour , You Can Exit The Buy & Sell Order
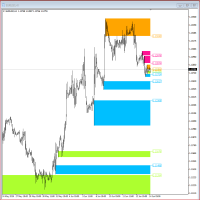
"Supply / Demand Zones"
The concepts of supply and demand zones are undoubtedly two of the most highly discussed attributes of technical analysis. Part of analysing chart of pattern , these terms are used by traders to refer to price levels i n charts that tend to act as barriers, preventing the price of an asset from getting pushed in a certain direction. At first, the explanation and idea behind identifying these levels seems easy, but as you'll find out, supply and demand zones can co
Fx Market Dashboard è uno strumento innovativo che presenta una grafica molto professionale. Semplificare la lettura del mercato è sempre stata una nostra prerogativa e crediamo che con questo strumento tutti possano capire meglio il mercato. Questo strumento si occupa principalmente di darci una visione chiara di quali sono le valute più forti e più deboli, attraverso queste informazioni possiamo iniziare a capire meglio dove il mercato mette denaro o porta via denaro.
La lettura della logic

The Pearson Trend!! My name is Murat Yazici. I have B.Sc. Statistics and M.Sc. Quantitative Methods degrees. I have several scientific papers, conference presentations in Texas, Toronto, London, Istanbul, books and book chapters studies, and many projects about mathematical and statistical modelling. I am also journal reviewer at some scientific journals.
What is The Pearson Trend's Logic? It is based on A Fuzzy Model developed by me. Vague or fuzzy data and application several fields,
'Fibonacci Dimension' indicator allows display of preset or user-defined multi-timeframe Fibonacci levels. It automatically takes the previous high and low for two user-defined timeframes and calculates their Fibonacci retracement levels. It also considers the retraced level to draw the expansions on every change of price. A complete visual dimension in multiple timeframes allows deriving profitable strategies for execution. The functionalities included are: Provides an option to consider a pres
FREE

Basic Fibonacci Calculation Indicator
shows Trend, Stoploss, Profit 1,2,3, will show you your daily Highs and your Daily Lows , it will also show you where it expects the price to move to. best time frame is H1 or higher .
For a better system that also includes my Non-repaint Indicator please check out my paid Fibo Indicator https://www.mql5.com/en/market/product/82323
FREE

The indicator for determining key patterns for the BBMA strategy will perfectly complement the Fibo Musang strategy, and can also be used as an independent tool. IMPORTANT! Contact me immediately after purchase to receive the second file! If you have any questions, I will help you deal with the indicator. Designed to save market analysis time; Sends push notifications to the phone when key moments of the strategy have arisen (Extrem A, Csak, cross the BB line with a candle) Advantages Easy to u

As per name Candles Talk, This Indicator is a affordable trading tool because with the help of Popular Developers & Support of M Q L Platform I have programmed this strategy. I tried to input history of candles with average Calculation regarding High, Low, Last High, Last Low with Moving averages. Furthermore, I have also taken help of Moving average So Trader can easily get in touch with market in another way also. What is in for Trader?
Arrows: Buy Sell Indications (Candles Hig
This indicator scans the Moving Average values for 2 Moving Averages on multiple pairs and multiple timeframes in realtime and displays a Buy signal when the fast MA is above the slow MA and a Sell signal when the fast MA is below the slow MA.
-All the MA parameters(Period, Method and Applied price) can be changed from the inputs window.
-You can either add your own list of pairs to scan or set the scanner to automatically use the pairs in the market watch using the Symbols Source input.
FREE
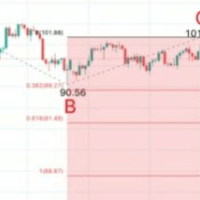
A Chart Analytics Program and helps in asset analysis using the Fibonacci Complex.
The primary Fibonacci numbers used in trading are 61.8% and 38.2%. 8% is derived from dividing any number in the Fibonacci sequence by its previous one. F n / F n-1 2% is derived by squaring 61.8 and alternatively by dividing any number in the sequence by the number two places to its right. F n /F n+2 The second tier of Fibonacci numbers used in trading is 23.6%, 76.4%, and 78.6%. 6% is derived from dividing a
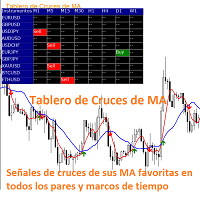
El indicador Tablero de Cruces de MA es un indicador que muestra los cruces de 2 medias móviles seleccionadas en el gráfico de precios indicando si se trata de un cruce alcista o bajista. Además, como su nombre lo indica, muestra un tablero de señales que indica en que mercado y marco de tiempo se produce un cruce de las dos medias móviles. En la ventana de configuración el usuario puede seleccionar los mercados y marcos de tiempo que puede visualizar en el tablero. También tiene la opción de ac

Trend Arrow Super
The indicator not repaint or change its data.
A professional, yet very easy to use Forex system. The indicator gives accurate BUY\SELL signals. Trend Arrow Super is very easy to use, you just need to attach it to the chart and follow simple trading recommendations.
Buy signal: Arrow + Histogram in green color, enter immediately on the market to buy. Sell signal: Arrow + Histogram of red color, enter immediately on the market to sell.
Please email me after your purchase!
Solo 3 copie rimaste a 99! Prossimo prezzo 249!
La soluzione migliore per qualsiasi principiante o trader esperto! NON perdere mai una mossa di nuovo!
Per i commercianti che amano la semplicità e pips, abbiamo un prodotto speciale per voi. Semplice in natura, la dashboard fa tutto il lavoro guardando 12 coppie di valute con il nostro algoritmo personalizzato basato su HikenAshi. Con un solo grafico, puoi leggere il mercato come un professionista. Immagina quanto il tuo trading poss

Sonar Mechanic indicator. Contact me after purchase to receive my template and SonarHistogram balance of power indicator for free! The Sonar Mechanic indicator is a really working indicator, because it works simultaneously on three author's algorithms that correctly determine the trend and counter-trend signals for market entry. The indicator works on all assets and timeframes. Indicator guide here: https://www.mql5.com/en/blogs/post/750128
On gold and currency pairs, it gives good sig
Questo indicatore fa scorrere più grafici contemporaneamente quando si scorre il grafico a cui è collegato l'indicatore. È utile per testare strategie multi-timeframe, strategie multi-coppia, monitorare più grafici contemporaneamente e guardare indietro per vedere come si sono comportati storicamente diversi mercati contemporaneamente. L'indicatore è leggero e può essere utilizzato per spostare fino a 99 grafici contemporaneamente.
Nome dell'indice: keklik ma
Uso: Ma, MACD, RSI e altri indicatori tecnici.
Ciclo consigliato: grafico 1 ora.
Tendenza a lungo termine: EMA 1, EMA 2, EMA 3, EMA 4 disposizione media mobile. Valore predefinito dell'EMA: 7,14,21,63.
Tendenza a breve termine: EMA 1, EMA 2, EMA 3 disposizione media mobile.
Tipo di operatore: Super radicale, radicale e moderato. Il valore predefinito è 2. (0 robusto: segnale EMA attraversa ema3, 1 radicale: segnale EMA attraversa ema2, 3
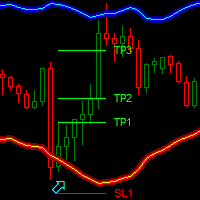
Dark Bands is an Indicator for intraday trading. This Indicator is based on Counter Trend strategy but use also Volatility. We can enter in good price with this Indicator, in order to follow the inversions on the current instrument.
Key benefits
Easily visible take profit/stop loss lines Reliable bands lines with futuristic colors, and Intuitive directional arrows Useful statistics , which indicate the win rate of the signals Plus Package available, leave a feedback to recei
FREE
Scarica i dati mancanti per tutte le coppie di valute disponibili in Market Watch. Molto utile per il backtesting di EA e strategie e per scaricare tutta la cronologia in una volta invece che individualmente. L'indicatore funzionerà fino a quando non saranno stati scaricati tutti i dati storici per le coppie di valute selezionate. L'indicatore ha più opzioni: 1. Scarica i dati per singola coppia 2. Scarica solo per la coppia corrente 3. Scarica per le coppie selezionate 4. Scarica per tutte le c
FREE
An indicator that will help you trade. This indicator will show trend reversals as well as pullbacks. When the arrow appears, it will mean that now the trend will either change its direction, or there will be a rollback from the main movement. In any of the cases, if the trader knows about it in advance, it is possible to open trades effectively. This indicator does not redraw its values. The arrow appears at the beginning of the candle and stays there.
How to trade with this indicator: W

This indicator takes input from the ADX from multiple time frames (M/W/D/H4/H1), and presents the output on the main chart. Great for scalping. Features alert for current chart's ADX. TrendLine period setting.
How to use: Simply attach to any chart. User can set the period for ADX(Monthly, Weekly, Daily, H4, H1,Current chart) Zoom chart out completely. Hover over the lines to see the time frame applicable. Buy when Multi ADX below price; also blue dots and white line below price. Sell when Mul

Imbalance / FVG MTF Mark Imbalance on chart of Selected Multi Time frames. Trend is Manually set to filter signals in the chosen direction by a button on the chart. .
Futures Auto Mark Imbalance / FVG on chart on selected time frames
Select time frames by buttons on chart
Popup Alert, Push Notification or email when New Imbalance Form
Popup Alert, Push Notification or email when Imbalance is Taken out
Select Alert Mode to be a single or multiple Imbalance ( OR / AND option ) when Imbalan

MACD Scanner provides the multi symbols and multi-timeframes of MACD signals. It is useful for trader to find the trading idea quickly and easily. User-friendly, visually clean, colorful, and readable. Dynamic dashboard display that can be adjusted thru the external input settings. Total Timeframes and Total symbols as well as the desired total rows/panel, so it can maximize the efficiency of using the chart space. The Highlight Stars on the certain matrix boxes line based on the selected Scan M
Scopri come acquistare un robot di trading dal MetaTrader Market, il negozio di applicazioni per la piattaforma MetaTrader.
Il sistema di pagamento di MQL5.community supporta le transazioni tramite PayPal, carte bancarie e gli altri sistemi di pagamento più diffusi. Per essere pienamente soddisfatto, ti consigliamo vivamente di testare il robot di trading prima di acquistarlo.
Ti stai perdendo delle opportunità di trading:
- App di trading gratuite
- Oltre 8.000 segnali per il copy trading
- Notizie economiche per esplorare i mercati finanziari
Registrazione
Accedi
Se non hai un account, registrati
Consenti l'uso dei cookie per accedere al sito MQL5.com.
Abilita le impostazioni necessarie nel browser, altrimenti non sarà possibile accedere.