Unisciti alla nostra fan page
- Pubblicati da::
- Nikolay Kositsin
- Visualizzazioni:
- 13766
- Valutazioni:
- Pubblicato:
- 2012.02.01 12:05
- Aggiornato:
- 2023.03.29 13:44
-
Hai bisogno di un robot o indicatore basato su questo codice? Ordinalo su Freelance Vai a Freelance
Real author:
dm34@mail.ru
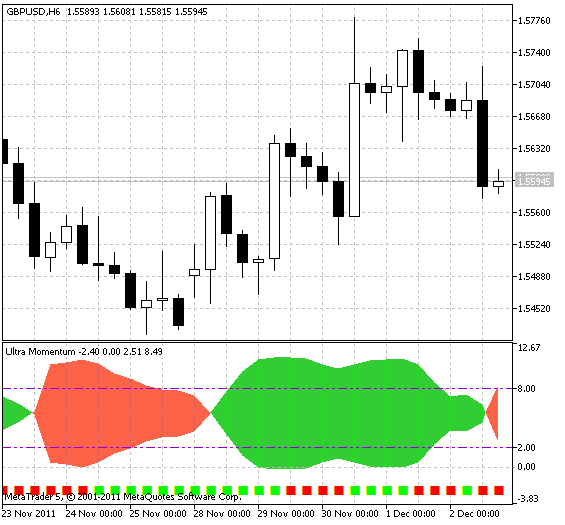
This indicator is based on Momentum and the analysis of a trend direction of its multiple signal lines. Signal lines calculation algorithm is as follows. We have indicator input parameters as source data:
- StartLength - minimum initial value of the first signal line;
- Step - period change step;
- StepsTotal - number of period changes.
Any period value from the multitude of signal lines is calculated using arithmetic progression:
SignalPeriod(Number) = StartLength + Number * Step
The value of Number variable ranges from zero to StepsTotal. Obtained values of the periods are added to the variables array and are used at each indicator tick to get the array of smoothed RSI indicator values. Directions of the current trend for each of the smoothings are calculated and also the number of positive and negative trends for the whole array of RSI smoothed values is determined. The final number of positive and negative trends is smoothed in its turn and used as the indicator lines that form a color cloud displayed with the help of the DRAW_FILLING style class.
A trend direction in this indicator is determined by the cloud color, while its power is determined by the cloud width. You can use the overbought (UpLevel) and oversold (DnLevel) levels that are set in percent value from the indicator maximum amplitude.
Also, the indicator provides the possibility to determine the direction of trend power change speed displayed as color squares. In case a trend power increases, the color of these squares will match the cloud color, otherwise, the squares will be colored in the opposite color.
Smoothing algorithms can be selected out of ten possible versions:
- SMA - simple moving average;
- EMA - exponential moving average;
- SMMA - smoothed moving average;
- LWMA - linear weighted moving average;
- JJMA - JMA adaptive average;
- JurX - ultralinear smoothing;
- ParMA - parabolic smoothing;
- T3 - Tillson's multiple exponential smoothing;
- VIDYA - smoothing with the use of Tushar Chande's algorithm;
- AMA - smoothing with the use of Perry Kaufman's algorithm.
It should be noted that Phase parameters for different smoothing algorithms have completely different meaning. For JMA it is an external Phase variable changing from -100 to +100. For T3 it is a smoothing ratio multiplied by 100 for better visualization, for VIDYA it is a CMO oscillator period and for AMA it is a slow EMA period. In other algorithms these parameters do not affect smoothing. For AMA fast EMA period is a fixed value and is equal to 2 by default. The ratio of raising to the power is also equal to 2 for AMA.
The indicator uses SmoothAlgorithms.mqh library classes (must be copied to the terminal_data_folder\MQL5\Include). The use of the classes was thoroughly described in the article "Averaging Price Series for Intermediate Calculations Without Using Additional Buffers".

Tradotto dal russo da MetaQuotes Ltd.
Codice originale https://www.mql5.com/ru/code/741
 XMA Ichimoku Channel
Envelope construído pelas médias móveis e calculado da mesma maneira que os de Ichimoku Kinko Hyo.
 LinearRegSlope_V1_HTF_Signal
LinearRegSlope_V1_HTF_Signal shows a trend direction as a graphic object with colored trend indication and sends alerts or audio signals in case the trend changes.