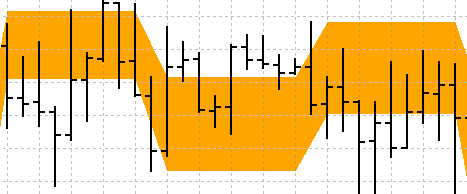
- DRAW_NONE
- DRAW_LINE
- DRAW_SECTION
- DRAW_HISTOGRAM
- DRAW_HISTOGRAM2
- DRAW_ARROW
- DRAW_ZIGZAG
- DRAW_FILLING
- DRAW_BARS
- DRAW_CANDLES
- DRAW_COLOR_LINE
- DRAW_COLOR_SECTION
- DRAW_COLOR_HISTOGRAM
- DRAW_COLOR_HISTOGRAM2
- DRAW_COLOR_ARROW
- DRAW_COLOR_ZIGZAG
- DRAW_COLOR_BARS
- DRAW_COLOR_CANDLES
DRAW_FILLING
The DRAW_FILLING style plots a colored area between the values of two indicator buffers. In fact, this style draws two lines and fills the space between them with one of two specified colors. It is used for creating indicators that draw channels. None of the buffers can contain only empty values, since in this case nothing is plotted.
You can set two fill colors:
- the first color is used for the areas where values in the first buffer are greater than the values in the second indicator buffer;
- the second color is used for the areas where values in the second buffer are greater than the values in the first indicator buffer.
The fill color can be set using the compiler directives or dynamically using the PlotIndexSetInteger() function. Dynamic changes of the plotting properties allows "to enliven" indicators, so that their appearance changes depending on the current situation.
The indicator is calculated for all bars, for which the values of the both indicator buffers are equal neither to 0 nor to the empty value. To specify what value should be considered as "empty", set this value in PLOT_EMPTY_VALUE property:
#define INDICATOR_EMPTY_VALUE -1.0
|
Drawing on the bars that do not participate in the indicator calculation will depend on the values in the indicator buffers:
- Bars, for which the values of both indicator buffers are equal to 0, do not participate in drawing the indicator. It means that the area with zero values is not filled out.

- Bars, for which the values of the indicator buffers are equal to the "empty value", participate in drawing the indicator. The area with empty values will be filled out so that to connect the areas with significant values.

It should be noted that if the "empty value" is equal to zero, the bars that do not participate in the indicator calculation are also filled out.
The number of buffers required for plotting DRAW_FILLING is 2.
An example of the indicator that draws a channel between two MAs with different averaging periods in a separate window. The change of the colors at the crossing of moving averages visually shows the change of the upward and downward trends. The colors change randomly every N ticks. The N parameter is set in external parameters of the indicator for the possibility of manual configuration (the Parameters tab in the indicator's Properties window).

Note that initially for plot1 with DRAW_FILLING the properties are set using the compiler directive #property, and then in the OnCalculate() function new colors are set randomly.
//+------------------------------------------------------------------+
|