Thiago Duarte / Vendeur
Produits publiés

As it name implies, this is an exaustion oscillator. However, you may wonder: what differs you from others oscillators like RSI, Stochastic, CCI etc? The difference is that ours is more powerful and accurate ! Your oscillator filters the nois e made by other oscillators, and shows you only the exact moment to enter the trade. Of course, using it alone, like any other indicator, has its risks. Ideally, reconcile it with technical analysis and/or others indicators. If you have any doubt or suggest
V-Flow is a Trading System that takes into account volume, flow and other factors to give a signal when to enter, hold and close a position. There are two trading modes: conservative and aggressive . CONSERVATIVE: In this mode, the system shows you when to trade by painting the graph according to the signal (buy or sell). After that, when the trend ends, the graph turns gray, indicating the time to exit the operation. However, if the histogram at the bottom still points to the same trend, it is

Trade Copy is an EA-shaped tool that replicates the trades done on a Meta Trader 5 to all Meta Traders 5 opened on same computer. Is useful if you want to trade more than once account yours or if you want to work with third party account management. Demo version: https://www.mql5.com/pt/market/product/40906 MT4 version: https://www.mql5.com/pt/market/product/40902/ Configurations: MAIN OPTIONS Idiom - change to English or Portuguese. Copy trades from - specify if the trades will be copied fro
This indicator combines TRIX (Triple Exponential Moving Average) with a Moving Average, which can be simple, exponential, smoothed or weighted.
This combination is very useful to identify the main trend and when it is changing to a new direction.
The indicator also has signals on the chart that indicates the TRIX crossing with the Moving Average, as well as pop-up alerts and push (in the MT5 app).
Enjoy it!
FREE

Volume Weighted Average Price or VWAP is an indicator wich shows different average prices on chart. This is very useful to find strong negotiation price areas and as trend following.
Configurations: Day, Week and Month - Show different VWAPs according to the period. You can change each line style on "colors" tab.
Any doubt or suggestion please contact us. Enjoy! This is a free indicator, but it took hours to develop. If you want to pay me a coffee, I appreciate a lot <3 PayPal, Skrill, Ne
FREE
Have you missed any tools or shortcuts in Meta Trader? Simple things that would make your daily trading much easier ?
We have the solution for you: our Trade Panel!
This is an EA tool (Expert Advisor) that, if configured to controll all symbols, needs to be loaded only once.
This is the Lite version (free) of our tool. Professional version: https://www.mql5.com/en/market/product/42658 If you have some problemas with the shortcut buttons on chart on unpinned mode try change the tickets d
FREE

HiLo Activator is a technical analysis indicator developed by Robert Krausz, a renowned hungarian trader with a career in the USA.
It is a trend indicator that helps you to predict the cange of the current trend. In an uptrend it is displayed at the bottom of the candles; in a downtrend it is displayed at the top.
Its only setting is the calculation period.
It is possible to have alerts when a new trend begin. Enjoy! This is a free indicator, but it took hours to develop. If you want to pay m
FREE

RSI with moving average is great to see when the price is overbought and oversold instead of RSI only.
INPU T PARAME TERS : RSI:
Period - RSI period.
Price - RSI applied price.
Color scheme - RSI color scheme (4 available). MOVING AVERAGE:
Period - MA period.
Type - MA type.
Apply - MA applica tion.
Shift - MA shif t (correc tion). PRICE LINE:
Show - specify if line with price, only line or nothing.
Style - line style. OTHER:
Overbought level - specify the level .
Overboug
FREE

Donchian Channel is an indicator created by Richard Donchian. It is formed by taking the highest high and the lowest low of the last specified period in candles. The area between high and low is the channel for the chosen period.
Its configuration is simple. It is possible to have the average between the upper and lower lines, plus you have alerts when price hits one side. If you have any questions or find any bugs, please contact me. Enjoy!
FREE
Pointer Sync is a pointer synchronizer between open charts. It makes the MT5 cross (activated by the middle mouse button) to be replicated on all open charts. In addition, it is possible to create horizontal lines (letter H) and vertical lines (letter V), very useful for studying. The appearance of the lines is customizable. Note: Synchronization is through the X and Y scale in pixels , not price and/or date. It is a simple and free utility. Enjoy!
This is a free indicator, but it took hours t
FREE
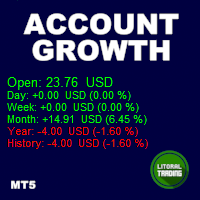
Tired of calculate every weekend and the end of the month to know how much you've earned and how much your capital has grown?
Then this indicator will help you! It informs you how much your capital has grown in money and percentage in the day, week, month, year and in history, plus show how much volume ou used, how much trades you did and how much comission and swap you paid. Alo the open positions result are showed in money and percentage. Note: The amount of trades displayed may differ from
Are you the type that likes to protect your trades by moving the stop loss to the entry point and also using trail stop?
Cool! This EA will help you with that. What's more, it also partially closes the trade when the trail stop is activated. That's it!
Beyond all this it shows the stop loss projection (which you can move) and notify you when it is activated.
EA can be used by configuring the default window or by using a custom window , which makes it easy to change settings.
You can t
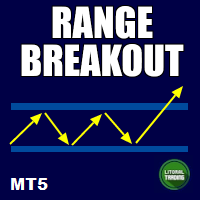
This is an indicator that highlights the price range, specifically in the morning. So it is very easy to identify when these zones are broken, giving you an excellent entry opportunity! Range Breakout works on all symbols and timeframes. It displays past price regions and projects the current one. If you find any bug or have any suggestion, please, contact us. Enjoy!

Do you, like me, like to trade with the trend? Then this indicator will help you! Rainbow Trend is a trend indicator, which uses several Moving Averages on the chart.
It measures different trend strenght zones for different periods: very long term, long term, mid term, short term and very short term.
Each zone has its color, and it is possible to have sound alert when the prices leaves a zone and enters another.
Its configuration is very simple. If you find any bug or have any suggestions, co
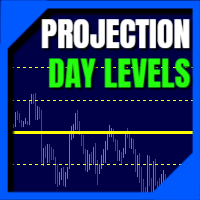
Daily Projection Levels , as the name implies, is an indicator that project the price changes in percentage above and below the opening of the day (or closing of the previous day.
These are "psychological" support and resistance areas where price tries to retrace or break out.
With this you have a powerful tool to predict what these zones will be! You can define which projection levels you want (up to 5 above and below), in addition to have alert messages and visual customization. If you want
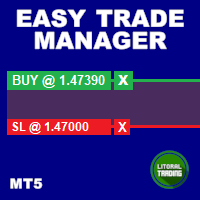
LT Easy Trade Manager is a tool in EA type that makes operation more intuitive. As in other programs, Meta Trader lacks graphical information, even though it is an excellent program. With that in mind we have created this tool. It makes it easy to view the entry point, Take Profit and Stop Loss, as well as the floating profit from operation. It also automatically corrects the SL and TP price (optional) and highlights the price and opening time of the operation (optional). Plus, you can close par
FREE
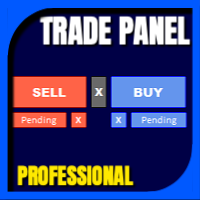
Do you like Meta Trader? Nice, me too. Have you missed one or more features that could exist in it? Me too. Annoyed by this, I decided to create the Trade Panel. This tool has two versions: Lite and Pro. It is literally magical! It expands, and a lot, the possibilities of your Meta Trader! It ceases to be a good program and becomes excellent! Do you doubt? It is okay. Buy and see for yourself ;) One warning: you will love it! Lite version (free): https://www.mql5.com/en/market/product/40410 A
Active Symbol is a tool that works together with our Trade Panel. Since version 1.2 our panel can manage multiple symbols without having to open it in all of them, just one. This tool make this possible, because with it the actual or remote symbol information are saved for our Trade Panel to use. Remember to enable the panel control mode in the all symbols function. If you have some problemas with the shortcut buttons on chart on unpinned mode of Trade Panel try change the tickets digits option.
FREE

This is a buyer and seller aggression indicator that analyzes the shape of each candle and project this data in a histogram form. There are 4 histograms in one. On the front we have two: Upper - Buyer force. Lower - Seller force. At the background we also have two histogram, both with same color. They measure the combined strenght of buyers and sellers. This histograms can be turned off in Input Parameters. It is also possible to have the real or tick volume to help on this force measurement. IN
FREE
Trade Copy is an EA-shaped tool that replicates the trades done on a Meta Trader 5 to all Meta Traders 5 opened on same computer. Is useful if you want to trade more than once account yours or if you want to work with third party account management. The images are from MT5 because it is the same as MT4. Demo version: https://www.mql5.com/pt/market/product/40947 MT5 version (more advanced): https://www.mql5.com/en/market/product/40901 Configurations: MAIN OPTIONS Idiom - change to English or

Easy Trend , as the name implies, is an indicator that easily shows the prevailing trend by bringing several indicators into one. The strategy is: when all indicators point in the same direction a signal is triggered. When red, is a signal to sell, when blue, signal to buy. It is that simple :) There are a total of 9 indicators: Moving Average, RSI, CCI, Parabolic SAR, William's Range, Stochastic, MACD, ADX and Heiken Ashi. It is possible to configure each of these indicators to suit your way of

I know, you have an idea for an EA and would like to develop your own without the need of a programmer? Then LT Sandbox EA will help you with that! As the name says (sandbox), you can configure it the way you want (within your limitations, of course). With it you can use up to 13 indicators, including an external indicator (from a third party), being able to make dozens of combinations! Available indicators: Moving Average (two of them) RSI Stochastic Oscillator MACD Bollinger Bands Parabolic S
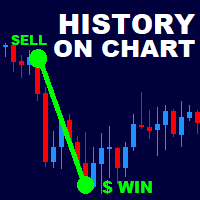
History On Chart is an indicator that shows the "trail" of all trades made in a specific period of time. It shows the entry and exit point with their respective dates and prices. It also shows the type of trades and the cash result. Open trades are also displayed, but only the entry point. The indicator is free and fully customizable. If you have any questions please contact us. Enjoy!
This is a free indicator, but it took hours to develop. If you want to pay me a coffee, I appreciate a lot
FREE

Easy Market makes the market easier to trade. It allows you to see an "eternally" side (no trend) market, making it extremely easy to see when the price is overbought or oversold. Both trend and consolidation traders will like Easy Market. You can use it as an auxiliary window (below chart) or in full screen mode. See the screenshots and note how it gives you accurate entries! If you have any doubt or suggestion, please, contact us! Ejoy!
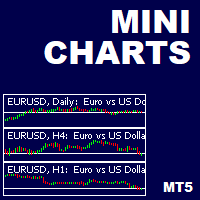
This is a utility indicator that creates mini charts on left side of the chart you are looking at.
It is very useful to watch many timeframes simultaneously, without having to change between multiple charts. Its configuration is very simple. You can have up to 4 mini charts opened. They automatically load the template of the "parent" chart. If you have any doubt please contact me. Enjoy!
This is a free indicator, but it took hours to develop. If you want to pay me a coffee, I appreciate a lot
FREE
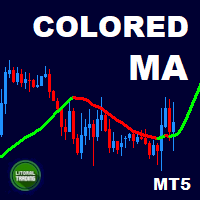
Are you the type who likes to use moving averages and surf the trend? Me Too! that is why I developed this indicator. It is basically a moving average that changes the color according to the trend (up or down). Its appearance can be customized and the price method too. The setup is very simple, no need to explain. If you have any questions or find any errors please contact us! Enjoy!
This is a free indicator, but it took hours to develop. If you want to pay me a coffee, I appreciate a lot <3
FREE
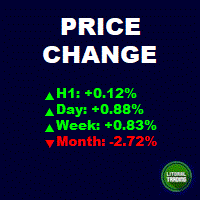
This is an informant indicator, very simple. It shows how much the price has chanded in percentage in certain period (month, week, day and actual period). It is discreet and small, does not visually posslute the chart. If your MT is not on portuguese idiom the indicator will automatically change to english. Check out our most complete tool for the market, the Trade Panel: https://www.mql5.com/en/market/product/42658 If you have any suggestion or find any bug, please, contact us. Enjoy!
This i
FREE

For those who like trend the Force will be a very useful indicator. This is because it is based on the famouse ADX, which measure the strenght of a trend, but without its 3 confusing lines. Force has its very simple interpretation: if the histogram is above zero level the trend is up, otherwise it is down. You can use it to find divergences too, which is very profitable. Thanks to Andre Sens for the version 1.1 idea. If you have any doubt or suggestion, please, contact me. Enjoy!
This is a fre
FREE

This is a conventional volume indicator, which displays the ticks or real volume (if available from your broker). But it has others features like: 5 color schemes: single, when crossing with moving average, when crossing a specific level, when having different volume between bars and when candle change color. Being hable to have a customizable moving average. Being hable to have a value indicator line. Many thanks to Diego Silvestrin for the ideas to version 1.1 and Konstantin Demidov for
FREE

Are you a trend surfer like us? Do you use Moving Averages too? Ever wanted the are between them to be painted? Yeah, we solved this problem with the Filled MAs indicator! It is very simple, just puts two fully customizable Moving Averages on chart and fill the space between them, changing the color as they intersect. Thanks to gmbraz for the version 1.1 idea. Any questions os suggestions please contact me! Enjoy!
This is a free indicator, but it took hours to develop. If you want to pay me a
FREE
Protect My Trades is an EA (expert advisor bot) that automatically put stop loss and take profit on market trades and pending orders. You can specify if want it to do this only on actual symbol trades or in all others. Its configuration is very simple. Functions: Take profit: distance to TP (0 = disabled, no TP will be created).
Stop loss: distance to SL (0 = disabled, no SL will be created).
Price type: price type in pips or pipets/points (pips is common in Forex).
Actual symbol only: manage
FREE
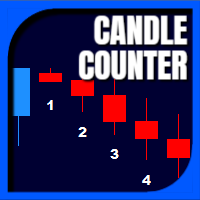
Candle Counter is a simple indicator that list the amout of candles in the day according to the current chart timeframe. It is specially useful for those teaching others how to trade, as it can draw attention to a specific candle of the day. Configuration:
Reverse mode - if on, the actual candle is the first one.
Position - Above or below the candles.
Vertical distance - Vertical distance from the candles in pipets/points.
Size - Font size. If you need help please don't hesitate to contact
FREE

Auto Fibo Expansion is an indicator that projects the Fibonacci expansion levels above and below the opening price of the day. It does the calculation based on the previous day and projects the levels on the current day. It is very efficient to find "psychological" zones of support and resistance. Its appearance is all configurable and you can set up to 30 different levels. Enjoy! This is a free indicator, but it took hours to develop. If you want to pay me a coffee, I appreciate a lot <3 PayP
FREE

Using the Stochastic Oscillator with a Moving Average is a simple but very efficient strategy to predict a trend reversal or continuation.
The indicator automatically merges both indicators into one. It also gives you visual and sound alerts.
It is ready to be used with our programmable EA, Sandbox, which you can find below: Our programmable EA: https://www.mql5.com/en/market/product/76714 Enjoy the indicator!
This is a free indicator, but it took hours to develop. If you want to pay me a c
FREE

The Weis Wave first takes the market volume and then organizes it with the price into Wave charts. It is the only software that will present the true picture of the market before you. If anyone of you, has watched an intraday price movement then you must know that it unfolds in a series of selling as well as buying waves-a procedures tearing down and building up. Wave analysis is an integral part of the trading method. The indicator helps to deal with today’s volatile market. Moreover, it works
FREE
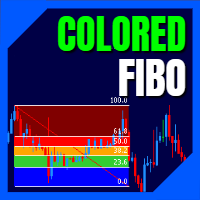
LT Colored Fibo is a simple indicator that paints the price zones between Fibonacci Retracement levels. Its configuration is extremely simple. It is possible to change the colors of each level of the retracement, choose between background or front of the chart and also work only with the current asset or all open. If you found a bug or have any suggestion for improvement, please contact me. Enjoy!
This is a free indicator, but it took hours to develop. If you want to pay me a coffee, I appreci
FREE
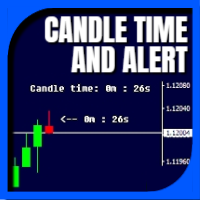
This indicator show the candle remaining time on the chart and/or in the corner of the window. It also display notificaton (popup and push) when a new candle is formed (optional). You configure the timer on candles and at chart corner. I don't need to explain the functions because are very simple. MT4 version: https://www.mql5.com/en/market/product/38677 Any doubt or suggestion please contact us. Enjoy!
This is a free indicator, but it took hours to develop. If you want to pay me a coffee, I
FREE

This indicator draw a line on high and low levels of X number of days. It is possible to have an alert (in the software and mobile app) for when the price breaks the high or low of the current day. Configurações: Days - past days to calculate (1 = actual day only).
Alert when reach levels - activate the alert for specific levels or both.
Push notification - enable the alert to the mobile MT5 app.
Appearance
High - high level color.
Low - low level color.
Size actual day - thi
FREE
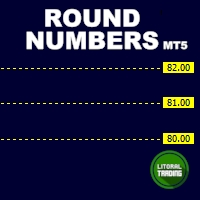
Round numbers (or key levels) is an amazing strategy. These numbers are strong support and resistance levels. So what this indicator does is draw horizontal lines on the chart to help you find these levels. Configurations: Key levels in pips - distance between the lines. Color - lines color. Style - lines style. Width - lines width. Display at background - draw lines in front or back of candles. Selectable - turn on or off the option to select the lines. Lines identification - identifica
FREE

News Trade is a semi-automatic EA that uses the two pending orders strategy, one above and one below the price, with a predefined distance between them.
Both follow the price untill the news moment, where they stop moving. After the price hit one of them the other is automatically canceled.
The trailing stop and step are applied and may also have the automatic partial closing. This EA is perfect for trading high impact news like Payroll, for example. You can test it on Strategy Tester with no
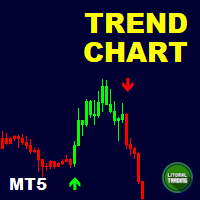
Are you the trend surfing type? Do you like to follow the big sharks? Nope? So you are the type that trades reversion? Awaiting the trend exhaustion and entering on trade?
So this indicator is for you ! With it is extremely easy to identify the trend and when it reverses because the chart is automatically colored according to a defined moving average. You can change it settings and make it your own (or hide it).
In addition it is possible to have indicative arrows on chart and also popup and

Do you like trade Technical Analysis like I do? Then you will like this indicator, because it automatically calculates the support and resistance of the asset in simultaneous timeframes, or the famous MTF (Multi Time Frame). In addition to support and resistance, it is possible to have alert signals when the price breaks or touches (or both). Its configuration is very simple. The visual is fully configurable. Enjoy it!

Are you tired of erasing the objects on chart and then having to put them back in? What if you had a tool that would allow you to hide and show all objects any time? Cool, huh? That is why I developed this tool as an indicator. With it you hide all objects using a shortcut button on chart or the keyboard (customizable). If you have any suggestions or find a bug, please, contact us. Enjoy!
FREE
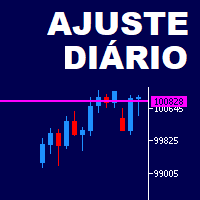
This is a tool in script type. It shows in chart the actual and/or past day ajust price in a horizontal line. The symbol name and it expiration must be set up according to the actual parameters. The lines appearance are fully customizable. You need to authorize the B3 url on MT5 configurations: www2.bmf.com.br. You need this to the tool can work. This is a tool for brazilian B3 market only!
FREE
This indicator draw a watermark on the chart, with the timeframe and symbol name. You can change everything, including add a aditional watermark. Functions: Symbol watermark: Size - text size. Font - text font. Color - text color. Background text - watermark at foreground or background mode. Horizontal correction - x correction in pixels. Vertical correction - y correction in pixels. Separator period X symbol - what will separate the period from symbol. Aditional watermark: Enable custom
FREE
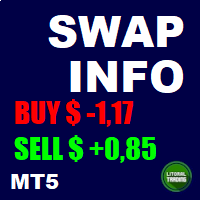
This is a script based tool that informs the swap from all the currency pairs (gold and silver too). It is possible to highlight pairs with a specific currency and whether the swap is positive or negative. In addition it is possible to complement the name of the symbols depending on the broker. The informations are showed in the Experts tab of the Toolbox (Ctrl+T). If you have any doubt or suggestion, please, contact us. Enjoy!
FREE
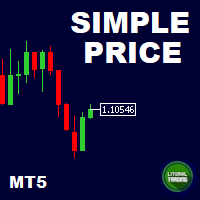
This is our simplest tool! With it you hide the Bid and Ask lines from chart and have only a small rectangle showing what current price is. This tool is useful for those who want the cleanest chart possible. You can also show the Ask price only, instead of the Bid (most common). To further assist you in cleaning the chart check out our other tool: https://www.mql5.com/en/market/product/41835 Any questions or suggestions, please contact us. Enjoy!
FREE

New Candle Alert is a simple indicator that notify you when a new candle is formed. Func tions : Alert type - option to choose between message with sound or only sound. Message - alert message. Push notifications - enable push notifications. Show timeframe - show the symbol timeframe. Show hour - show the alarm time. Test message - if you don't want to wait a new candle formed to see the message. MT4 version: https://www.mql5.com/pt/market/product/37988 Hope you enjoy it. Any doubt or su
FREE

We stopped creatin small tools for MT4. Our focus are on MT5. Only very useful tools maybe we will develop to MT5. New Candle Alert is a simple indicator that notify you when a new candle is formed.
You can modify the notification message that will appear for you. The alarm sound is default by meta trader program.
MT5 version: https://www.mql5.com/pt/market/product/37986
Hope you enjoy it. Any doubt or suggestions please notify on private or by comments.
See ya.
FREE
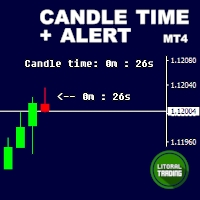
This indicator show the candle remaining time on the chart and/or in the corner of the window. It also display notificaton (popup and push) when a new candle is formed (optional). You configure the timer on candles and at chart corner. I don't need to explain the functions because are very simple. MT5 version: https://www.mql5.com/pt/market/product/38470 Any doubt or suggestion to a new feature please comment. Enjoy!
FREE

Candle cross MA is an indicator that works "silently", that is, drawing only a moving average on the chart.
It alerts you when the last candle cross with a moving average that you set. Alert is given only when the candle closes.
The moving average settings are fully customizable.
The indicator sends popup, and push notifications. You can also deactivate alerts when the chart is inactive. Are you the trend type? Do not miss another opportunity!
FREE
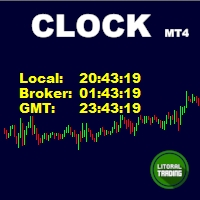
Simple indicator that draws the market hours on chart (broker, local and GMT). Functions: Horizontal distance - from border. Vertical distance - from border. Color - text color. Font - text font. Size - text size. Corner - which chart corner will be drawn. Show seconds - show or hide seconds. Draw as background - candles front or back. Label local - text before local time. Label broker - text before broker time. Label GMT - text before GMT time. Object ID - identification from object
FREE
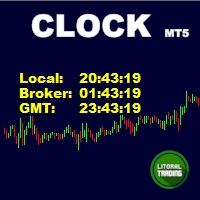
Simple indicator that draws the market hours on chart (broker, local and GMT). Functions: Horizontal distance - from border. Vertical distance - from border. Color - text color. Font - text font. Size - text size. Corner - which chart corner will be drawn. Show seconds - show or hide seconds. Draw as background - candles front or back. Label local - text before local time. Label broker - text before broker time. Label GMT - text before GMT time. Separator - separator between label and time Objec
FREE
This is a simple indicator that shows the spread in points. It is useful for those like trade scalper, in addition to be customizable.
Functions:
Color - I don't need to explain :) Font type - I don't need to explain :) Font size - I don't need to explain :) First text - text in front of spread number Second text - aditional text after the spread number. Corner - specify the corner where the spread will be written. Horizontal distance - horizontal distance from the edge. Vertical distance -
FREE
This indicator draw a watermark on the chart, with the timeframe and symbol name. You can change everything, including add a aditional watermark. Functions: Symbol watermark: Size - text size. Font - text font. Color - text color. Background text - watermark at foreground or background mode. Horizontal correction - x correction in pixels. Vertical correction - y correction in pixels. Separator period X symbol - what will separate the period from symbol. Aditional watermark: Enable custom
FREE
Trailing Step is an EA that lets the order's stop loss at a specific distance of current price, set by pips. Its configuration is very simple:
Trailing stop in pips - sets the stop loss distance in relation to the current price in pips. Trail step in pips - sets the "step" of stop loss in pips.
Never miss a trade by forgetting to move the stop. Guarantee your profit!
Any doubt or suggestion do not hesitate in contact us.
Enjoy!
Obs. You need to set the stoploss when you open your trade
FREE
Round numbers (or key levels) is an amazing strategy. These numbers are strong support and resistance levels. So what this indicator does is draw horizontal lines on the chart to help you find these levels. Configurations: 1St level: Color - lines color. Style - lines style. Width - lines width. 2Nd level: Second level lines? - turn off second level lines. Color - lines color. Style - lines style. Width - lines width. Space between lines in points - I don't need explain :) Display at backg
FREE

This is a simple indicator that shows the spread in points. It is useful for those like trade scalper, in addition to be customizable. Functions: Color - I don't need to explain :) Font type - I don't need to explain :) Font size - I don't need to explain :) Aditional text - aditional text after the spread number. Corner - specify the corner where the spread will be written. X position - horizontal distance from the edge. Y position - vertical distance from the edge. Check out our others indicat
FREE