|
8+ années
expérience
|
60
produits
|
212
versions de démo
|
|
590
offres d’emploi
|
0
signaux
|
0
les abonnés
|


Taras Slobodyanik

· 1
chidex
2018.04.20
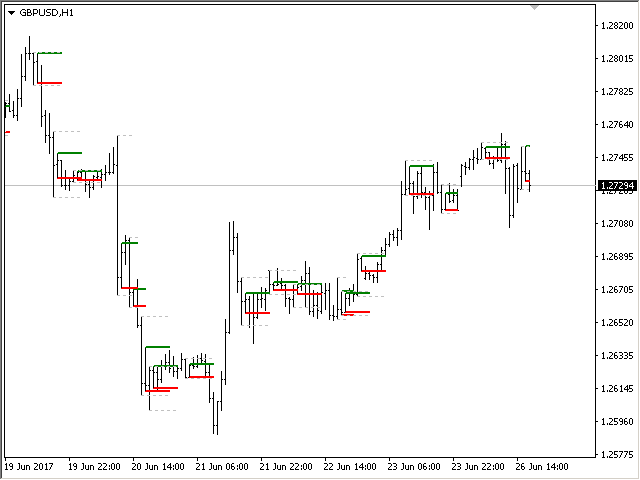
This is a very helpful indicator that has revolutionized my trade experience. Thanks for sharing it free. It will be nice if alert is added to know when the inside bars form and when they are broken up/down. Please I need the link to download the free MT% version, any help?
chidex
2018.04.20
This is a very helpful indicator that has revolutionized my trade experience. Thanks for sharing it free. It will be nice if alert is added to know when the inside bars form and when they are broken up/down. Please I need the link to download the free MT5 version, any help?