Sergei Turov / Vendeur
Produits publiés

MaxVolumeTrendLines
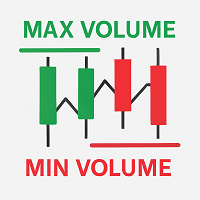
This indicator visualizes the bars with the highest tick volume for each trading day, highlighting price levels where buyers or sellers showed notable activity. Description MaxVolumeTrendLines automatically detects the bar with the highest tick volume within each day (for a selected number of days) and displays horizontal lines on the chart: Green line at the Low — for bullish bars (close above open). Red line at the High — for bearish bars (close below open). Line thicknes
FREE

Higher Timeframe Levels — Indicator for MetaTrader 5 This indicator displays the open and close levels of completed bars from a higher timeframe directly on the current chart , helping traders account for higher timeframe structures during lower timeframe trading. Description Automatically determines the selected higher timeframe. For each completed bar, it plots: A horizontal line at the open level. A horizontal line at the close level. Green line — for bullish bars (Close > O
FREE

Индикатор тиковых объемов представляет собой инструмент технического анализа, используемый для оценки активности трейдеров на рынке. Этот индикатор отображает количество тиков (изменений цен) за определенный временной период и показывает преобладание тиков, направленных на покупку или продажу.
Основные характеристики и функции индикатора тиковых объемов: Гистограмма объемов:
Белый цвет: Означает преобладание тиков, направленных на покупку. Когда количество покупок превышает количество продаж,
FREE

Advantages of the Tick Volume Indicator: Identifying Market Sentiment : A predominance of green bars on the histogram may indicate an uptrend or strong buying pressure, useful for determining entry points for long positions. A predominance of red bars indicates a downtrend or strong selling pressure, useful for determining entry points for short positions. Analyzing Market Activity : The indicator helps identify periods of high activity, when significant changes are occurring in the market, and
FREE

# TickVolumeLines — visualize tick volumes as horizontal trend lines
## Overview **TickVolumeLines** displays tick volumes as horizontal trend lines on the chart. - **Green line** appears at the **Low** of a bullish candle. - **Red line** appears at the **High** of a bearish candle. The thickness of each line corresponds to the tick volume on that bar.
This helps identify high-volume bars visually and locate potential market interest zones.
## Features - Tick volume visualization
FREE

# TickVolumeLines — визуализация тиковых объёмов через линии на графике ## Описание Индикатор **TickVolumeLines** отображает тиковые объёмы в виде горизонтальных линий на графике. - **Зелёная линия** — на уровне **Low** бычьей свечи. - **Красная линия** — на уровне **High** медвежьей свечи. Толщина линии зависит от величины тикового объёма на баре. Индикатор помогает быстро визуально определить всплески объёма и потенциальные уровни интереса участников рынка. ## Особенности - В
FREE