Dariusz Grywaczewski / Vendeur
Produits publiés
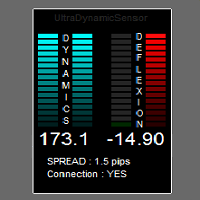
The purpose of the indicator is to measure the dynamics of price movement, capturing sudden acceleration,
and examination of the direction in which the price is moving.
Indicator due to its nature, is dedicated to TimeFrame M1, but it can be freely used on higher TF'ach.
Calculation and display will be identical to the M1.
Indicator all calculations done on ticks, ie single price movements.
Are not taken into account the conditions candle (the color of the candle, the candle shape, values : ope
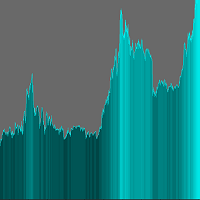
The indicator adds an overlay to the graph to create a histogram.
There are no parameters to set.
On the chart you can choose the color in the upper right corner by clicking on the appropriate brick.
The histogram is shaded depending on the price value.
Remember to set a line chart (shown in the screenshot). ........................... I invite you to purchase.
FREE

VisualTicks_EA is an Expert Advisor dedicated to the VisualTicks chart.
Works ONLY on the VisualTicks chart.
Is a tool that lets you open and close transactions directly on the VisualTicks chart.
There is only one parameter in EA settings:
magic - next EA number. If you use more than one VisualTicks_EA on MT4, you must enter a different magic number.
After starting VisualTicks_EA, the following buttons will appear on the chart:
Open BUY - opens one BUY transaction of a specified lot size.
Cl
FREE
This Expert Advisor is a very advanced sequential tool that gives each user the possibility to program
the order of tasks according to specific conditions.
Everything can be done in a simple and intuitive way.
The sequencing of the EA's programming ensures that each operation is carried out one after another.
I present the method of operation in the attached movie.
EA global settings magic – individual EA number . For each EA attached on the same instrument, a different number must be entered
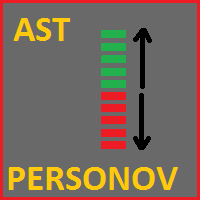
AST_personov is an indicator, which presented of the arithmetic average of the ticks. Next to the current price, a line appears with the value of the AST deviation from the current price (in points). If the value is positive, it is green and if it is negative, it is red. What is the arithmetic average of the ticks ? This is the average of the last ticks that the price move. It has nothing to do with bars ( prices Open, Close, High and Low ). Calculations are carried out using ticks. The values c

A real rarity for scalpers.
Are you looking for TFs lower than M1 ?
Do you want to see the price dynamics inside the candle?
This is a tool for you.
Visual Ticks is an indicator that shows the tick chart in a separate window.
He does it in real time waiting for changing ticks.
Thanks to Visual Ticks, we can look inside the traditional candle and see the dynamics of the moving price.
By setting "period_of_model" we can shape a chart made of candles.
"period_of_model" defines how many consecuti

Open by Clik is a tool that allows you to open positions with two mouse clicks.
The place of the click and the direction of clicking decide what position will be opened.
Opening of positions is quick and intuitive.
If the second click is above the first click, opened are positions Long.
If the second click is belowe the first click, opened are positions Short.
By clicking in the chart area, opened are Market Order (BUY and SELL).
By clicking in the area in front of the chart, opened are Pendin
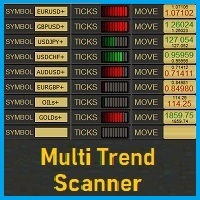
MultiTrend_Scanner is an indicator for the MT4 platform that is used to review trends on multiple symbols. We turn it on on any symbol, on any TF and we have a preview of the entire market. The current symbol is permanently assigned in the first segment of scanner. When adding another segment, you can manually enter any symbol. The quantity of added segments is unlimited. In each segment of a given symbol displayed are trends on different TFs. To calculate the strength of these trends are used