Francesco Rubeo / Profil
- Informations
|
7+ années
expérience
|
15
produits
|
120
versions de démo
|
|
47
offres d’emploi
|
0
signaux
|
0
les abonnés
|
We develop strategies for "third party clients" with the purpose of being at traders service to develop their own indicators, expert advisors or tools for their own way to trade.
Our feedbacks:
https://www.mql5.com/en/users/minervainc/feedbacks
To commit us a personal job just do a personal job and search for minervainc.
Our goal is to research and research to develop indicators and automatic systems to have a strategical advantage on the markets and so augment trading success rate.
Our best indicators:
M.M.Deepness Arrows: This indicator will give you advices on buys and sells after having analized the deepness of the market. Link-> https://mql5.com/59h5o
A.R.Dashoard: The Average Range Dashboard will show you the average range of all desired markets (till 50) with one click!! Link-> https://mql5.com/59h5u
Swing Reader: Read Elliott wave principle automatically. Link-> https://mql5.com/59h6k
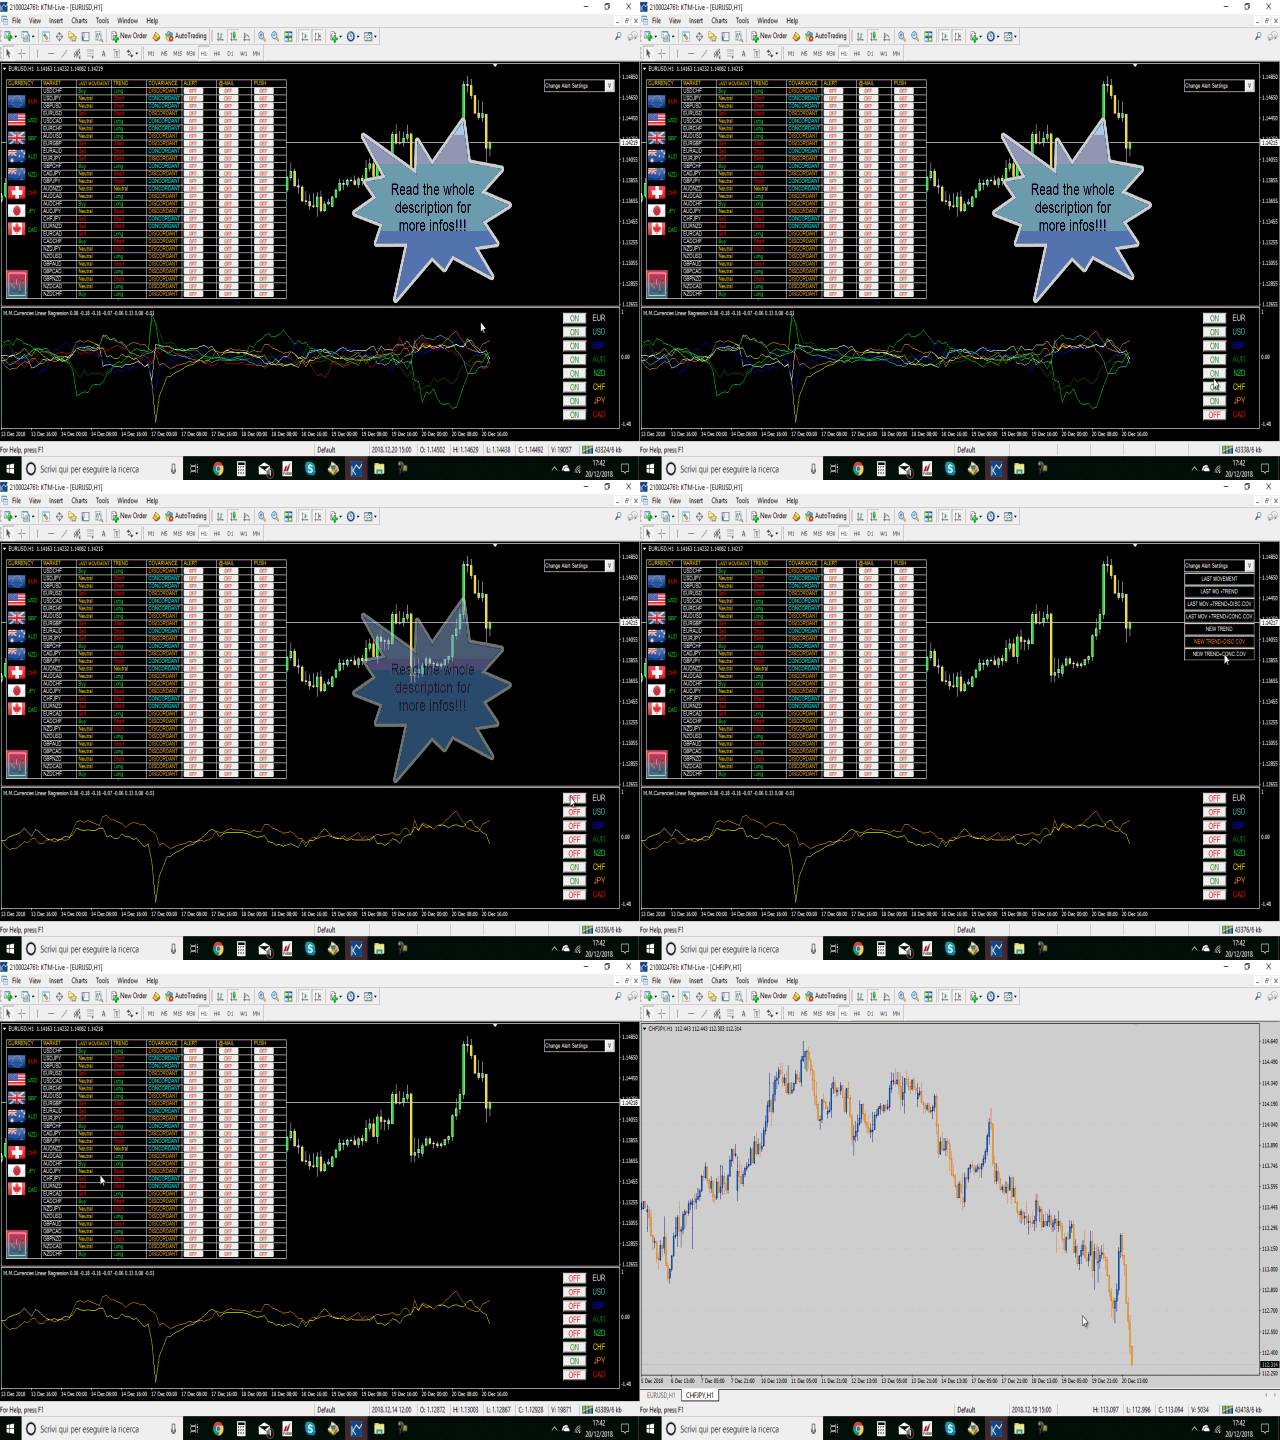
MM Currencies Linear Regression: Evaluate single currency linear regression with one click!! Link-> https://mql5.com/5t6np
Gann Section:
Square of 9 for all: The famous W.D.Gann's Square of 9. Link-> https://mql5.com/59h5x
Gann s heighth: This indicator will let you have at disposal Gann's Eight, with few clicks!! Link-> https://mql5.com/6r157
Gann Swing Chart Range: With this indicator you'll have a general reading of the market's range using Gann's calculating modes. Link-> https://mql5.com/6r15g
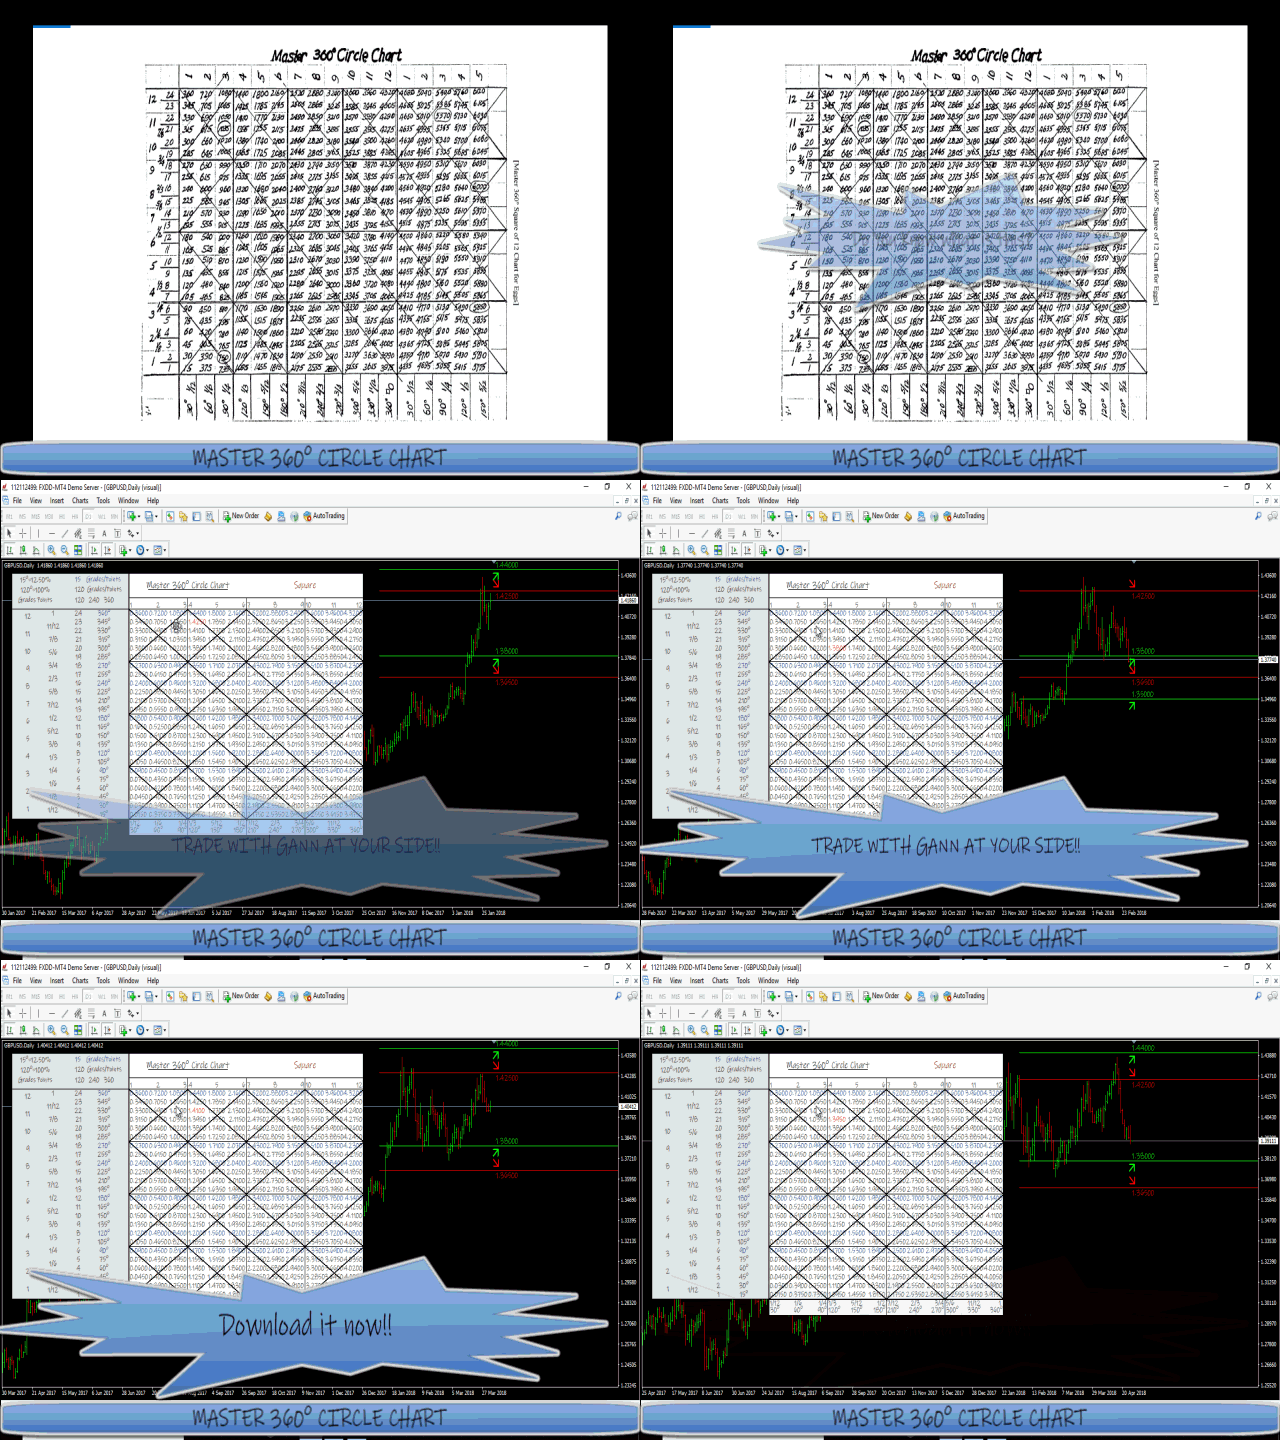
Master 360° Circle Chart with Arrows: Trade with Gann on your side!! Link: https://mql5.com/76ood
Our best Tools:
Custom Dashboard Wizard: Create your Dashboard with few clicks! Link-> https://mql5.com/6ms4h
Orders Assistant Robot: You'll have at your disposal 5 operative panels, each one of these have buttons that let you interact easily at market. Link-> https://mql5.com/59h6i
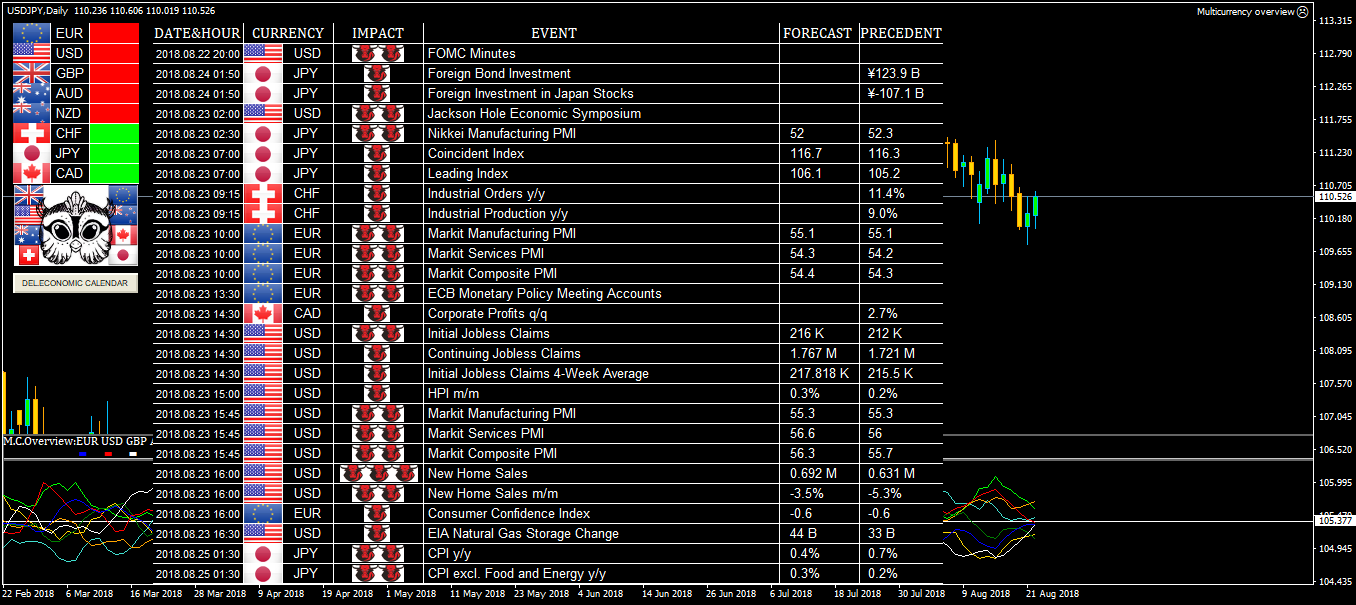
Multicurrency overview: Stay updated with Multicurrency Overview!! Link-> https://mql5.com/59h6u
Louisiana: This software will give you the possibility to preset your management strategy (both in live markets and in strategy tester). Link-> https://mql5.com/59h6v
Currencies Cleaner: Currencies Cleaner panel will give you an overview of all the most traded market's currencies in a single click. Link-> https://mql5.com/59h6x
Our CodeBase:
Market Watch AUTO-CSV: Written in this code you can find a loop on your MarketWatch. It can be used to do a multi-market algorithm Link-> https://www.mql5.com/en/code/22326
Swing Reader
Read Elliott wave principle automatically!!!
https://mql5.com/4eqt7
MT5 Version-> https://mql5.com/7sb9f
Video -> https://www.youtube.com/watch?v=xZbnahupw6w;
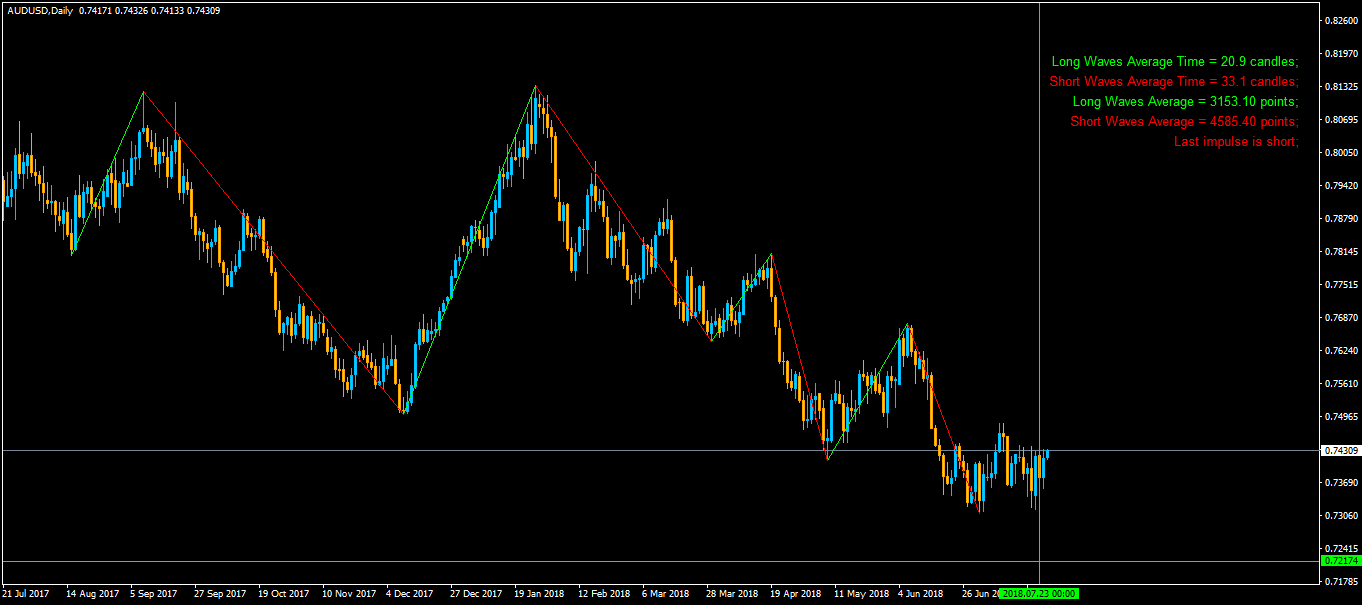
With the Swing Reader, you can easily read the Elliott Wave Principle through an automatic system. With swing, we mean a ZigZag market that is created by a breakout of its standard deviation. You can set the deviation manually, or you can let the indicator do it automatically (setting the deviation to zero).
Advantages you get
Never repaints.
Points showing a horizontal line, in which statistically a long wave ends.
Candles showing a vertical line in which statistically a long wave ends.
A horizontal line created using average points composing statistically short waves.
A horizontal line created using average points composing statistically long waves.
Possibility to optimize the indicator for each timeframe.
Above on the right, you will find very important information concerning the market movement:
Long Waves Average Time: number of candles composing statistically a LONG wave.
Short Waves Average Time: number of candles composing statistically a SHORT wave.
Long Waves Average: points composing statistically a LONG wave.
Short Waves Average: points composing statistically a SHORT wave.
Last impulse: If there is a long impulse, it means that the last long wave is bigger (in points) than the last short wave; if the impulse is short, it is the opposite.
Inputs
Deviation: Set your standard deviation to calculate the swing (if set to zero, the indicator will choose for you the standard deviation).
Average Method: Choose your favourite method to calculate the averages that you will find above on the right. You will have two options at your disposal:
Simple: Arithmetical average.
Linear Weighted: An average weighted by the latest waves (newest waves are more important!!).
Bulls Color: Choose your favourite color for long waves.
Bears Color: Choose your favourite color for short waves.
Swing Width: Choose your favourite waves width.

Link -> https://mql5.com/4eqt7
MT5 Version-> https://mql5.com/7sb9f
Video -> https://youtu.be/xZbnahupw6w
Read Elliott wave principle automatically. With the Swing Reader, you can easily read the Elliott Wave Principle through an automatic system. With swing, we mean a ZigZag market that is created by a breakout of its standard deviation. You can set the deviation manually, or you can let the indicator do it automatically (setting the deviation to zero). Advantages you get Never repaints. Points showing a horizontal line, in which statistically a long wave ends. Candles showing a vertical line in
Enabling alerts or mails you will be updated on each candle about single currency trend.
Link -> https://mql5.com/4lvmb
Stay updated with Multicurrency Overview!! The algorithm of this EA releases an average of the movement percentage of all the Forex currencies linked to a single currency, isolating it, letting us to comprehend its real and specific trend. Above on the left, a panel show us efficiently the trend of the currency, in the timeframe actually used. The second panel will keep you updated on macroeconomic news. P.N.:The news time is based on your pc clock time, this way you won't have any problem
This indicator will allow you to evaluate single currency linear regression. WHAT IS LINEAR REGRESSION?(PIC.3) Linear regression is an attempt to model a straight-line equation between two variables considering a set of data values. The aim of the model is to find the best fit that can serve the two unknown values without putting the other at a disadvantage. In this case, the two variables are price and time, the two most basic factors in the Forex market. Linear regression works in such a way
Link-> https://mql5.com/6r15g
With this indicator you'll have a general reading of the market's range using Gann's calculating modes. Gann's swing is used to have a quick reading to the market latest movements at first glance. The foundation of this swing calculation is in the count of candles in relation to the break-up and break-down of the price. When the price breaks-up the last maximum, the swing will get traced if a certain number of candles is exceeded from the last minimum. It can be used a "pure Gann" or not: If
Link ->https://mql5.com/582x0
Video -> https://www.youtube.com/watch?v=HXHE8O-FXX4;
Easily access to a deep knowledge of the market movement with "M.M. Deepness Arrows"!! This indicator will give you advices on buys and sells after having analized the deepness of the market. The entrance "trigger" will be given after studying each candles' max and min avoiding, this way, the misleading data released by the opening and closure prices (given by the brokers). Thanks to the use of these arrows you'll be able to easily understand if i'ts the right time to buy or sell. If you want
FREE VERSION -> https://mql5.com/5hfk3
COMPLETE VERSION-> https://www.mql5.com/en/market/product/26366
Video -> https://www.youtube.com/watch?v=WVgkHwQRBjI;
Currencies Cleaner panel will give you an overview of all the most traded market's currencies in a single click.
First of all the panel will refresh all your charts, opening them four times in all timeframes needed.
1 - CURRENCIES
It uses a complex algorithm to study the movement of 17 different indicators. It means that the algorithm not only "reads" the actual value of an indicator, but also creates a probability of success using the position of this value on the indicator and the last movement of the same indicator. After doing this (for each one of the indicators), the algorithm will study the smaller timeframes of the markets, measuring how many times a market has broken the volatility of the indicator on top and on the bottom. The final part consists in isolating the markets of a particular currency and gathering all the probabilities studied before, giving us a numerical results.
Currencies with positive numbers means that one currency, statistically, will have a bull market. On the other hand, currencies with negative numbers means that this currency, statistically, will have a bear market. The higher is the absolute value, the higher is the probability of success.
2 - A.M. and B&B DISTRIBUTIONS
Now we have the second information, the answer to the question: How I read those previous numbers?
You'll get the answer reading this:
B&B Distributions tells you how much bears and bulls are distributed in markets.
A.M. gives us the maximum and minimum value reachable by a single currency, showing also the 80% and the 70% of those values.
The nearer a currency is to the maximum or the minimum of the A.M., the more the currency, statistically, will follow the analysis during the following day. So if the value is (of the absolute value) less than the 70% of the minimum or less the 70% of the maximum, we have a lower probability to obtain our target.
3 - AVERAGE
The panel shows which moving average, statistically, is cut or touched by the market, starting a trend. So we have an higher probability to enter in a market which is starting a trend. Obviously, the lowest is the average value, the lowest are the pips of the target.
4 - DAILY SIGNAL
This panel shows candlesticks patterns in Daily time.
Patterns for Long:
ENGULFING, HAMMER, BIG HAMMER, LONG LINE, INVERTED HAMMER.
Patterns for Short:
ENGULFING, SHOOTING STAR, BIG SHOOTING STAR, LONG LINE, HANGING MAN.
P.N.: These figures are seen in the panel only if market has touched or broken the average.
5 - BACKGROUND
It simply shows the last candlesticks patterns info on the market in weekly time chart.
6 - LAST IMPULSE
An impulse is a ZigZag movement created by the market, called "swing". A market which has the last swing long, has the previous short and vice versa. The highest swing in pips is the Last Impulse.
If you click on a Symbol name, the current chart will switch to that symbol.

Read Elliott wave principle automatically!!!
https://mql5.com/4eqt7
MT5 Version-> https://mql5.com/7sb9f
Video -> https://www.youtube.com/watch?v=xZbnahupw6w;
Your order Management Robot!!
It works on strategy tester too!!!
https://mql5.com/48vyv
Video -> https://www.youtube.com/watch?v=zjqfTt79W8c;
Create your Dashboard with few clicks! With the Custom Dashboard Wizard you'll be able to create your dashboard also without any programming knowledge. This indicator/panel will give you the possibility to add/remove the values of the Metatrader4 standard indicators in any time frame you like, with any value you like and in any market you like, just be careful about writing the market name exactly as it's written on the list of your Market Watch. The main panel will be composed of three
Link -> https://mql5.com/514q7
Video -> https://www.youtube.com/watch?v=kpdmxiDDWVs;
Welcome all to the famous Gann's "Square Of 9"!! This method was used by one of the best traders in the history, a person who made his way among the top traders. An "Holy Grail" for whoever wants to learn trading. The "Square of 9" was used by this genius to find the market's future supports and future resistances. Nowadays is possible to find them with just a click, thanks to softwares. At the time Gann was using just his set of square and goniometer!! Gann describes, partially, the tecnique on
https://www.mql5.com/en/market/product/29043
Video -> https://www.youtube.com/watch?v=YSTDs9ngPgI;
Link -> https://mql5.com/514q7
Video -> https://www.youtube.com/watch?v=kpdmxiDDWVs;
Video -> https://www.youtube.com/watch?v=YSTDs9ngPgI;
It works on strategy tester too!!!
This software will give you the possibility to do different things.
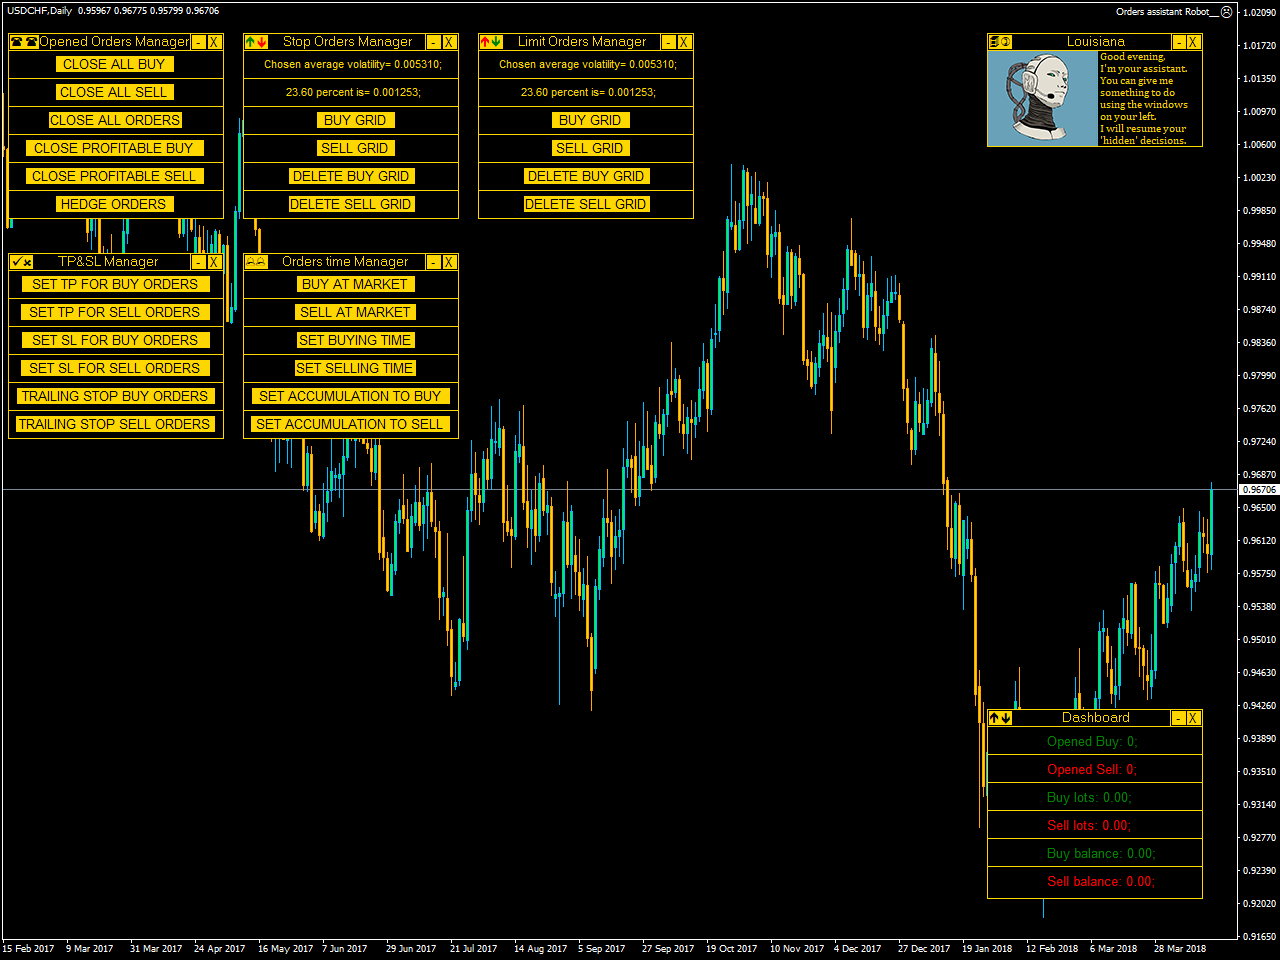
You'll have at your disposal 5 operative panels, each one of these have buttons that let you interact easily at market:
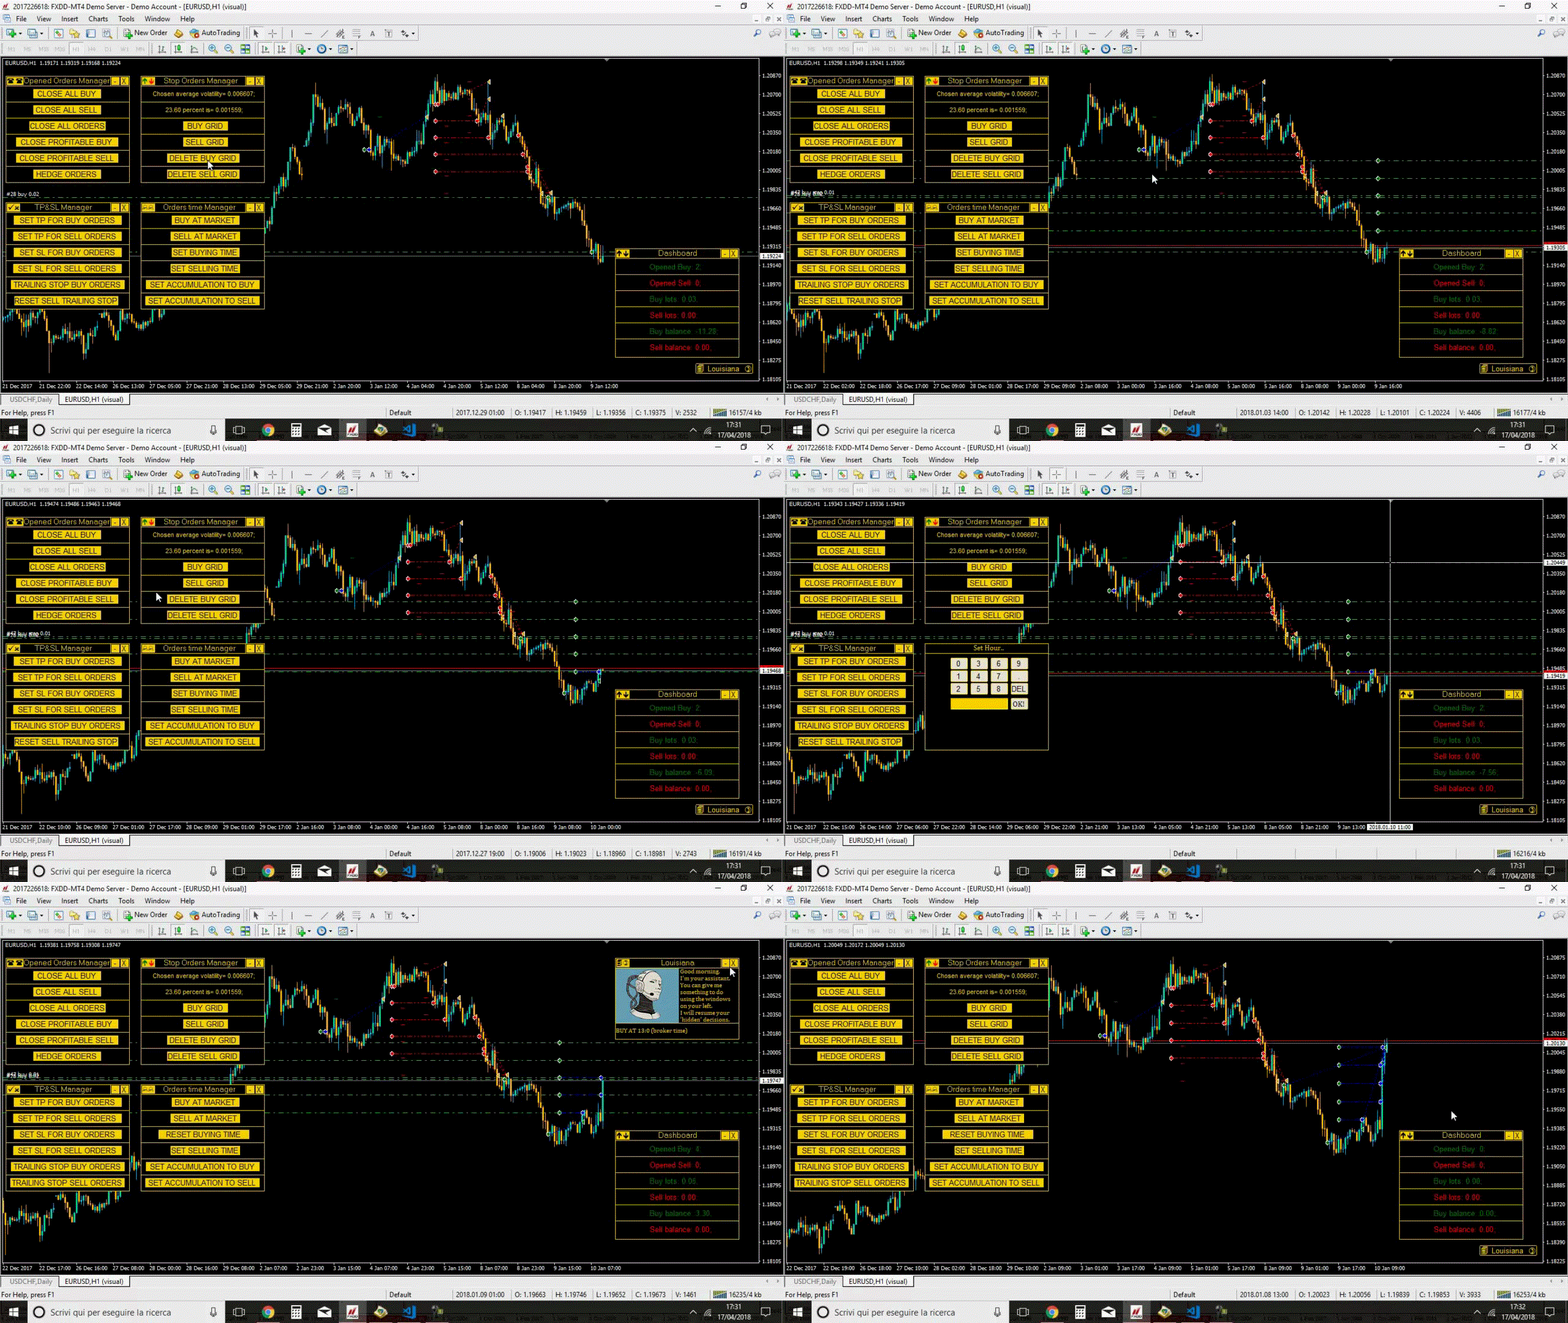
1. Opened Orders Manager (screenshot 1):
6 buttons:
Close all buy orders.
Close all sell orders.
Close all orders.
Close all profitable buy orders.
Close all profitable sell orders.
Hedge orders.
2. Stop Orders Manager (screenshot 1):
2 informative sections:
Numerical value of the average volatility chosen in the inputs section.
Numerical value of the average volatility chosen, based on the percentage chosen in the inputs section.
4 buttons:
Set a buy stop grid.
Set a sell stop grid.
Delete the buy stop grid.
Delete the sell stop grid.
3. Limit Orders Manager (screenshot 4):
2 informative sections:
Numerical value of the average volatility chosen in the inputs section.
Numerical value of the average volatility chosen, based on the percentage chosen in the inputs section.
4 buttons:
Set a buy limit grid.
Set a sell limit grid.
Delete the buy limit grid.
Delete the sell limit grid.
4. TP&SL Manager (screenshot 1):
6 buttons:
Set take profit for buy orders in points.
Set take profit for sell orders in points.
Set stop loss for buy orders in points.
Set stop loss for sell orders in points.
Set trailing stop for buy orders in points.
Set trailing stop for sell orders in points.
5. Orders time Manager (screenshot 1):
6 buttons:
Buy now at market.
Sell now at market.
Schedule a buy at a certain time (Hour and minute).
Schedule a sell at a certain time (Hour and minute).
Buy now at market and choose a time interval at which buy again. Once activated, button will change to allow you to stop accumulation.
Sell now at market and choose a time interval at which sell again. Once activated, button will change to allow you to stop accumulation.
Other than this, you'll have at your disposal two other panels on your right.
Starting from above you can find your personal assistant (screenshot 2), she will resume your scheduled decisions.
Scheduled decisions means your hypothetical 6 different choices:
You've scheduled a buy operation.
You've scheduled a sell operation.
Your set a buy accumulation.
Your set a sell accumulation.
Your set trailing stop for buy orders.
Your set trailing stop for sell orders.
Below, you have your Dashboard (screenshot 2) where you can find these infos:
Number of opened buy orders.
Number of opened sell orders.
Buy exposition (lots).
Sell exposition (lots).
Buy orders balance.
Sell orders balance.
Each panel can be iconified on chart bottom or closed.
Parameters
LOTS FOR TIME ORDERS: Set lots for Orders time Manager panel.
SLIPPAGE: Set slippage.
MAGIC BUY: Set magic number for buy orders.
MAGIC SELL: Set magic number for sell orders.
BUY COLOR: Set your favourite color for buy orders.
SELL COLOR: Set your favourite color for sell orders.
LOTS FOR PENDING ORDERS: Set lots for grid orders.
AVERAGE VOLATILITY BARS: Set average period.
AVERAGE VOLATILITY TIME: Set average volatility timeframe.
% FOR STOP & LIMIT ORDERS: Choose average volatility percentage to set the distance between grid orders (both limit and stop orders).
PENDING ORDERS NUMBER: Number of pending orders that the EA will put on the market when you set a grid.
BACKGROUND COLOR: Set background color.
FRONT COLOR: Set front color.
Setup
This panel is an EA. So you have to install it in your MQL4/Experts folder.
Link-> https://mql5.com/5t6hg
Video-> https://www.youtube.com/watch?v=0LXuoQC8TlA;
