Young Ho Seo / Profil
- Informations
|
10+ années
expérience
|
62
produits
|
1182
versions de démo
|
|
4
offres d’emploi
|
0
signaux
|
0
les abonnés
|
Harmonic Pattern Indicator - Repainting + Japanese Candlestick Pattern Scanner + Automatic Channel + Many more
https://www.mql5.com/en/market/product/4488
https://www.mql5.com/en/market/product/4475
https://algotrading-investment.com/portfolio-item/harmonic-pattern-plus/
Non Repainting and Non Lagging Harmonic Pattern Indicator – Customizable Harmonic + Japanese Candlestic Pattern Scanner + Advanced Channel + Many more
https://www.mql5.com/en/market/product/41993
https://www.mql5.com/en/market/product/41992
https://algotrading-investment.com/portfolio-item/profitable-pattern-scanner/
Supply Demand Indicator – Multiple Timeframe Scanning Added + Non Repainting + Professional Indicator
https://www.mql5.com/en/market/product/40076
https://www.mql5.com/en/market/product/40075
https://algotrading-investment.com/portfolio-item/ace-supply-demand-zone/
Momentum Indicator – Path to Volume Spread Analysis
https://www.mql5.com/en/market/product/30641
https://www.mql5.com/en/market/product/30621
https://algotrading-investment.com/portfolio-item/excessive-momentum-indicator/
Elliott Wave Indicator for the Power User
https://www.mql5.com/en/market/product/16479
https://www.mql5.com/en/market/product/16472
https://algotrading-investment.com/portfolio-item/elliott-wave-trend/
Forex Prediction - Turn Support and Resistance to the Advanced Strategy
https://www.mql5.com/en/market/product/49170
https://www.mql5.com/en/market/product/49169
https://algotrading-investment.com/portfolio-item/fractal-pattern-scanner/
MetaTrader 4 and MetaTrader 5 Product Page: https://www.mql5.com/en/users/financeengineer/seller#products
Free Forex Prediction with Fibonacci Analysis: https://algotrading-investment.com/2020/10/23/forex-prediction-with-fibonacci-analysis/
Free Harmonic Pattern Signal: https://algotrading-investment.com/2020/12/17/harmonic-pattern-signal-for-forex-market/
============================================================================================================================
Here are the trading education books. We recommend reading these books if you are a trader or investor in Forex and Stock market. In the list below, we put the easy to read book on top. Try to read the easy to read book first and try to read the harder book later to improve your trading and investment.
First Link = amazon.com, Second Link = Google Play Books, Third Link = algotrading-investment.com, Fourth Link = Google Books
Technical Analysis in Forex and Stock Market (Supply Demand Analysis and Support Resistance)
https://www.amazon.com/dp/B09L55ZK4Z
https://play.google.com/store/books/details?id=pHlMEAAAQBAJ
https://algotrading-investment.com/portfolio-item/technical-analysis-in-forex-and-stock-market/
https://books.google.co.kr/books/about?id=pHlMEAAAQBAJ
Science Of Support, Resistance, Fibonacci Analysis, Harmonic Pattern, Elliott Wave and X3 Chart Pattern (In Forex and Stock Market Trading)
https://www.amazon.com/dp/B0993WZGZD
https://play.google.com/store/books/details?id=MME3EAAAQBAJ
https://algotrading-investment.com/portfolio-item/science-of-support-resistance-fibonacci-analysis-harmonic-pattern/
https://books.google.co.kr/books/about?id=MME3EAAAQBAJ
Profitable Chart Patterns in Forex and Stock Market (Fibonacci Analysis, Harmonic Pattern, Elliott Wave, and X3 Chart Pattern)
https://www.amazon.com/dp/B0B2KZH87K
https://play.google.com/store/books/details?id=7KrQDwAAQBAJ
https://algotrading-investment.com/portfolio-item/profitable-chart-patterns-in-forex-and-stock-market/
https://books.google.com/books/about?id=7KrQDwAAQBAJ
Guide to Precision Harmonic Pattern Trading (Mastering Turning Point Strategy for Financial Trading)
https://www.amazon.com/dp/B01MRI5LY6
https://play.google.com/store/books/details?id=8SbMDwAAQBAJ
http://algotrading-investment.com/portfolio-item/guide-precision-harmonic-pattern-trading/
https://books.google.com/books/about?id=8SbMDwAAQBAJ
Scientific Guide to Price Action and Pattern Trading (Wisdom of Trend, Cycle, and Fractal Wave)
https://www.amazon.com/dp/B073T3ZMBR
https://play.google.com/store/books/details?id=5prUDwAAQBAJ
https://algotrading-investment.com/portfolio-item/scientific-guide-to-price-action-and-pattern-trading/
https://books.google.com/books/about?id=5prUDwAAQBAJ
Predicting Forex and Stock Market with Fractal Pattern: Science of Price and Time
https://www.amazon.com/dp/B086YKM8BW
https://play.google.com/store/books/details?id=VJjiDwAAQBAJ
https://algotrading-investment.com/portfolio-item/predicting-forex-and-stock-market-with-fractal-pattern/
https://books.google.com/books/about?id=VJjiDwAAQBAJ
Trading Education Book 1 in Korean (Apple, Google Play Book, Google Book, Scribd, Kobo)
https://books.apple.com/us/book/id1565534211
https://play.google.com/store/books/details?id=HTgqEAAAQBAJ
https://books.google.co.kr/books/about?id=HTgqEAAAQBAJ
https://www.scribd.com/book/505583892
https://www.kobo.com/ww/en/ebook/8J-Eg58EDzKwlpUmADdp2g
Trading Education Book 2 in Korean (Apple, Google Play Book, Google Book, Scribd, Kobo)
https://books.apple.com/us/book/id1597112108
https://play.google.com/store/books/details?id=shRQEAAAQBAJ
https://books.google.co.kr/books/about?id=shRQEAAAQBAJ
https://www.scribd.com/book/542068528
https://www.kobo.com/ww/en/ebook/X8SmJdYCtDasOfQ1LQpCtg
About Young Ho Seo
Young Ho Seo is an Engineer, Financial Trader, and Quantitative Developer, working on Trading Science and Investment Engineering since 2011. He is the creator of many technical indicators, price patterns and trading strategies used in the financial market. He is also teaching the trading practice on how to use the Supply Demand Analysis, Support, Resistance, Trend line, Fibonacci Analysis, Harmonic Pattern, Elliott Wave Theory, Chart Patterns, and Probability for Forex and Stock Market. His works include developing scientific trading principle and mathematical algorithm in the work of Benjamin Graham, Everette S. Gardner, Benoit Mandelbrot, Ralph Nelson Elliott, Harold M. Gartley, Richard Shabacker, William Delbert Gann, Richard Wyckoff and Richard Dennis. You can find his dedicated works on www.algotrading-investment.com . His life mission is to connect financial traders and scientific community for better understanding of this world and crowd behaviour in the financial market. He wrote many books and articles, which are helpful for understanding the technology and application behind technical analysis, statistics, time series forecasting, fractal science, econometrics, and artificial intelligence in the financial market.
If you are interested in our software and training, just visit our main website: www.algotrading-investment.com
Young Ho Seo
Adding Peak Trough Analysis Tool in your Chart – MetaTrader
1. Overview on the Tutorial
Peak Trough Analysis is the powerful Wave Indicator available in MetaTrader. It helps you to detect various price patterns in more organized and efficient way. We have demonstrated how to detect Rising wedge, falling wedge and triangles, Elliott Wave patterns with Peak Trough Analysis in our Book: Scientific Guide To Price Action and Pattern Trading. In addition, we have demonstrated how to detect Fibonacci Price Pattern, Elliott Wave pattern, Harmonic Pattern and X3 pattern with Peak Trough Analysis in our Book: Profitable Patterns in Forex and Stock Market.
Since the Peak Trough Analysis is a must have tool for the financial trader, we briefly demonstrate how to load them in your chart. For your information, Peak Trough Analysis is freely downloadable from our website: www.algotrading-investment.com
2. Steps to use Peak Trough Analysis indicator
We assume that you have downloaded Peak Trough Analysis tool already in your MetaTrader platform. Once you have downloaded the indicator, you should be able to see it in the navigator.
To use any indicator, you need to have at least one chart opened. In this tutorial, we will open GBPUSD hourly chart.
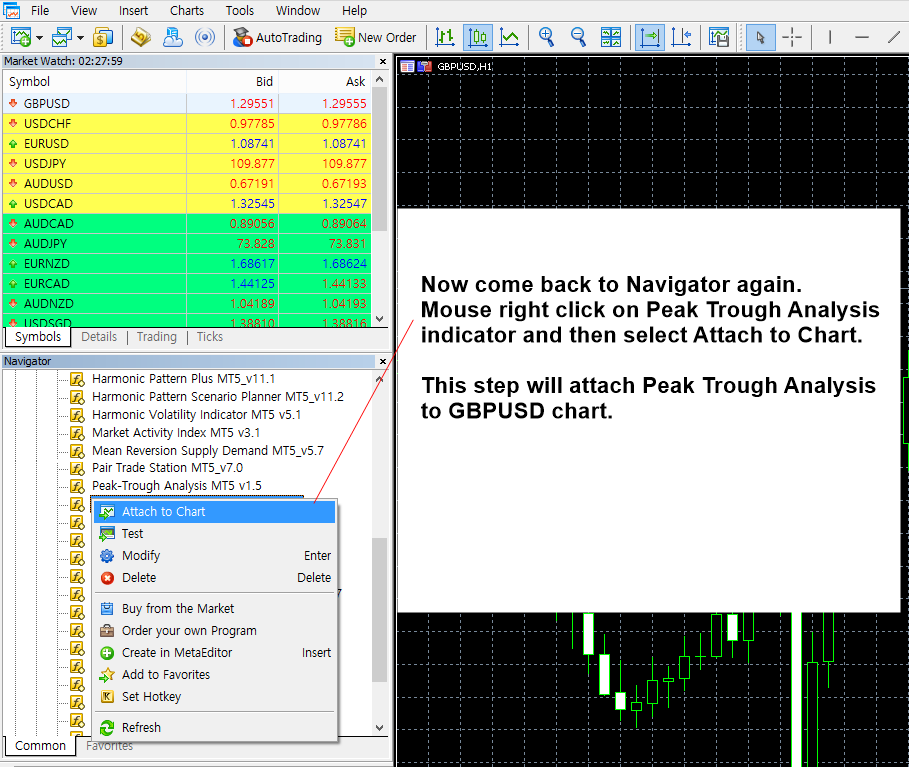
Now go back to the Navigator. Select Peak Trough Analysis indicator with mouse right click. Then click on Attach to chart. This step will attach this indicator to GBPUSD hourly chart, which was opened in our previous step.
Clicking on Attach to Chart will pop up Property Window for the indicator. In this property window, you can select various setup according to your preference. Especially, Peak Trough Analysis can be run under three different mode.
1. ZigZag indicator mode
2. Modified Fractal Indicator mode
3. Original Fractal Indicator mode
To run it as ZigZag indicator mode, set the first input to false. If you want to run it as modified fractal indicator mode, then set the first input to true. If you want to run it as original fractal indicator mode, then set the first input to true and set N left = 2 and N right = 2. We have explained all these modes in detailed in the book: Scientific Guide to Price Action and Pattern Trading. If you need the details of each mode, then please refer to the book.
Click OK button, then we are done. Now you should be able to see Peaks and Troughs detected in chart window. As we have explained in the book, these peaks and troughs are the important basis for various price detection and the trading strategies associated with those price patterns.
About this Article
This article is the part taken from the draft version of the Book: Profitable Chart Patterns in Forex and Stock Market (Fibonacci Analysis, Harmonic Pattern, Elliott Wave, and X3 Chart Pattern). This article is only draft and it will be not updated to the completed version on the release of the book. However, this article will serve you to gather the important knowledge in financial trading. This article is also recommended to read before using Harmonic Pattern Plus, Harmonic Pattern Scenario Planner and Profitable Pattern Scanner, which is available for MetaTrader or Optimum Chart.
Below is the landing page for Harmonic Pattern Plus, Harmonic Pattern Scenario Planner and X3 Chart Pattern Scanner in MetaTrader. All these products are also available from www.mql5.com too.
https://algotrading-investment.com/portfolio-item/harmonic-pattern-plus/
https://algotrading-investment.com/portfolio-item/harmonic-pattern-scenario-planner/
https://algotrading-investment.com/portfolio-item/profitable-pattern-scanner/
Below is the landing page for Optimum Chart (Standalone Charting and Analytical Platform).
https://algotrading-investment.com/2019/07/23/optimum-chart/

Young Ho Seo
Guideline on Harmonic Patterns
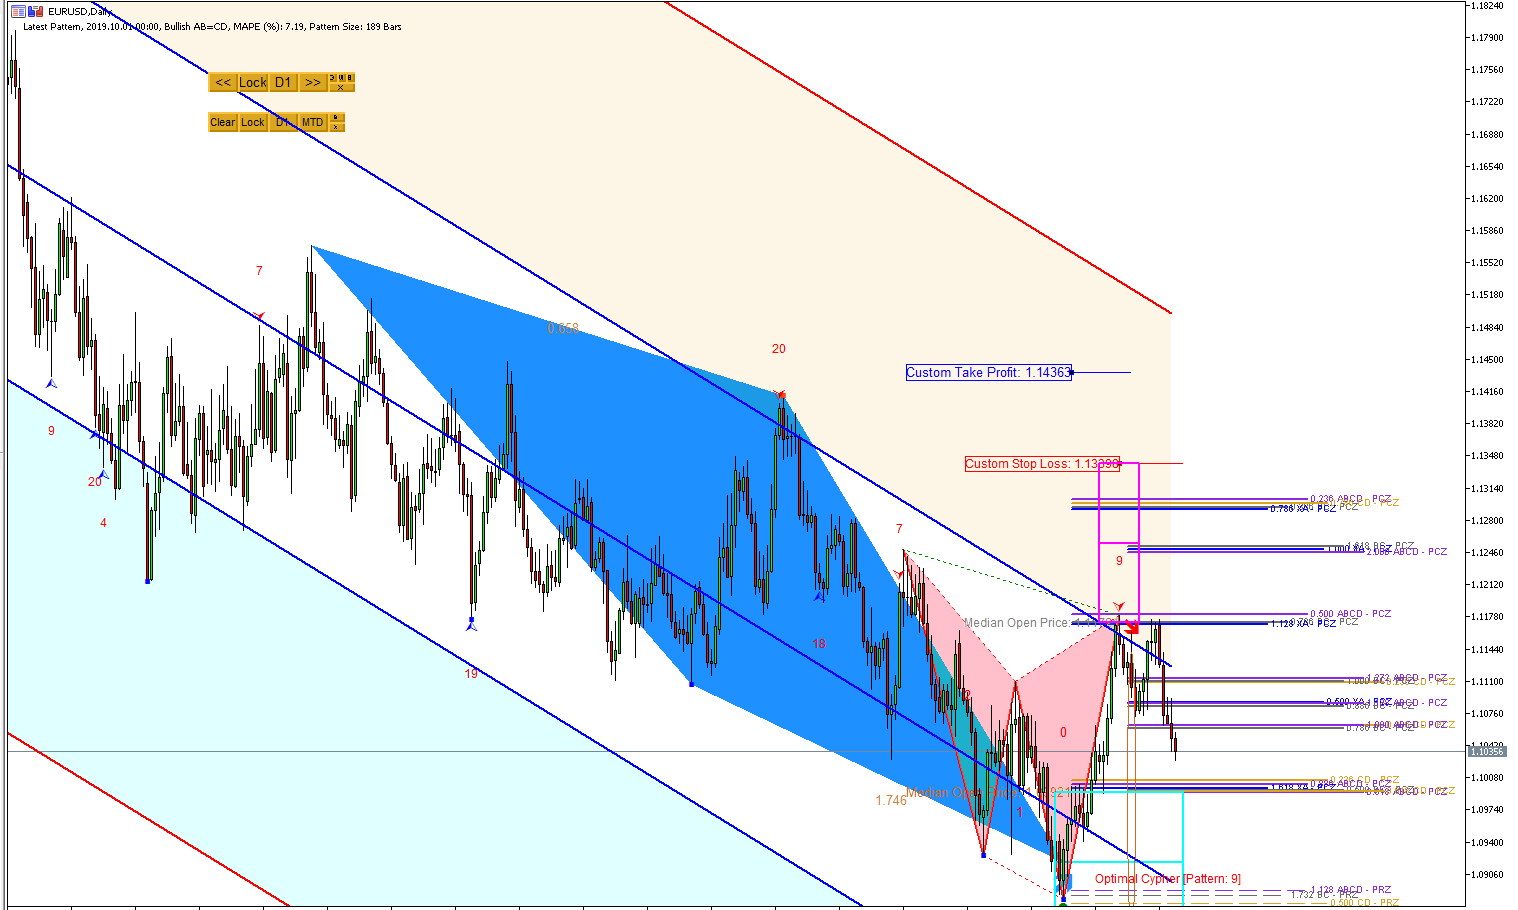
Here are some guideline on Harmonic Pattern Trading. These several articles can help you to improve your performance.
Quick Guideline for Harmonic Pattern Plus for Starter
https://algotrading-investment.com/2018/10/21/quick-guideline-for-harmonic-pattern-plus-for-starter/
Pattern Completion Interval versus Potential Reversal Zone
https://algotrading-investment.com/2018/10/22/pattern-completion-interval-versus-potential-reversal-zone/
Tactical Use of Pattern Completion Interval (PCI)
https://algotrading-investment.com/2018/10/26/pattern-completion-interval/
Link to Harmonic Pattern Plus
Harmonic pattern plus is cheap but it is extremely good product for its price.
Below are the Links to Harmonic Pattern Plus
https://www.mql5.com/en/market/product/4488
https://www.mql5.com/en/market/product/4475
https://algotrading-investment.com/portfolio-item/harmonic-pattern-plus/
Link to Harmonic Pattern Scenario Planner
With additional features of predicting future harmonic patterns, this is very tactical harmonic pattern indicator with advanced simulation capability on top of features of harmonic pattern plus.
Below are the Links to Harmonic Pattern Scenario Planner
https://www.mql5.com/en/market/product/6101
https://www.mql5.com/en/market/product/6240
https://algotrading-investment.com/portfolio-item/harmonic-pattern-scenario-planner/

Young Ho Seo
Advanced Supply Demand Zone Indicator
Here is the list of Advanced Supply Demand Zone Indicator. These supply and demand zone indicators are rich in features with many powerful features to help you to trade the right supply and demand zone to trading.
Mean Reversion Supply Demand
Mean Reversion Supply Demand indicator is our earliest supply demand zone indicator and loved by many trader all over the world. It is great to trade with reversal and breakout. You can also fully setup your trading with stop loss and take profit target.
Below are the links to the Mean Reversion Supply Demand indicator for MetaTrader 4/MetaTrader 5.
https://www.mql5.com/en/market/product/16823
https://www.mql5.com/en/market/product/16851
https://algotrading-investment.com/portfolio-item/mean-reversion-supply-demand/
Ace Supply Demand Zone
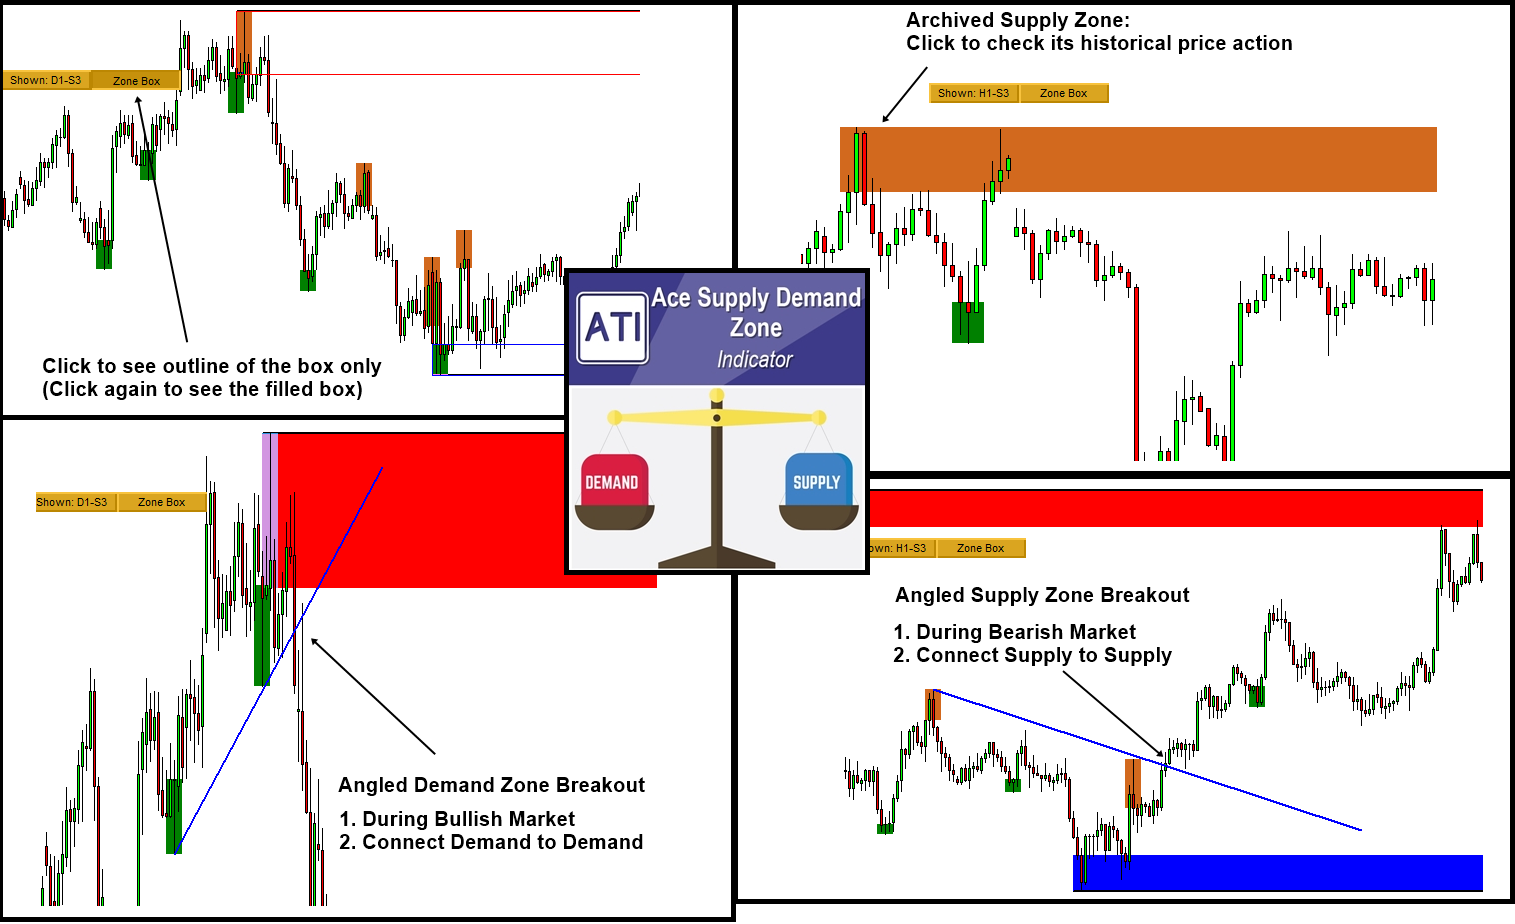
Ace Supply Demand Zone indicator is our next generation supply demand zone indicator. It was built in non repainting and non lagging algorithm. On top of many powerful features, you can also make use of archived supply and demand zone in your trading to find more accurate trading opportunity.
Below are the links to the Ace Supply Demand Zone indicator for MetaTrader 4/MetaTrader 5.
https://www.mql5.com/en/market/product/40076
https://www.mql5.com/en/market/product/40075
https://algotrading-investment.com/portfolio-item/ace-supply-demand-zone/
For your information, both mean reversion supply demand and Ace supply demand zone indicator uses completely different algorithm in detecting supply and demand zone.

Young Ho Seo
Using Japanese Candlestick Patterns in X3 Chart Pattern Scanner
X3 Chart Pattern Scanner is the powerful pattern trading system with many powerful features. Properly used, this tool can yield excellent trading results. One of the trading system built inside X3 Chart Pattern Scanner is the Japanese candlestick patterns. X3 Chart Pattern Scanner can detect around 52 different Japanese candlestick patterns. They are categorized under five categories including one, two, three, four and five candlestick patterns.
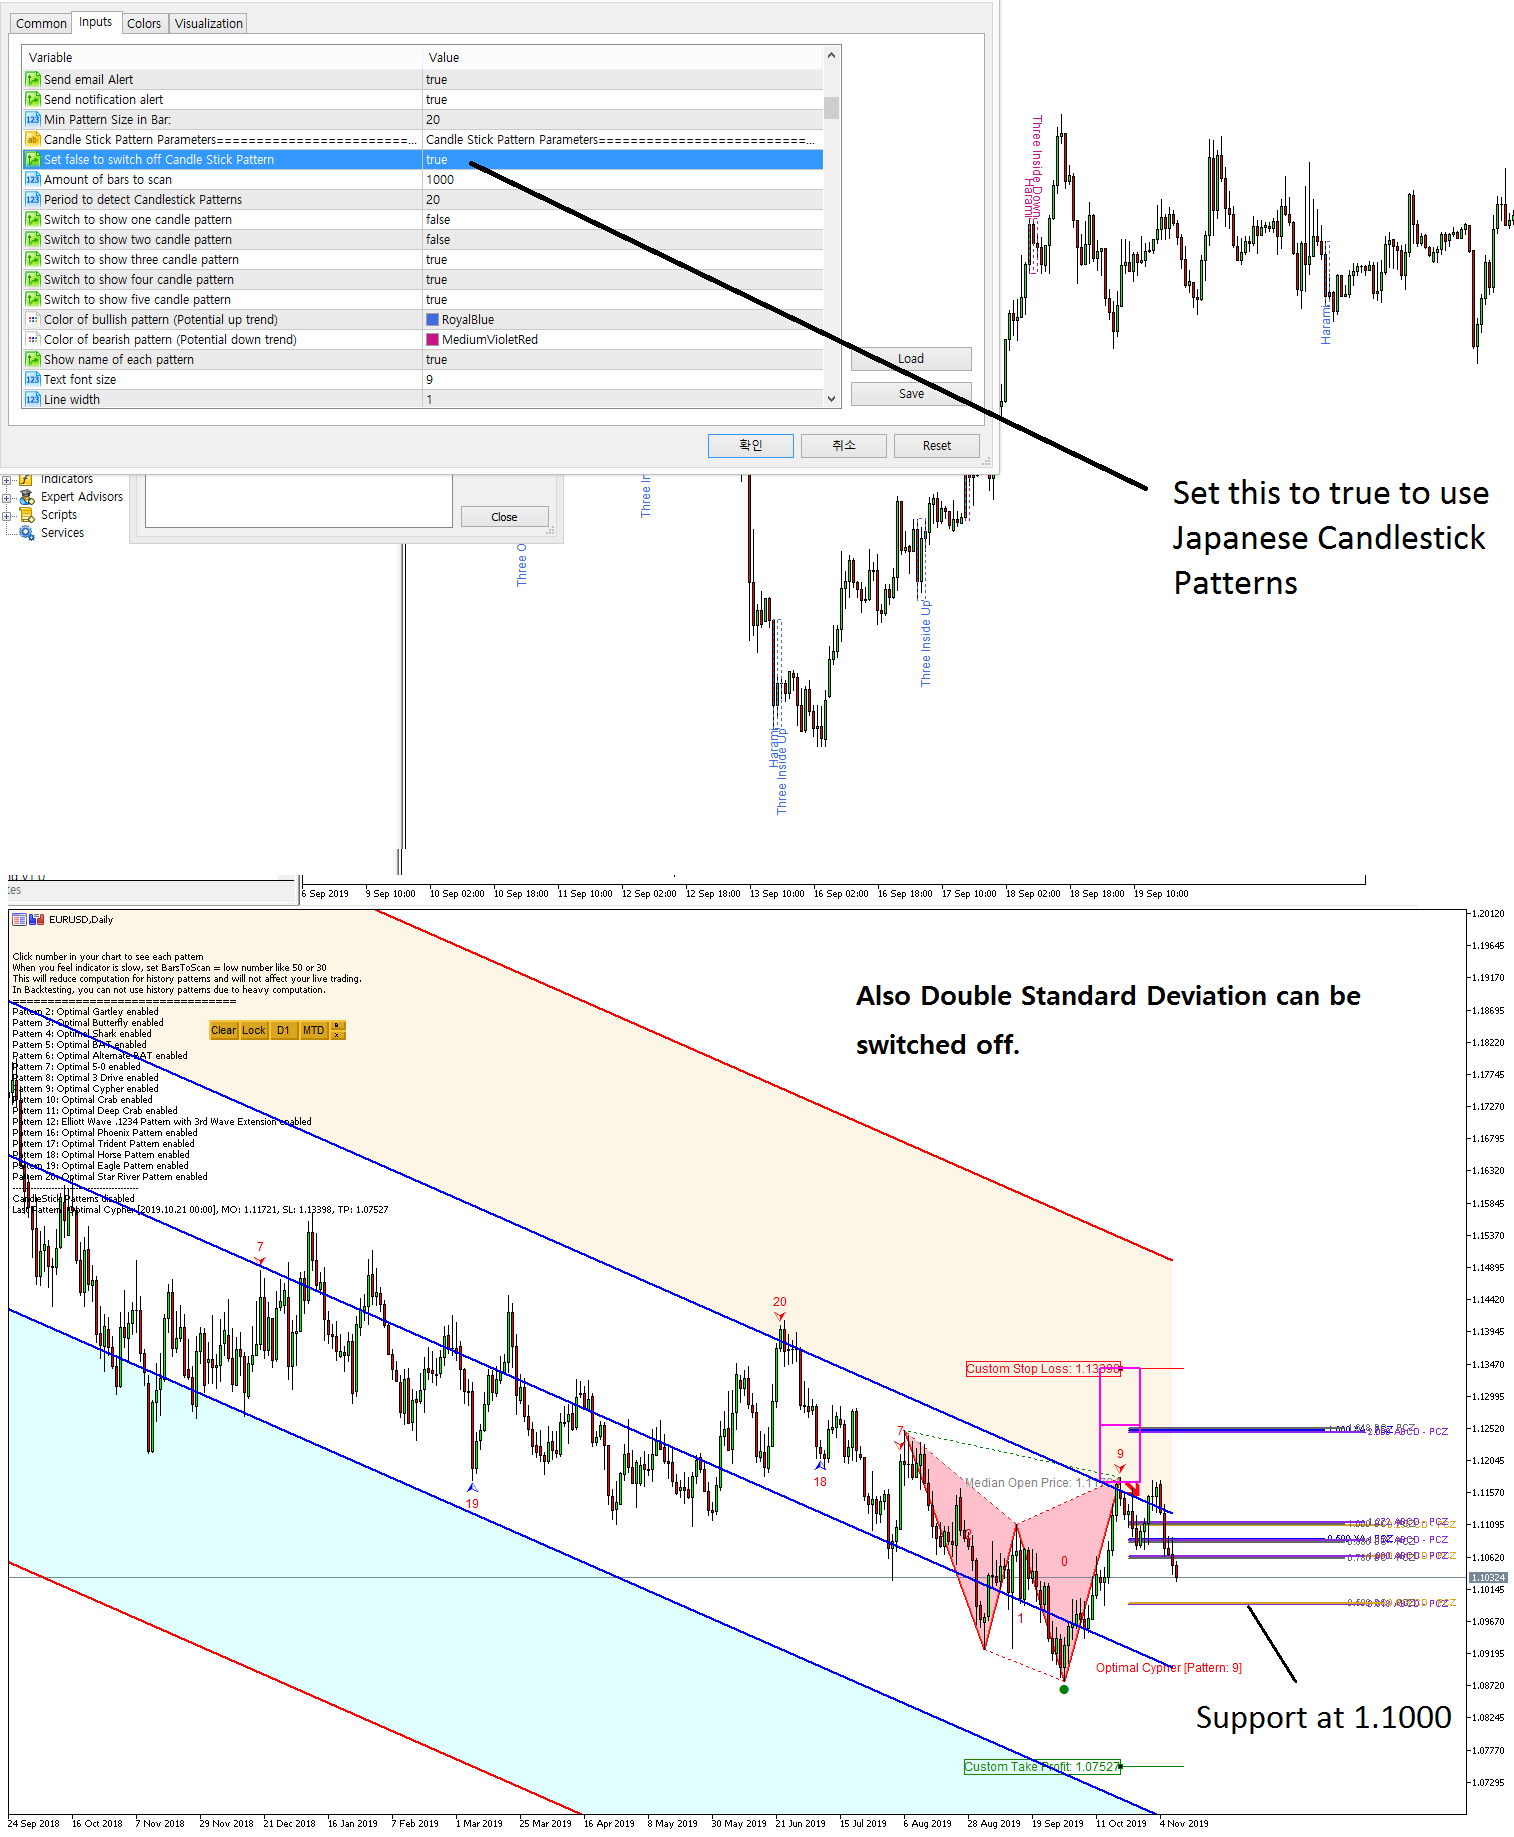
To use Japanese candlestick patterns, you have to enable the candlestick pattern from X3 Chart Pattern Scanner. See the attached screenshot for the purpose. Then you can switch on and off the individual category of patterns according to your preferences. For example, you can only use two and three candlestick patterns if you wish.
In addition, you can also receive sound alert, email and push notification when new Japanese candlestick patterns are detected. Note that Japanese candlestick patterns are only one of the pattern category. It can also detect other powerful patterns like Harmonic Patterns, Elliott Wave Patterns and X3 patterns.
You can watch the YouTube Video to feel what is the automated harmonic pattern indicator like.
YouTube “Non Repainting Non Lagging Harmonic Pattern Indicator”: https://youtu.be/uMlmMquefGQ
Below we provide the link to X3 Chart Pattern Scanner available in MetaTrader 4 and MetaTrader 5.
https://algotrading-investment.com/portfolio-item/profitable-pattern-scanner/
https://www.mql5.com/en/market/product/41992
https://www.mql5.com/en/market/product/41993

Young Ho Seo
Elliott Wave Indicator for MetaTrader 4
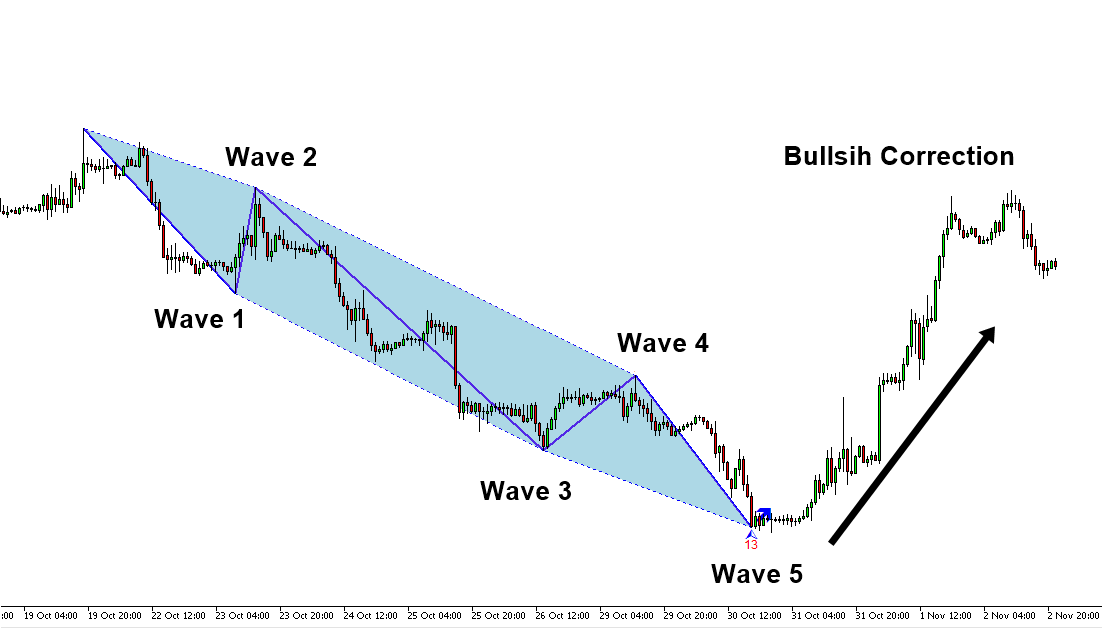
For Elliott Wave Trader, it is necessary to have a good Elliott Wave tools for your trading. It is because Elliott Wave theory is not easy to be completed manually. However, once you understand its trading principle, Elliott Wave can advance your trading performance pretty fast. They do provide the great approach to solve the geometric puzzle in the forex and stock market. We provide two Elliott Wave tools in MetaTrader 4 platform.
MetaTrader 4 is one of the most popular trading platform since 2010. It is accessible for free of charge for any trader from all over the world. We provide two powerful Elliott Wave Indicators for this platform. Hence, you have two choice in selecting Elliott Wave Indicators for your trading. These tools are already used by thousands professional trader in day to day operation.
1. Elliott Wave Trend for MetaTrader 4
Elliott Wave Trend is extremely powerful Elliott wave indicator. This indicator allows you to perform Elliott wave counting as well as Elliott wave pattern detection. All these are the essential steps in predicting market with Elliott Wave theory. On top of them, it provides built in support and resistance system and turning point strength indicator to improve your trading performance. Yet, there are many additional features for you to explorer inside this technical indicator.
https://www.mql5.com/en/market/product/16479
https://algotrading-investment.com/portfolio-item/elliott-wave-trend/
At the same time, you can watch YouTube video titled as “Elliott Wave Trend Intro to find out more about Elliott Wave Trend Indicator.
YouTube Link: https://youtu.be/Oftml-JKyKM
2. X3 Chart Pattern Scanner for MetaTrader 4
X3 Chart Pattern Scanner is specialized tools in detecting the chart patterns including Harmonic Pattern and Elliott Wave Patterns, and more more patterns. Pattern detection process is fully automatic + you can even create customized Elliott wave and Harmonic patterns if you wish. Yet, this is only short summary though, you can find out more information and its features from product page. It is very unique and powerful tool in the world of trading.
https://www.mql5.com/en/market/product/41993
https://algotrading-investment.com/portfolio-item/profitable-pattern-scanner/
YouTube “Non Repainting Non Lagging Harmonic Pattern Indicator”: https://youtu.be/uMlmMquefGQ
In summary, both tools are the high performance trading system. However, if you want to use Elliott wave trading exclusively, then you should go for Elliott Wave trend. If you do not mind both Elliott Wave and Harmonic Pattern Trading, then you should use X3 Chart Pattern Scanner.

Young Ho Seo
Generating Income with Chart Patterns
Profitable Chart Patterns include Fibonacci Price Patterns, Harmonic Patterns, Elliott Wave, X3 Chart Patterns as well as many other tradable patterns.
Chart Patterns are the good buy and sell signal generator for trading. It provides you the early signal at the turning point. Unlike other technical indicator, you are not lagging with these patterns. Hence you can always move ahead of other trader.
In addition, it is useful because it is extremely easy to combine with other analysis technique in your trading decision. In this short book, we provide the details of these chart patterns in Forex market with some practical tutorials.
In this book below, we explain how to make the best use of Chart Patterns for your trading. What is even better, we have included the bonus chapter of support and resistance.
Website links: https://algotrading-investment.com/portfolio-item/profitable-chart-patterns-in-forex-and-stock-market/
Below is the Harmonic pattern, Elliott Wave patterns and X3 pattern detection tools developed for MetaTrader, the most popular Forex Trading platform.
1. Harmonic Pattern Plus
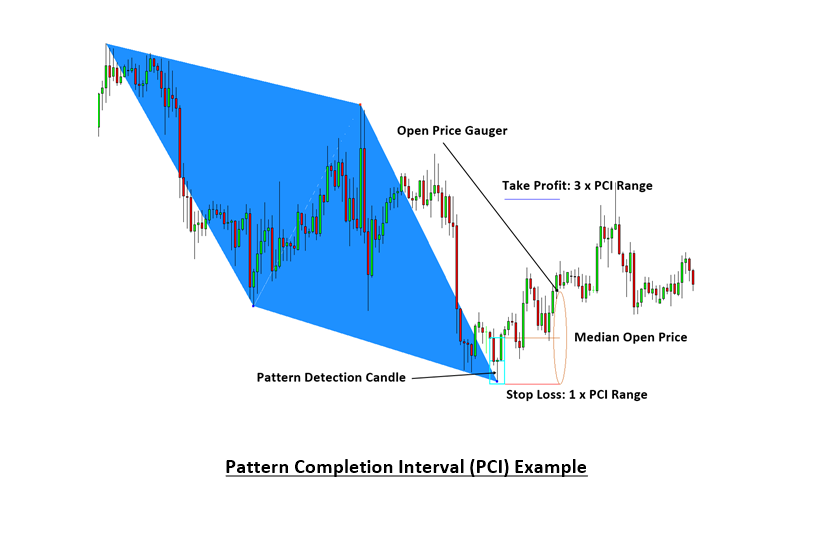
One of the first automated Harmonic Pattern detection tool released in 2014. It can detect 11 most popular harmonic patterns with well-defined trading entries and stops. Pattern Completion Interval, Potential Reversal Zone and Potential Continuation Zone are supported. In addition, other dozens of powerful features are added like Japanese candlestick detection, etc. Because of affordable price, this harmonic pattern detection indicator is loved by many traders.
https://www.mql5.com/en/market/product/4488
https://www.mql5.com/en/market/product/4475
https://algotrading-investment.com/portfolio-item/harmonic-pattern-plus/
2. Harmonic Pattern Scenario planner
It is an advanced Harmonic Pattern indicator. On top of the features of Harmonic Pattern Plus, you can also predict future harmonic patterns through simulation. This is the tactical harmonic pattern tool designed for Professional harmonic pattern trader. Because of affordable price, this harmonic pattern detection indicator is loved by many traders.
https://www.mql5.com/en/market/product/6240
https://www.mql5.com/en/market/product/6101
https://algotrading-investment.com/portfolio-item/harmonic-pattern-scenario-planner/
3. X3 Chart Pattern Scanner
X3 Chart Pattern is our next generation Chart Pattern Scanner. This is non-repainting and non-lagging Harmonic Pattern Indicator. On top of that, this tool can detect Elliott Wave Pattern and X3 Chart Patterns. It can detect over 20 Chart Patterns. The bonus is that you can also detect around 52 Japanese candlestick patterns.
https://www.mql5.com/en/market/product/41993
https://www.mql5.com/en/market/product/41992
https://algotrading-investment.com/portfolio-item/profitable-pattern-scanner/

Young Ho Seo
Using Spread Chart from the Pairs Trading Station in MetaTrader
From Pairs Trading Station in MetaTrader version, you can access the Spread Chart, which is mathematically processed to show the distance between two financial instruments (or between two assets).
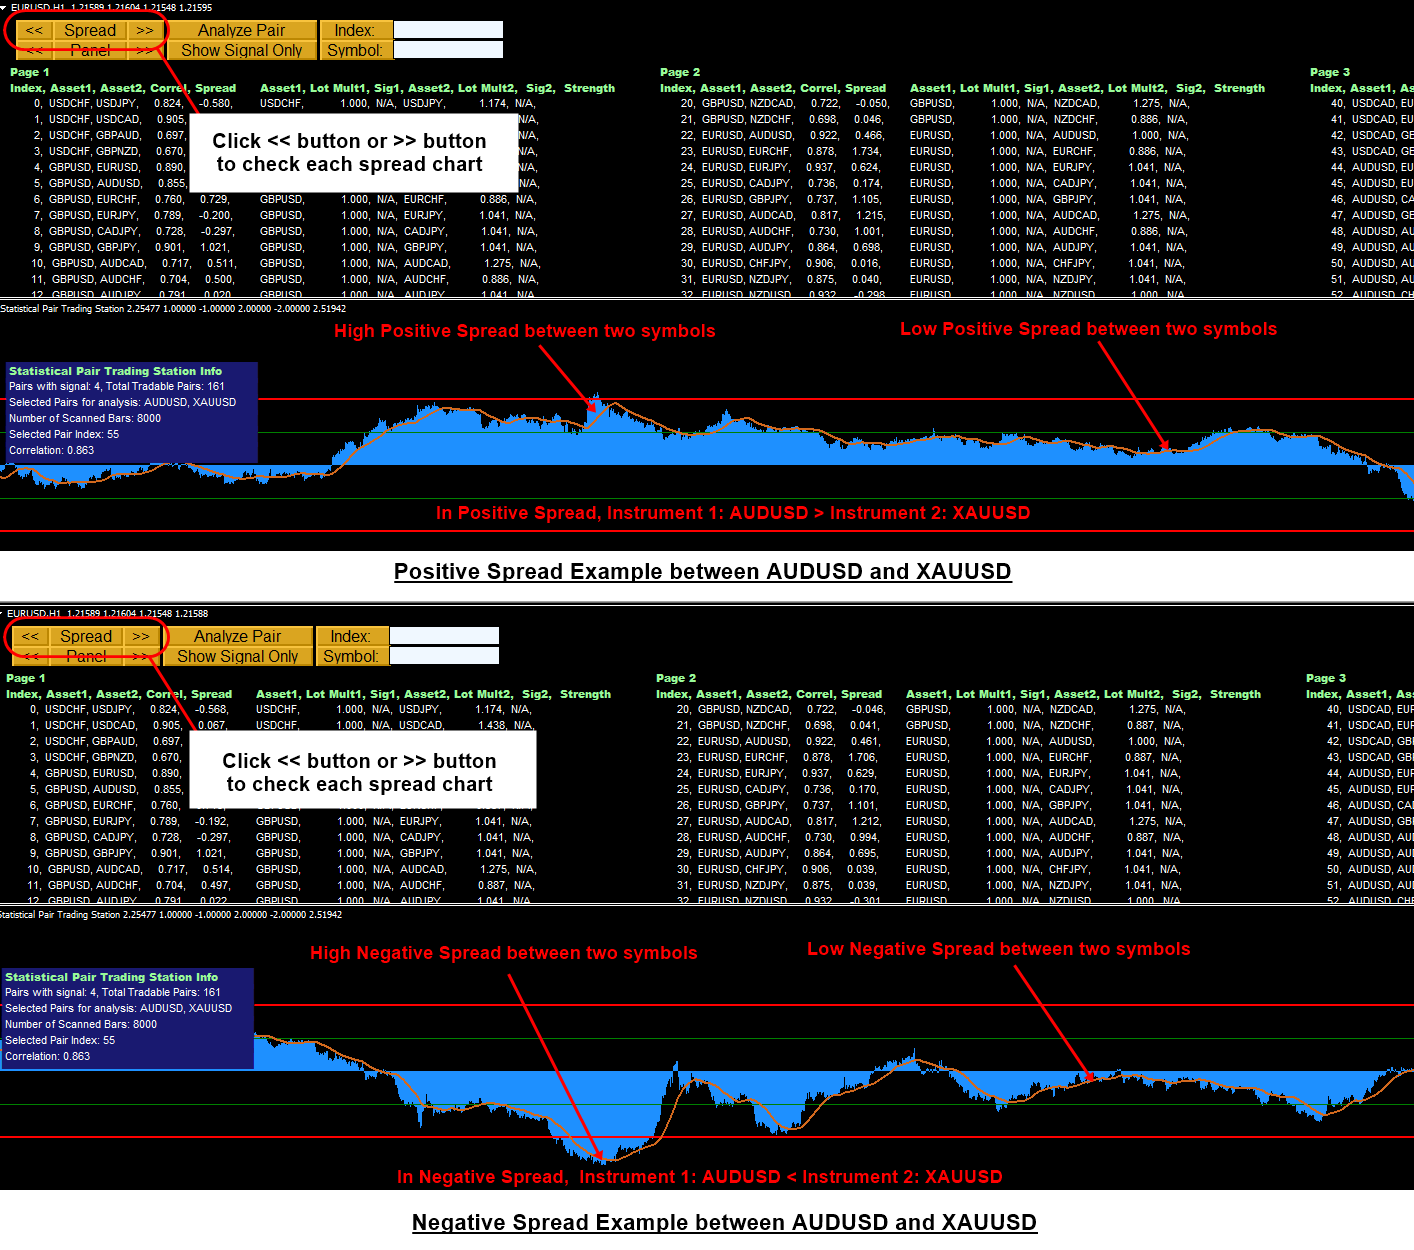
You can access the Spread Chart by clicking << button or >> button near the Spread button.
Here is the brief guide on how to interpret the Spread Chart. In this example, we use AUDUSD and XAUUSD as asset 1 and asset 2. The absolute magnitude of these two assets are compared in the normalized sense to compare apple to apple and pear to pear. Two cases exist including the positive spread and negative spread.
In positive spread, AUDUSD (i.e. asset 1) is greater than XAUUSD (i.e. asset 2). Higher the positive spread means that AUDUSD is much greater than XAUUSD in the normalized sense. If the positive spread is small, then the difference between AUDUSD and XAUUSD is also small.
In negative spread, AUDUSD (i.e. asset 2) is smaller than XAUUSD (i.e. asset 2). Higher the negative spread means that AUDUSD is much smaller than XAUUSD in the normalized sense. If the negative spread is small, then the difference between AUDUSD and XAUUSD is also small.
Further you can access more detailed trading operation with below Pairs Trading Manual.
https://algotrading-investment.com/2015/11/14/introduction-to-pair-trading-station_ati/
In addition, you can watch this YouTube Video titled as How to use Pairs Trading Station
https://youtu.be/fAE9pByxZDA
To help you understand the spread chart, we also attach the screenshot.
Pair Trading Station is very unique trading system based on Statistical Arbritage trading principle. Below is the direct link to Pair Trading Station for MetaTrader 4 and MetaTrader 5 platform:
https://algotrading-investment.com/portfolio-item/pair-trading-station/
https://www.mql5.com/en/market/product/3303
https://www.mql5.com/en/market/product/3304
So far, we have explained the functionality of Pairs Trading Station in MetaTrader version, covering both MetaTrader 4 and MetaTrader 5. In addition, we also provide the Pairs Trading Station in Optimum Chart too with more advanced features.
https://algotrading-investment.com/2019/07/23/optimum-chart/

Young Ho Seo
Simple Introduction to Excessive Momentum Indicator
Excessive Momentum Indicator provides you the ability to trade with excessive momentum. Let us start this simple introduction. Firstly, understand that excessive momentum could possibly point out some anomaly movement or anomaly momentum in the market. To help your understanding, you can consider the insufficient momentum (i.e. exceptionally low volatility market or sideways market) as the opposite concept against excessive momentum. Our Excessive momentum indicator provides the automatic way of measuring the excessive momentum in your chart.
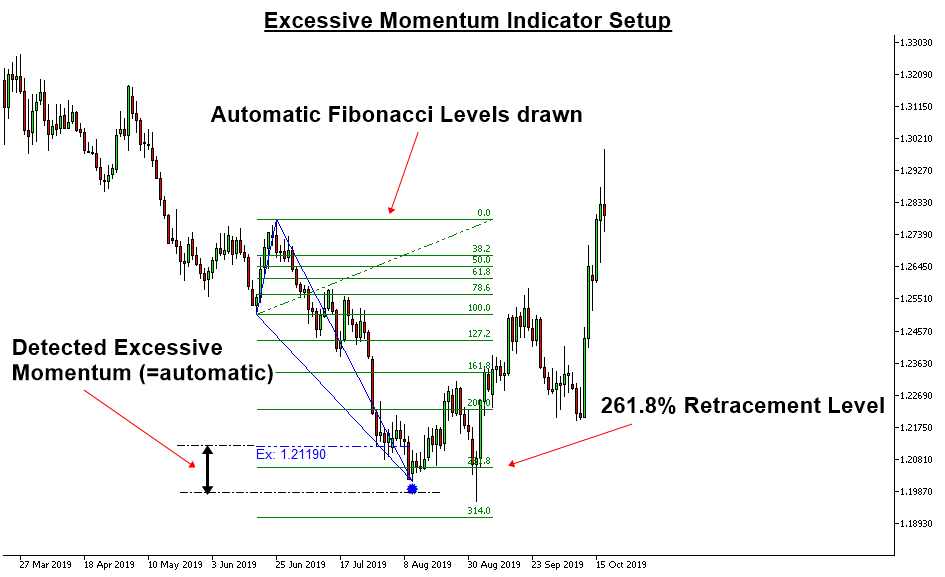
Once Excessive momentum is detected, then it will draw the Fibonacci Levels in the sensible place in your chart automatically. Then you take this as your trading entry. It is simple and easy to trade. Most importantly, it is powerful indicator that alarm you the important trading entry in advance.
https://algotrading-investment.com/portfolio-item/excessive-momentum-indicator/
https://www.mql5.com/en/market/product/30641
https://www.mql5.com/en/market/product/30621

Young Ho Seo

Mean Reversion Supply Demand Basic Guideline
Supply and Demand zone is the extended version of support and resistance trading with more skills. We provide our own Supply and Demand Zone indicator, Mean Reversion Supply Demand.
Here is the really basic guideline in using Mean Reversion Supply Demand.
H4 = Zone detected in H4 timeframe
S3 = Zone Strength 3
You can also show or hide zones from your chart using button click.
Below are the links to the Mean Reversion Supply Demand indicator for MetaTrader 4/MetaTrader 5.
https://www.mql5.com/en/market/product/16823
https://www.mql5.com/en/market/product/16851
https://algotrading-investment.com/portfolio-item/mean-reversion-supply-demand/

Young Ho Seo

Pattern Completion Zone in Technical Analysis
Pattern Completion Zone, also known as Pattern Completion Interval, is the trading zone found in various price patterns like Triangle Pattern, Falling Wedge Pattern, Rising Wedge Pattern, Fibonacci Price Pattern, Harmonic Pattern, X3 Chart Pattern, Elliott Wave pattern and so on. Pattern Completion Zone is very useful technical anlaysis concept first appeared in the Book: Guide to Precision Harmonic Pattern Trading (Young Ho Seo, 2016). Pattern Completion Zone is significant because it provides the edge to the price pattern or price action trading taking them from the loose science to more measurable science.
https://algotrading-investment.com/portfolio-item/guide-precision-harmonic-pattern-trading/
Usually, the Pattern Completion Zone is the box zone around the point within the path of the price pattern. The point means either peak or trough in your chart. For example, in ABC Fibonacci price pattern, the pattern completion zone can be formed in point A, point B and point C. However, the the Pattern Completion Zone at Point C is probably most important for your trading. Likewise, in the Harmonic Pattern, the Pattern Completion Zone can be formed in any point in XABCD point. However, the Pattern Completion Zone at Point D is most important for your trading.
Pattern Completion Zone serves two purpose for your trading. Firstly, it provides you the decision making area in your chart. For example, you can use the pattern completion zone much like trading with support and resistance. The good thing is that Pattern Completion Zone is easier to use because it provides the reactable price area for the trader. In the traditional trading strategy, trader used line to trade, for example, as in support and resistance. Typically, trading with line is harder as the trader needs to monitor how far the price is deviated from the line. This is a tiring job for the trader. Plus this can be subjective if you are using the line to trade although there are few methods to correct this subjective problem. For example, Young Ho Seo proposed two methods Symmetrical Trigger Level and Symmetrical Fibonacci Retracement in the book: Scientific Guide to Price Action and Pattern Trading. Still, many trader thinks that using the trading zone like the Pattern Completion Zone is easier and less subjective.
Secondly, the Pattern Completion Zone helps you to manage your trading risk. For example, you can use the pattern completion zone to define your stop loss and take profit level in your Forex and Stock market trading. The reason this works is that the pattern completion zone is formed at the rejectable price level for that pattern. The stop loss around the Pattern Completion Zone is sensible one although the expert will teach that you could add some margin around. The advantage of this method is that you can calculate your risk reward ratio or reward risk ratio intuitively. Just think your stop loss and take profit level in term of the multiple of the height of pattern completion zone. Pattern Completion Zone will teach you that your odd to win is always tied to your amount of risk and reward. This way you can trade and manage your risk in quantiative way.
Just for your information, here are some Harmonic Pattern Scanner that automatically detect patterns and calculate the Pattern Completion Zone for your trading. These tools will save you a lot of time if you are trader as they are automated pattern scanner.
Harmonic Pattern Plus (and also Harmonic Pattern Scenario Planner) is the powerful but they are the repainting Harmonic Pattern Scanner. At the same time, they are cheaper. If you do not like the repainting harmonic pattern indicator, then you might have to check the X3 Chart Pattern Scanner below.
https://www.mql5.com/en/market/product/4488
https://www.mql5.com/en/market/product/4475
https://algotrading-investment.com/portfolio-item/harmonic-pattern-plus/
X3 Chart Pattern Scanner is non repainting and non lagging Harmonic Pattern and X3 pattern Scanner.
https://www.mql5.com/en/market/product/41993
https://www.mql5.com/en/market/product/41992
https://algotrading-investment.com/portfolio-item/profitable-pattern-scanner/

Young Ho Seo

Volume Spread Analysis Indicator List
We provide three different Volume Spread Analysis indicators and volume based tools. Our volume spread analysis tools are the hybrid of volume spread analysis and signal processing theory.
These tools will help you to complete your trading decision with high precision. As long as you understand the concept of the Accumulation and Distribution area in the volume spread analysis, these tools will help you to predict the presence of Accumulation and Distribution area. Hence, you can predict the best trading opportunity.
Firstly, Volume Spread Pattern Indicator is the powerful volume spread analysis indicator that operated across multiple timeframe. Volume Spread Pattern Indicator will not only provide the bearish and bullish volume spread pattern in the current time frame but also it will detect the same patterns across all timeframe. You just need to open one chart and you will be notified bullish and bearish patterns in all timeframe in real time.
Here is the link to Volume Spread Pattern Indicator.
https://www.mql5.com/en/market/product/32961
https://www.mql5.com/en/market/product/32960
https://algotrading-investment.com/portfolio-item/volume-spread-pattern-indicator/
Secondly, Volume Spread Pattern Detector is the light version of Volume Spread Pattern Indicator above. This is free tool with some limited features. However, Volume Spread Pattern Detector is used by thousands of traders. Especially, it works great with the support and resistance to confirm the turning point. This is free tool. Just grab one.
https://www.mql5.com/en/market/product/28438
https://www.mql5.com/en/market/product/28439
https://algotrading-investment.com/portfolio-item/volume-spread-pattern-detector/
Both Volume Spread Pattern Indicator and Volume Spread Pattern Detector works well with Excessive Momentum indicator as Excessive Momentum indicator helps to detect the potential Accumulation and Distribution area automatically. Hence, if you are using Excessive Momentum Indicator, then you can use one between Volume Spread Pattern Indicator or Volume Spread Pattern Detector. In addition, we provide the YouTube video to accomplish the basic operations of Excessive Momentum Indicator.
YouTube Video (Momentum Indicator): https://youtu.be/oztARcXsAVA
Here is link to Excessive Momentum Indicator for MetaTrader 4 and MetaTrader 5.
https://algotrading-investment.com/portfolio-item/excessive-momentum-indicator/
https://www.mql5.com/en/market/product/30641
https://www.mql5.com/en/market/product/30621
Thirdly, we provide the volume Zone Oscillator. This is another useful free tool that utilizes the volume information for your trading. You can use these tools for volume spread analysis, Harmonic Pattern, Elliott Wave Pattern, X3 Price Pattern further. This is free tool. Just grab one.
https://algotrading-investment.com/portfolio-item/volume-zone-oscillator/

Young Ho Seo
Tutorial Using Excessive Momentum and Fibonacci Ratio Analysis
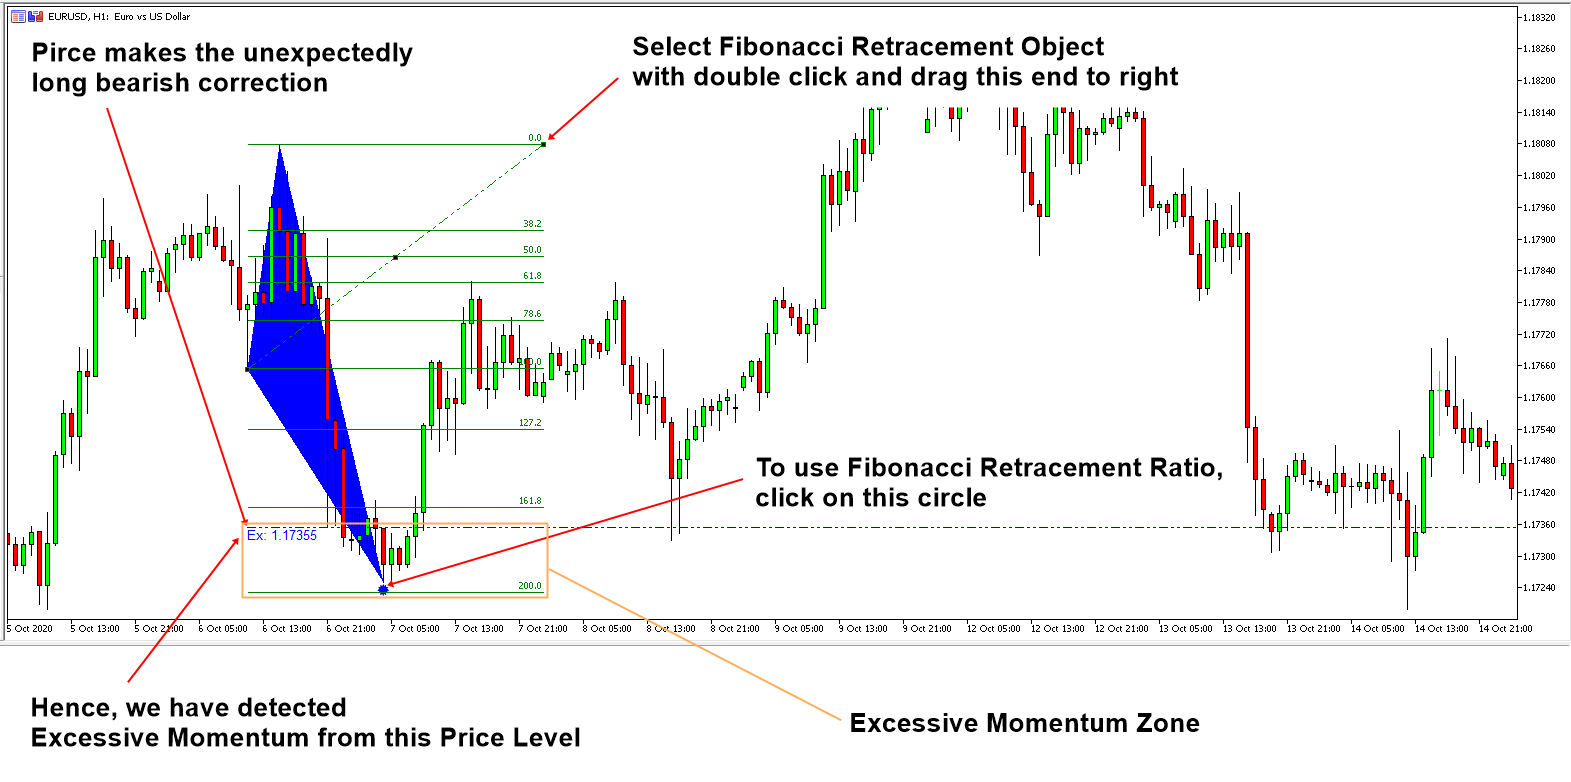
With Excessive Momentum Indicator, you can access to the automatic Fibonacci Ratio Analysis. Combining these two powerful trading system are the excellent ways to trade in Forex market. In this article, we will show you how to combine both with step by step guide.
When there is an unexpectedly long bearish and bullish price movement, the indicator will detect these excessive momentum area for your trading. This excessive momentum zone are often the true accumulation and distribution area in the Volume Spread Analysis. What does this mean for your trading ?This means that entry around this excessive momentum area can provide you the great advantage that favors your Reward and Risk for your trading whether they are breakout trading or reversal trading. The indicator provides such a great opportunity automatically.
In addition, Fibonacci retracement level can provide further idea about when the price can move according to our expectation. To call the Fibonacci retracement level automatically, simply click on the circle at the Excessive Momentum Zone. Then it will place the Fibonacci retracement level automatically in your chart. The thing is that the placed Fibonacci Retracement level might be too short in its width. Sometime, you want to project the Fibonacci Retracement level far right to see the price action around the retracement level. It is doable too.
To do so, double click on the Fibonacci retracement object in your chart. Then you will see the three anchor points in the retracement object. Drag the right anchor point to the right. You can drag them as far as you want to cover the chart area at your interest. Please check the screenshot attached to complete this tutorial.
This Excessive Momentum Zone can be considered as either Accumulation or Distribution area in the Volume Spread Analysis. You can further find the symptoms of accumulation and distribution area using our Volume Spread Pattern Indicator (Paid and Advanced version) or Volume Spread Pattern Detector (Free and Light version). You can watch the YouTube videos to find more about the Excessive Momentum Indicator.
YouTube Video Momentum Indicator: https://youtu.be/oztARcXsAVA
===========================================================================
Here is link to Excessive Momentum Indicator.
https://algotrading-investment.com/portfolio-item/excessive-momentum-indicator/
https://www.mql5.com/en/market/product/30641
https://www.mql5.com/en/market/product/30621
With Excessive Momentum indicator, you can use our Free Volume Spread Pattern Detector. Volume Spread Pattern Detector is a great free tool to complete your Volume Spread Analysis to detect Accumulation and Distribution. Or even you can use them to detect important support and resistance for your trading too. Here is the link to the free Volume Spread Pattern Detector.
https://www.mql5.com/en/market/product/28438
https://www.mql5.com/en/market/product/28439
https://algotrading-investment.com/portfolio-item/volume-spread-pattern-detector/
In addition, Volume Spread Pattern Indicator is the more advanced version of Volume Spread Pattern Detector. If you want to improve your trading performance even more, then we recommend using Volume Spread Pattern Indicator. This is not free indicator but it is affordable. Here is the link to the Advanced Volume Spread Analysis indicator.
https://www.mql5.com/en/market/product/32961
https://www.mql5.com/en/market/product/32960
https://algotrading-investment.com/portfolio-item/volume-spread-pattern-indicator/

Young Ho Seo
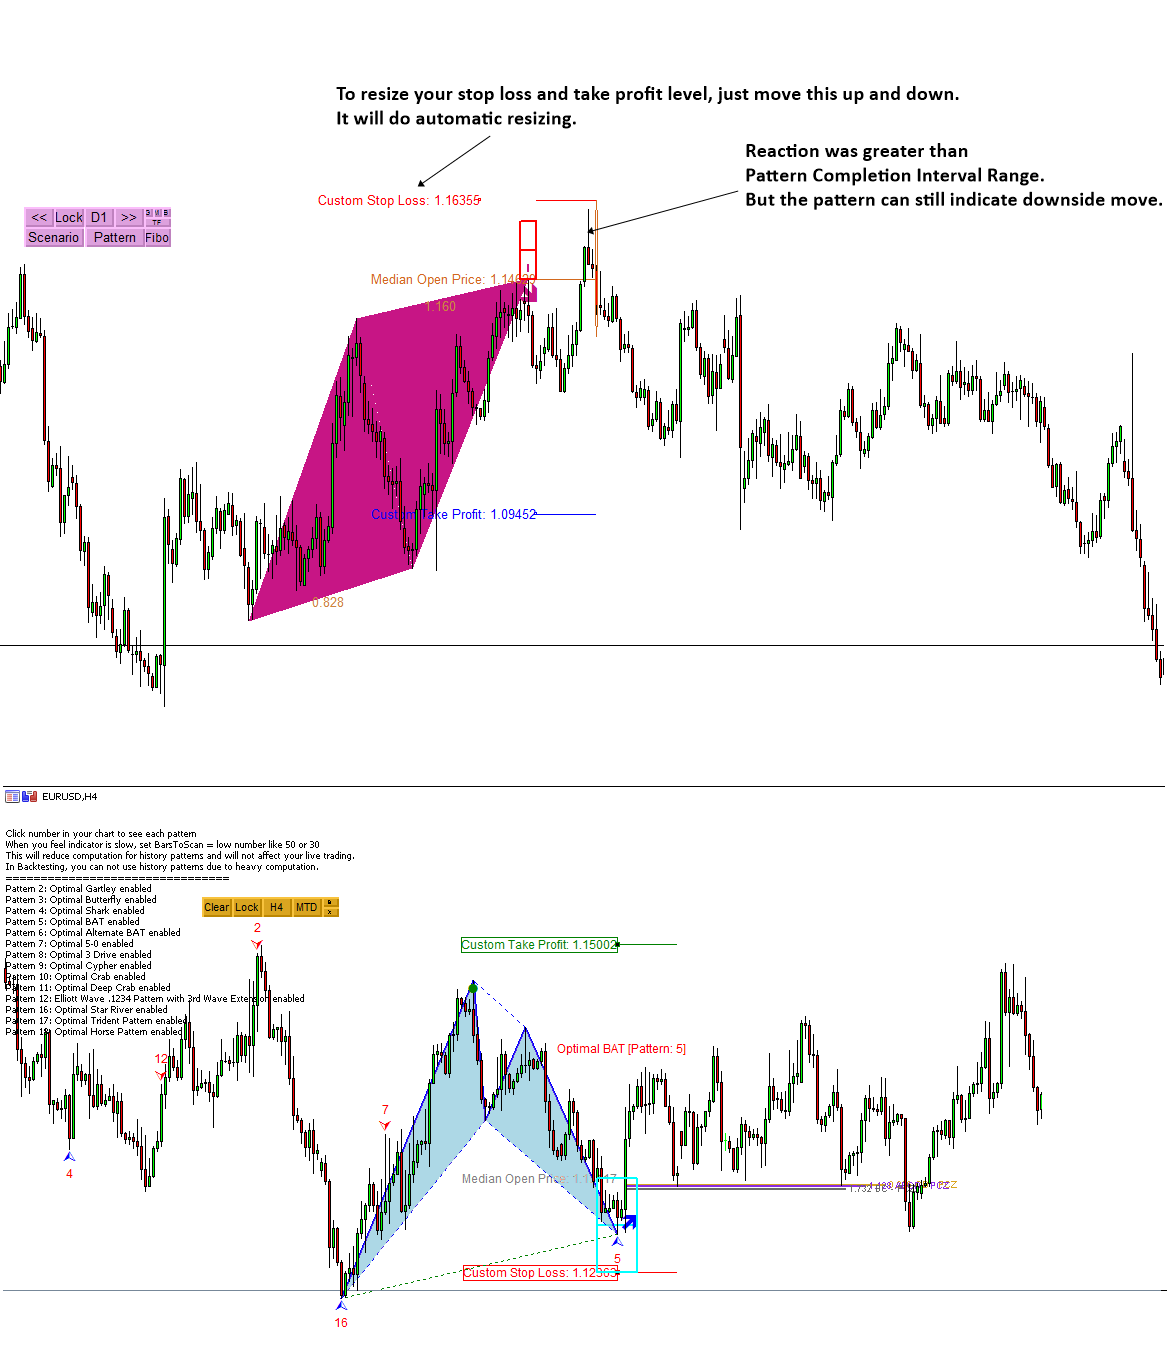
Stop Loss with Harmonic Pattern
Setting up the sensible stop loss can be tricky for harmonic patterns. Managing your stop loss and profit target is one of the most important aspect of Forex trading. This is a short simple article showing how to resize your stop loss and take profit with harmonic patterns. The main point is that the trading zone helps you to manage your stop loss and profit target for Forex trading. The same principle can be applied to the all the harmonic patterns including BAT, Gartley, Butterfly, Shark Pattern, Three drives, 5 to 0, etc.
https://algotrading-investment.com/2019/03/22/automatic-resizing-your-stop-loss-and-take-profit-level-with-harmonic-pattern-plus-harmonic-pattern-scenario-planner/
Likewise, managing stop loss and take profit target is so much easier with this automated Harmonic Pattern Scanner including Harmonic Pattern Plus and Harmonic Pattern Scenario Planner. Both Harmonic Pattern Plus and Harmonic Pattern Scenario Planner are available in MetaTrader 4 and MetaTrader 5.
Below is the landing page for Harmonic Pattern Plus with Japanese Candlestick Pattern Features.
https://algotrading-investment.com/portfolio-item/harmonic-pattern-plus/
https://www.mql5.com/en/market/product/4488
https://www.mql5.com/en/market/product/4475
You can apply the same principle to Harmonic Pattern Scenario Planner.
https://www.mql5.com/en/market/product/6101
https://www.mql5.com/en/market/product/6240
https://algotrading-investment.com/portfolio-item/harmonic-pattern-scenario-planner/

Young Ho Seo
Sujet ajouté Problème de saisie d'ordres multiples pour un compte en direct avec un courtier spécifique
Chers utilisateurs de MQL5. Je rencontre actuellement un problème d' exécution d'ordres multiples avec mon EA, mais uniquement pour un courtier spécifique. Mon EA fonctionne parfaitement dans le testeur de stratégie. Il fonctionne également avec
Young Ho Seo
Sujet ajouté Il est certain que MT5 a été beaucoup plus amélioré que MT4. Mais la majorité des traders utilisent toujours MT4.........
myfxbook ou tout autre site de forex important ne prend pas en charge MT5. C'est une honte que MT5 soit encore moins populaire que MT4. J'ai essayé de télécharger mon relevé sur myfxbook en utilisant MT5 et ils ont fourni un logiciel de transition en
Young Ho Seo
Price Patterns to Identify the Potential Turning Point and Trend
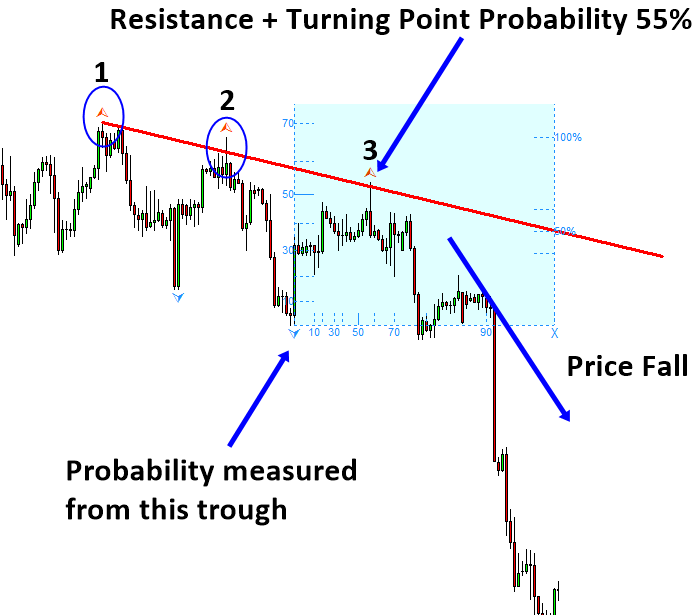
To understand the technical turning point, it is important to check its connection with economics. For example, in Stock market trading, the underlying value of a company can explain the occurrence of the major turning point in the market. Likewise, in the foreign exchange market, the strength and weakness of a currency is often influenced by the fundamental value of a country. The fundamental and economic data release can cause to change the direction of the current price movement. As a result, they often become the major driving force behind the bullish and bearish turning point. Hence, to understand why an important turning point occurs in the financial market, we recommend you to look at following three cases.
Turning point in the Stock market with “Value investing”
Turning point in the Forex market with “Fundamental analysis”
Pairs Trading with turning point
When you understand the driving force of the turning point in connection with economics, it helps you to follow the flow of the smart money from the investment banks and hedge funds. Besides, the price pattern can also help you to predict the turning point technically. When you apply the price pattern together with the knowledge of the fundamental driving force of the turning point, you can increase your performance marginally. Therefore, it is important to understand the price patterns used by the trading community last 100 years. We list the important price patterns for your technical analysis below.
Horizontal support and resistance
Diagonal support and resistance (i.e. trend lines)
Triangles and wedge patterns
Fibonacci analysis
Harmonic pattern
Elliott wave theory
X3 Chart Pattern
To apply these price patterns better in practice, we must understand the origin of these price patterns with the scientific view. Fractal and fractal wave can explain the scientific rational behind these price patterns. Hence, we will look at how these price patterns are connected with “Fractal” and “Fractal Wave”. The scientific knowledge around these price patterns will help you to understand the flow of the financial market as said by Mark Twain “History Doesn’t Repeat, But It Often Rhymes”. In addition, you will find out that “Fractal” and “Fractal Wave” is the powerful tool to overcome the limitation of the modern trend and cycle analysis. The price patterns are in fact the practical application of “Fractal” and “Fractal Wave” in the financial market. Furthermore, we will provide the universal pattern framework to help you understand these price patterns with one unified knowledge. Therefore, we will make use of the X3 Pattern Framework while educating these price patterns.
About this Article
This article is the part taken from the draft version of the Book: Science Of Support, Resistance, Fibonacci Analysis, Harmonic Pattern, Elliott Wave and X3 Chart Pattern. Full version of the book can be found from the link below:
https://algotrading-investment.com/portfolio-item/science-of-support-resistance-fibonacci-analysis-harmonic-pattern/
With Fractal Pattern Scanner, you can quantify your trading opportunity with the support and resistance whether they are diagonal or horizontal. Below is the landing page for Fractal Pattern Scanner in MetaTrader version.
https://www.mql5.com/en/market/product/49170
https://www.mql5.com/en/market/product/49169
https://algotrading-investment.com/portfolio-item/fractal-pattern-scanner/
Below is the landing page for Optimum Chart, which is the standalone tool to scan the trading opportunities for all symbols and all timeframe in one button click.
https://algotrading-investment.com/2019/07/23/optimum-chart/

Young Ho Seo
Harmonic Pattern Indicator with Japanese Candlestick Pattern
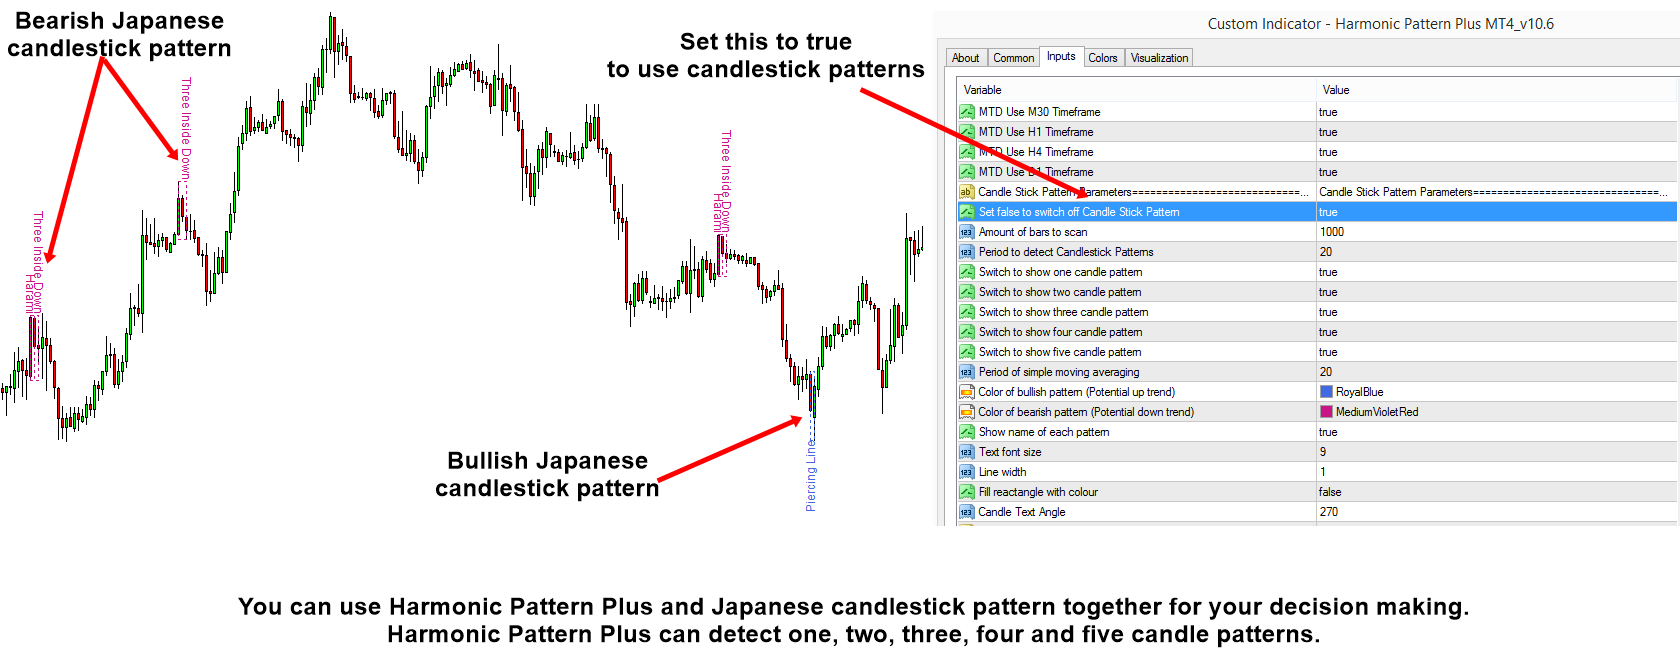
Apparently Japanese Candlestick patterns are popular and helpful tools to trader to predict the market direction. It is possible to use Japanese Candlestick patterns in your Harmonic Pattern Trading. These Japanese candlestick patterns include “Hammer”, “Doji Star”, “Harami”, “Inverted Hammer”, “Break away” and so on.
Here is some short article on how to use Japanese candlestick pattern with Harmonic Pattern Plus. This article meant to be quick guideline on enabling Japanese Candlestick pattern together with Harmonic Pattern. In addition, you can use the Japanese Candlestick Patterns from X3 Chart Pattern Scanner too.
https://algotrading-investment.com/2019/04/19/using-japanese-candlestick-patterns-with-harmonic-pattern-plus/
Link to Harmonic Pattern Plus
https://www.mql5.com/en/market/product/4488
https://www.mql5.com/en/market/product/4475
https://algotrading-investment.com/portfolio-item/harmonic-pattern-plus/
Link to X3 Chart Pattern Scanner
https://www.mql5.com/en/market/product/41993
https://www.mql5.com/en/market/product/41992
https://algotrading-investment.com/portfolio-item/profitable-pattern-scanner/

Young Ho Seo
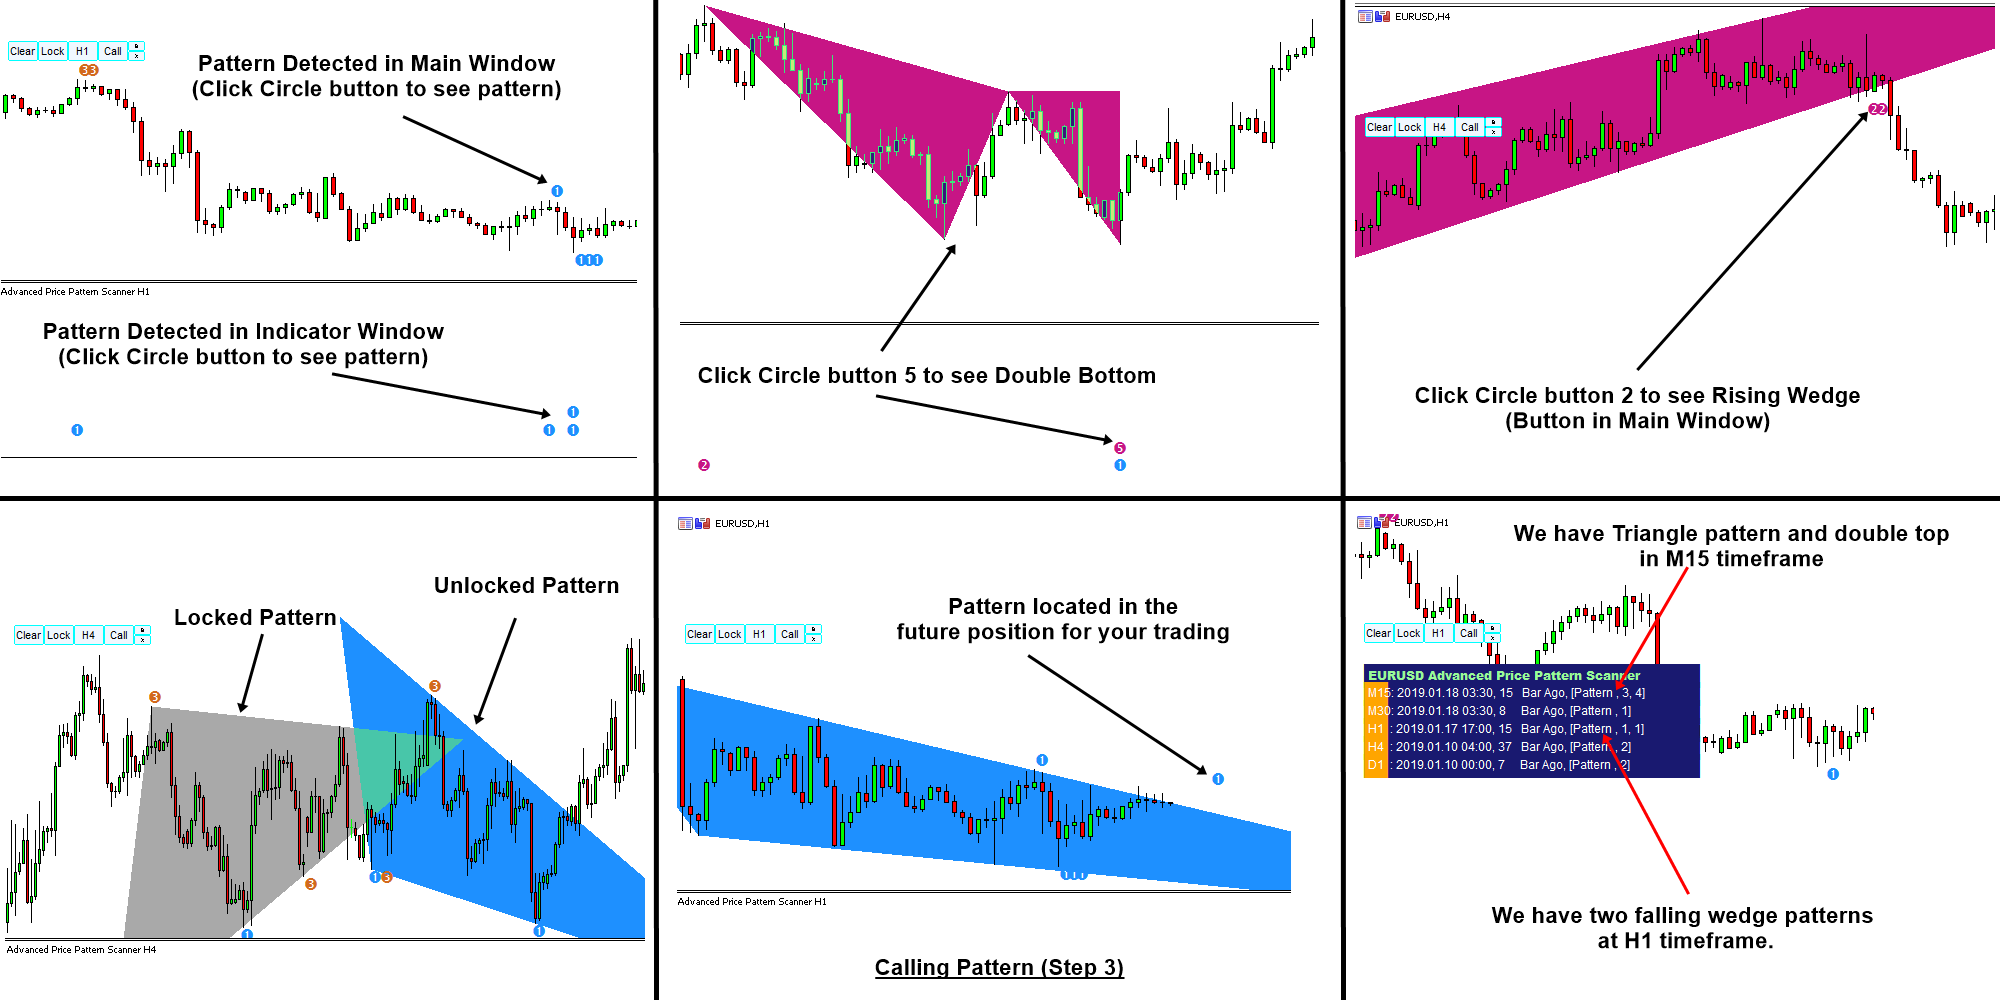
Great Technical Indicators for Price Action
Here is great technical indicator for Price Action Trading. Both MetaTrader 4 and MetaTrader 5 versions are available.
1. Advanced Price Pattern Scanner
Detecting price patterns like Triangle, Falling Wedge, Rising Wedge, Double Top, Double Bottom, Head and Shoulder, Reverse of Head and Shoulder, Cup and Handle or Cup with Handle, Reverse of Cup and Handle or Cup with Handle. What is even better, this is non repainting indicator, which means great for your trading.
https://www.mql5.com/en/market/product/24679
https://www.mql5.com/en/market/product/24678
https://algotrading-investment.com/portfolio-item/advanced-price-pattern-scanner/
2. Ace Supply Demand Zone indicator
Ace Supply Demand Zone indicator is a great indicator to extend support and resistance concept into supply and demand zone. This is powerful and great as it uses non repainting and non lagging algorithm.
https://www.mql5.com/en/market/product/40076
https://www.mql5.com/en/market/product/40075
https://algotrading-investment.com/portfolio-item/mean-reversion-supply-demand/
3. Mean Reversion Supply Demand
Mean Reversion Supply Demand is another affordable supply and demand zone trading system but with a lot of rich features. For your information, both ace supply demand zone and mean reversion supply demand use a complete different algorithm.
https://www.mql5.com/en/market/product/16823
https://www.mql5.com/en/market/product/16851
https://algotrading-investment.com/portfolio-item/mean-reversion-supply-demand/
4. Price Breakout Pattern Scanner
Price Breakout Pattern Scanner can also detect price patterns like riangle, Falling Wedge, Rising Wedge, Double Top, Double Bottom, Head and Shoulder, Reverse of Head and Shoulder. In addition, you can use the power of smart renko together.
https://www.mql5.com/en/market/product/4859
https://www.mql5.com/en/market/product/4858
https://algotrading-investment.com/portfolio-item/price-breakout-pattern-scanner/

Young Ho Seo
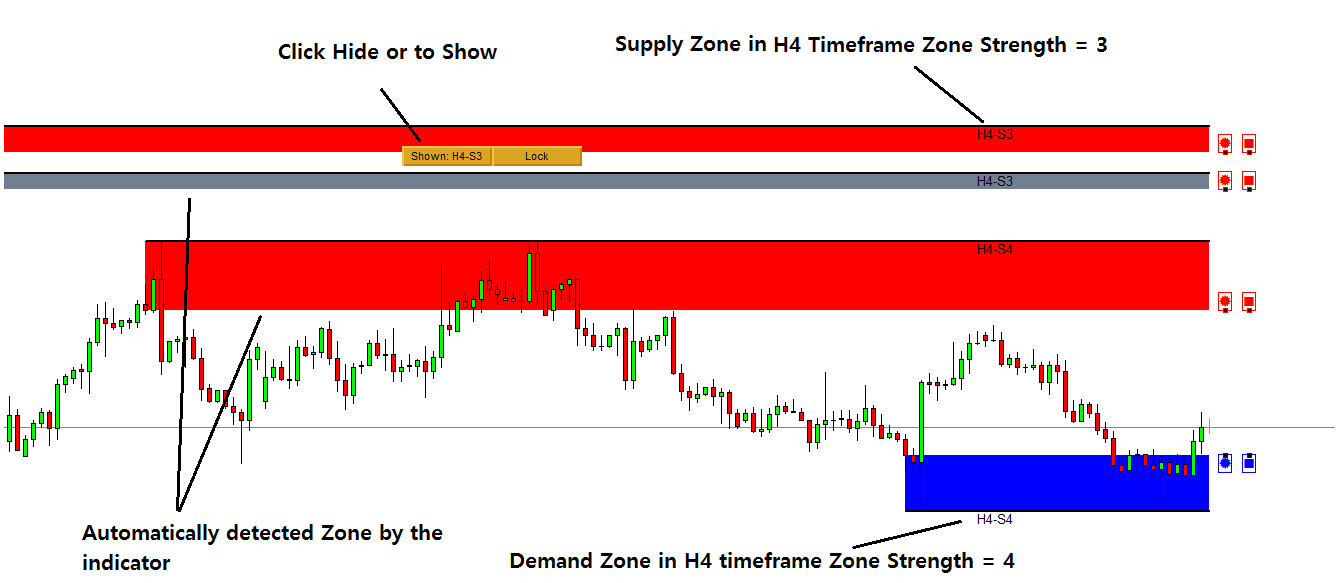
Mean Reversion Supply Demand Basic Guideline
Supply and Demand zone is the extended version of support and resistance trading with more skills. We provide our own Supply and Demand Zone indicator, Mean Reversion Supply Demand.
Here is the really basic guideline in using Mean Reversion Supply Demand.
H4 = Zone detected in H4 timeframe
S3 = Zone Strength 3
You can also show or hide zones from your chart using button click.
Below are the links to the Mean Reversion Supply Demand indicator for MetaTrader 4/MetaTrader 5.
https://www.mql5.com/en/market/product/16823
https://www.mql5.com/en/market/product/16851
https://algotrading-investment.com/portfolio-item/mean-reversion-supply-demand/
Supply and Demand zone is the extended version of support and resistance trading with more skills. We provide our own Supply and Demand Zone indicator, Mean Reversion Supply Demand.
Here is the really basic guideline in using Mean Reversion Supply Demand.
H4 = Zone detected in H4 timeframe
S3 = Zone Strength 3
You can also show or hide zones from your chart using button click.
Below are the links to the Mean Reversion Supply Demand indicator for MetaTrader 4/MetaTrader 5.
https://www.mql5.com/en/market/product/16823
https://www.mql5.com/en/market/product/16851
https://algotrading-investment.com/portfolio-item/mean-reversion-supply-demand/

Young Ho Seo
Trading Chart Patterns in Forex and Stock Market
Chart patterns are the essential price analysis for Forex and Stock market trading as the price is the single most important variable in the market. You can not miss to study the price, even it is very basic one. No one would attempt to trade without seeing the price itself. When you use the chart patterns wisely as the timing tool, it will often reward you more than people who does not use them. Chart patterns include support, resistance, Fibonacci Analysis, harmonic pattern, Elliott Wave, X3 Chart pattern, triangles, rising wedge, falling wedge pattern, channels and many more. Your next question would be why they are so important for our trading and how to use them in our trading. This is rather not short story to be packed in this single article. We can only tell where you can find such a guidance using the chart patterns in Forex and Stock market. The book: Science Of Support, Resistance, Fibonacci Analysis, Harmonic Pattern, Elliott Wave and X3 Chart Pattern (In Forex and Stock Market Trading) is exactly the book dedicated for this topic. This book will provide the scientific rational for chart patterns, connection with economics, chart pattern detection examples, how to use them and how to improve them in Forex and Stock market.
The book can be found in all the major book distributors in the world. Please choose the best book distributor you like from the link below including amazon.com, Google Play Book, scribd.com, Apple Book and so on.
https://algotrading-investment.com/portfolio-item/science-of-support-resistance-fibonacci-analysis-harmonic-pattern/
Learning the geometric shape of the price patterns might be not sufficient to apply them well in the financial market. If we understand why the price patterns exist in the financial market, we can use them more accurately. Hence, it is important to understand the underlying science behind the price patterns. In doing so, we need to understand the trend and cycle. Then we need to see the connection of fractal wave with trend and cycle. Finally, when we recognize the fractal wave as the superior analytical method to the existing methods, we will understand why price patterns were used in the financial market over 100 years. With understanding of the turning point in connection with economics, this can advance your knowledge and practice for your day trading and investing.
In addition, we provide the automated chart pattern scanner for the harmonic patterns, triangle and wedge patterns respectively. The automated chart pattern scanner helps you to detect some repeating chart patterns automatically. They are the convenient tool to use after you have understood how the chart patterns works for your trading.
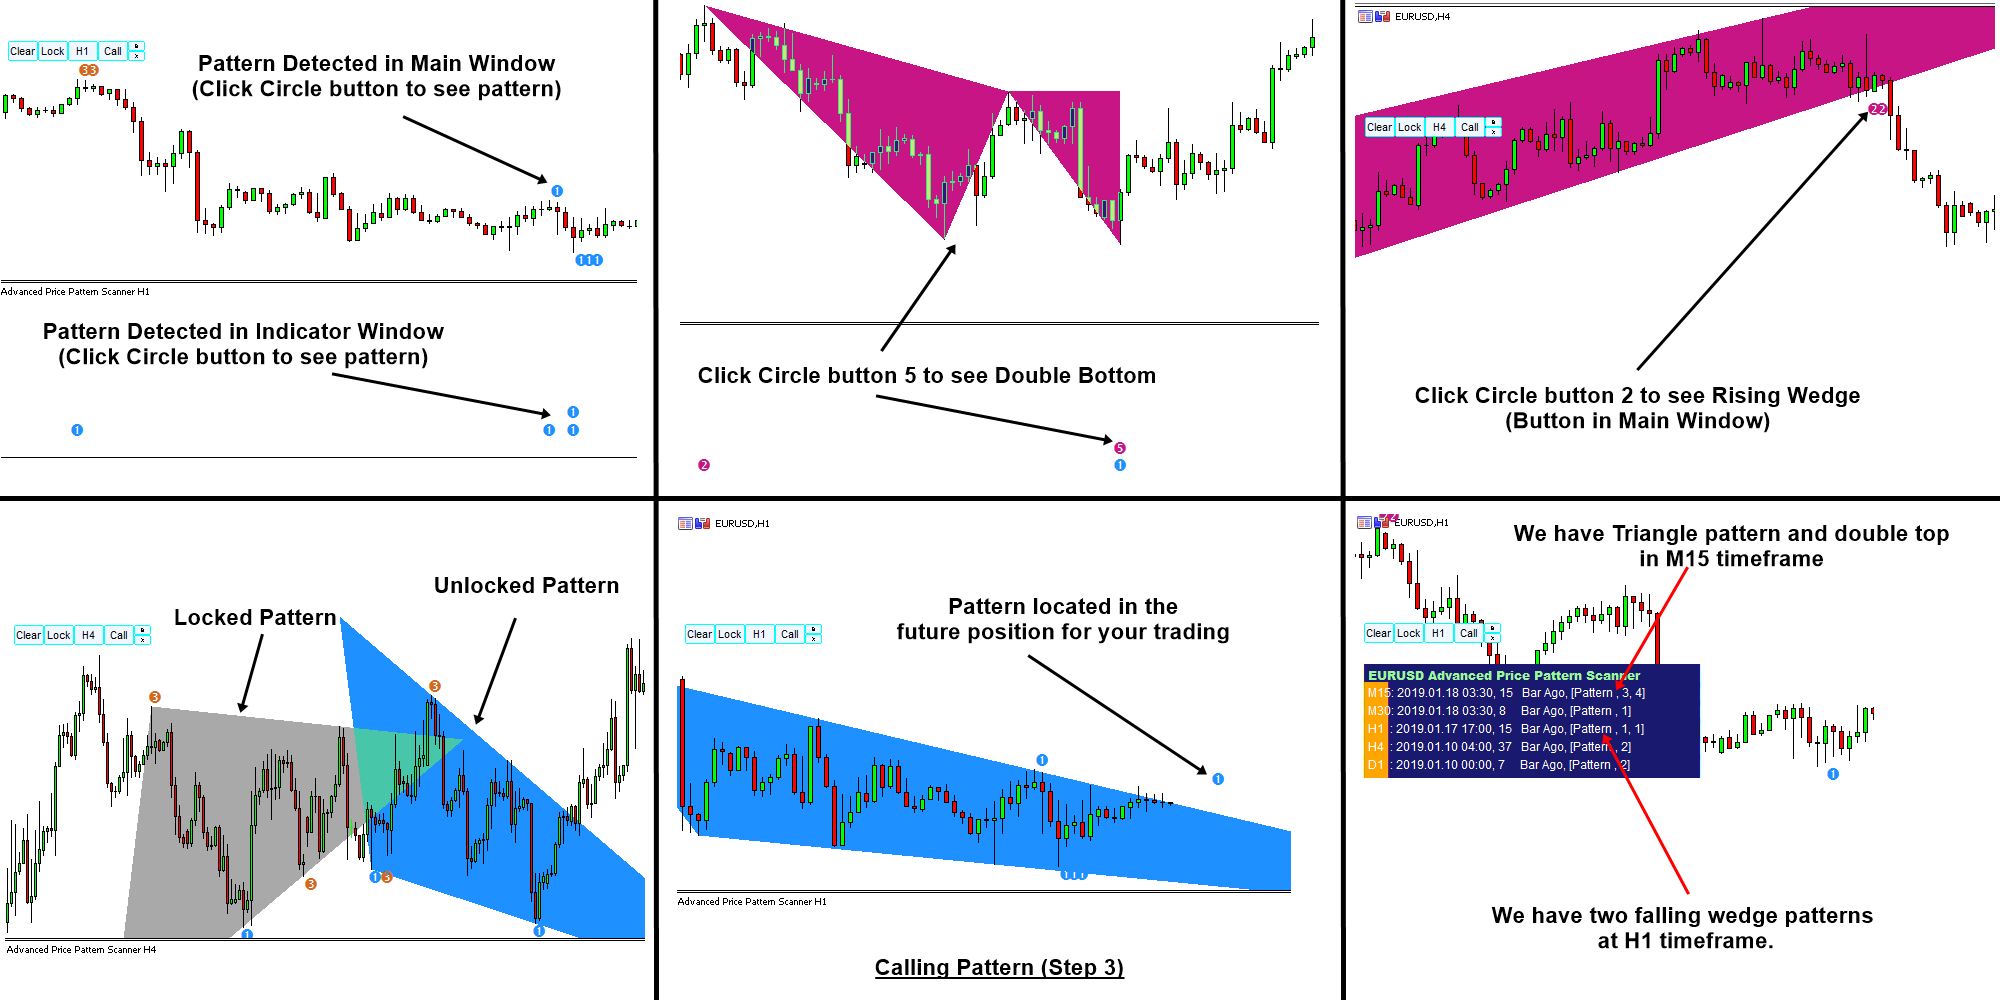
1. Advanced Price Pattern Scanner (Triangle + Wedge patterns + others)
Advanced Price Pattern Scanner is the non repainting pattern scanner designed for both MetaTrader 4 and MetaTrader 5. It can detects many important price patterns for your trading like rising wedge, falling wedge, head and shoulder patterns, Cup and Handle, etc. Here is an intro video for Advanced Price Pattern Scanner from YouTube. Please check it out.
https://algotrading-investment.com/portfolio-item/advanced-price-pattern-scanner/
https://www.mql5.com/en/market/product/24679
https://www.mql5.com/en/market/product/24678
1. X3 Chart Pattern Scanner (Harmonic Pattern + X3 Chart Pattern)
X3 Chart Pattern Scanner is next generation tools to trade with X3 price patterns in Forex market. With non repainting and non lagging algorithm, this tool can detect with advanced Harmonic Pattern, Elliott Wave Pattern, X3 Pattern structure for your trading. As a bonus, it provides your Japanese candlestick patterns too. X3 Chart Pattern Scanner is type 4 harmonic pattern indicator, which means that you can fine tune your strategy using historical patterns while you are trading the same patterns on live trading.
https://www.mql5.com/en/market/product/41993
https://www.mql5.com/en/market/product/41992
https://algotrading-investment.com/portfolio-item/profitable-pattern-scanner/
For your information, the attached screenshot shows the advanced price pattern scanner.

: