
|
7+ années
expérience
|
32
produits
|
143
versions de démo
|
|
0
offres d’emploi
|
0
signaux
|
0
les abonnés
|
👑 Physicien théoricien, programmeur.
Je négocie depuis quinze ans en mettant l'accent sur la recherche de modèles mathématiques du marché.
----------------------------------------------------------------------------------------------------------------------------------
💰 Produits présentés:
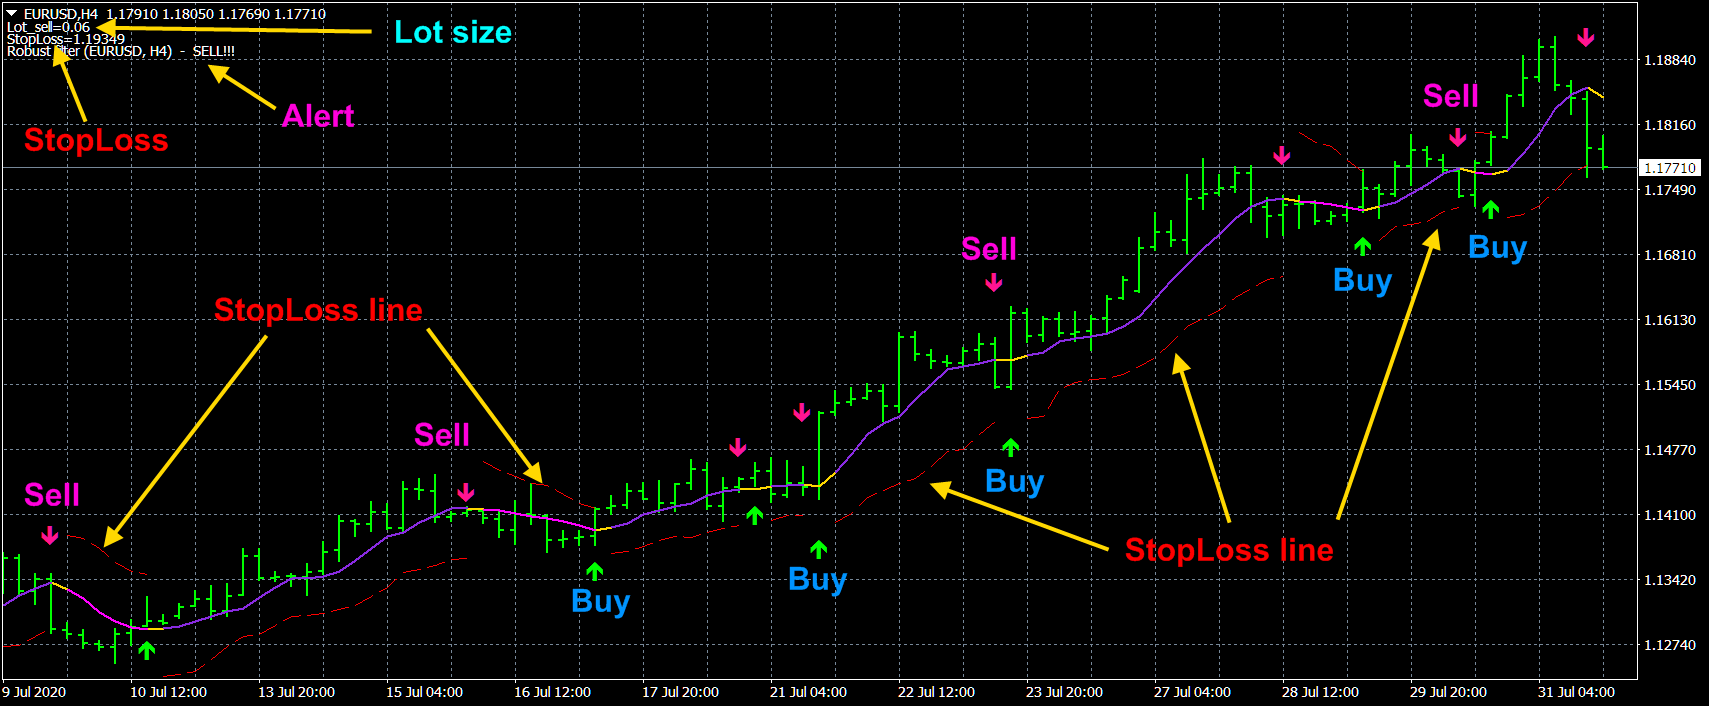
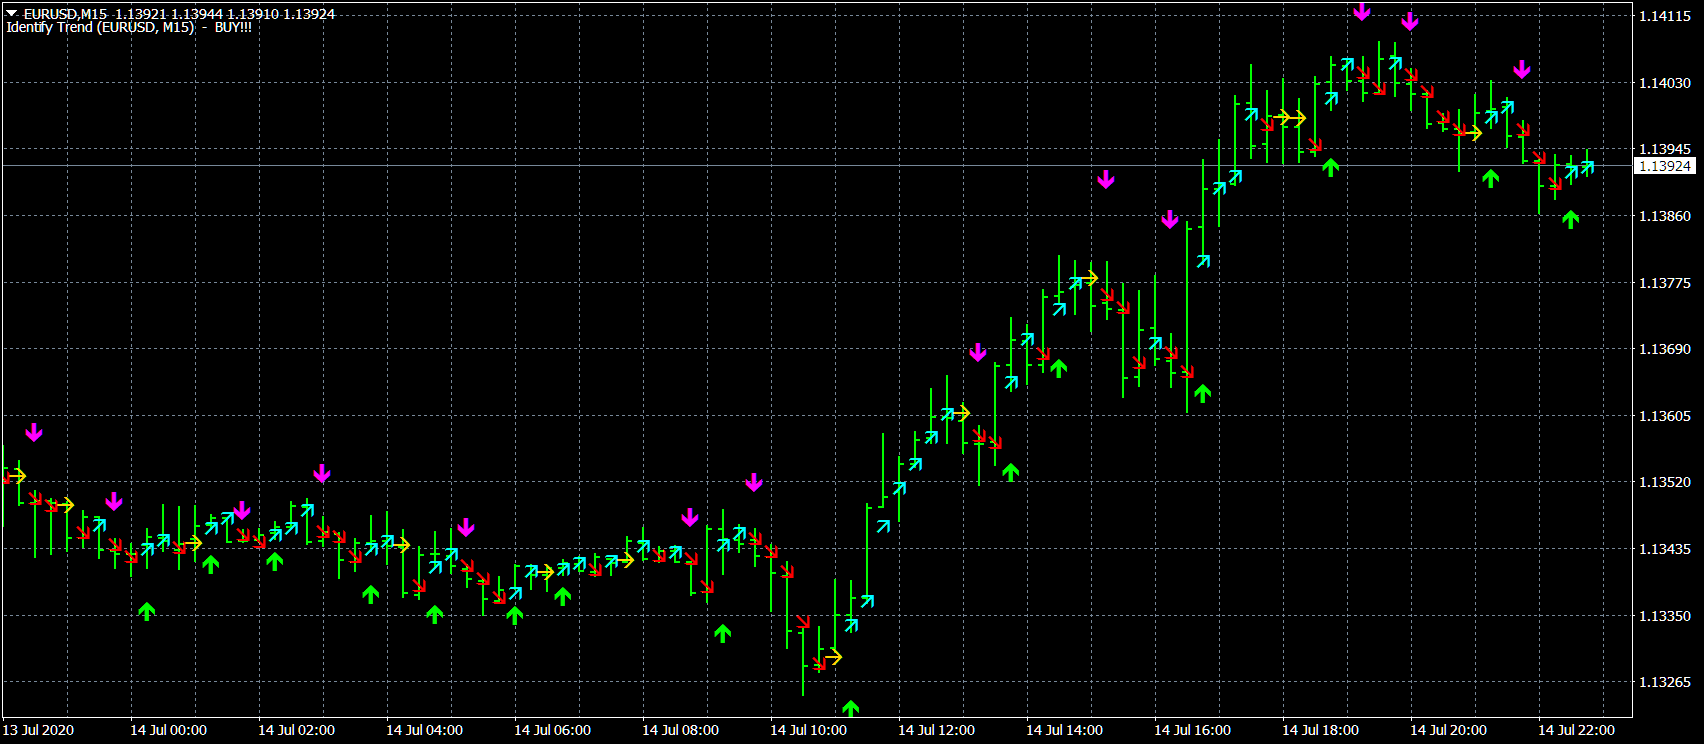
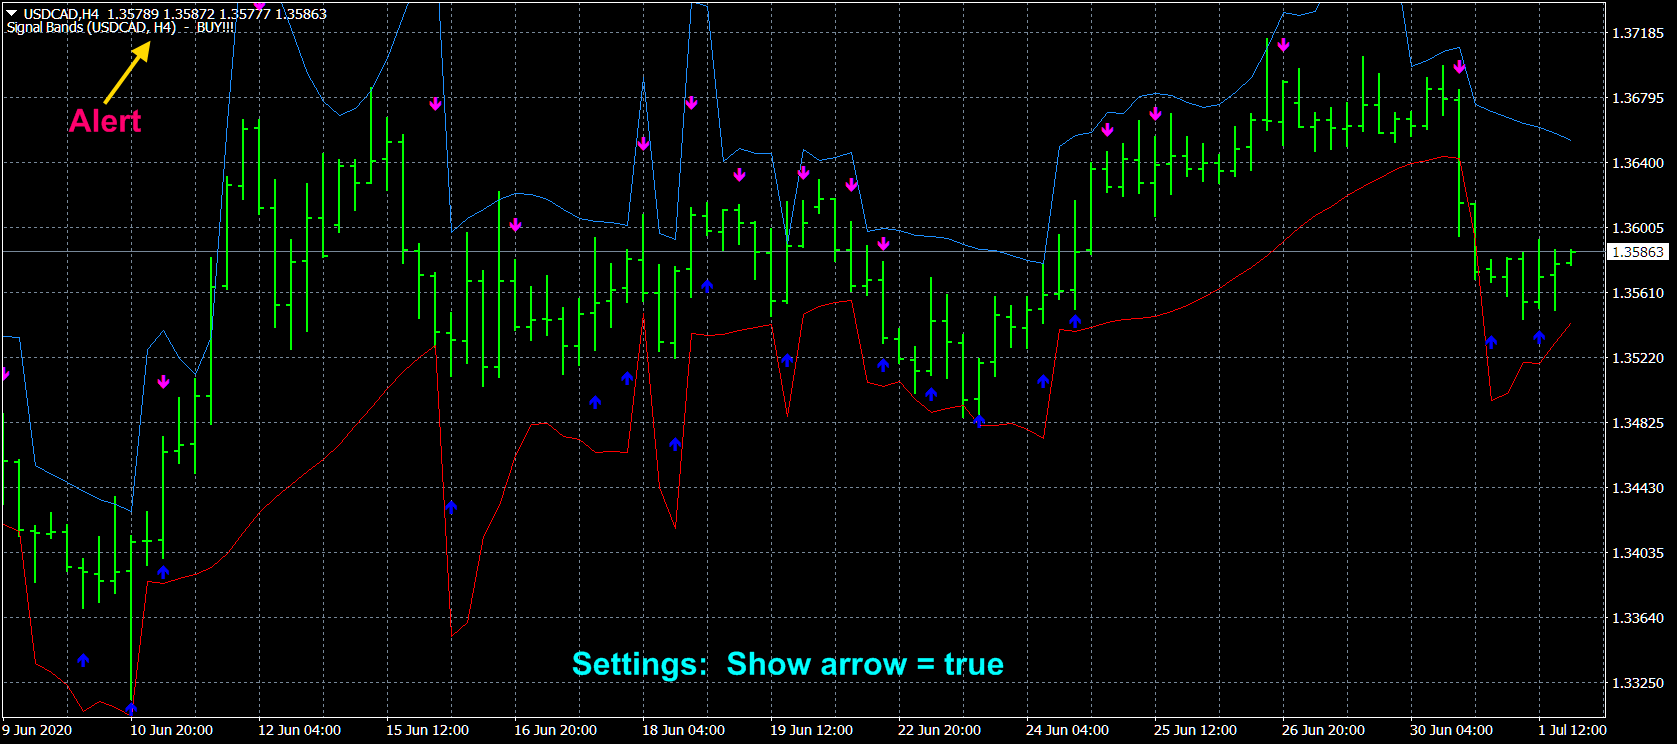
1) 🏆 Indicateurs avec filtrage optimal du bruit de marché (pour sélectionner les points d'ouverture et de clôture des positions).
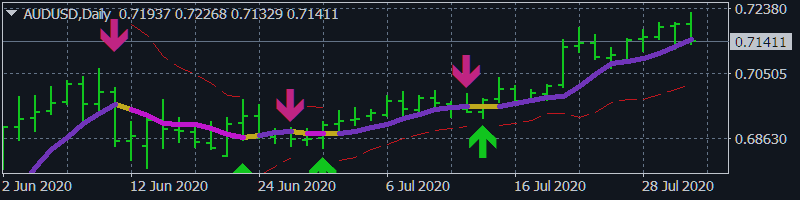
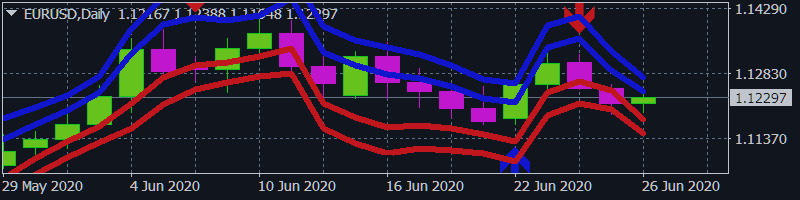
2) 🏆 Indicateurs statistiques (pour déterminer la tendance mondiale).
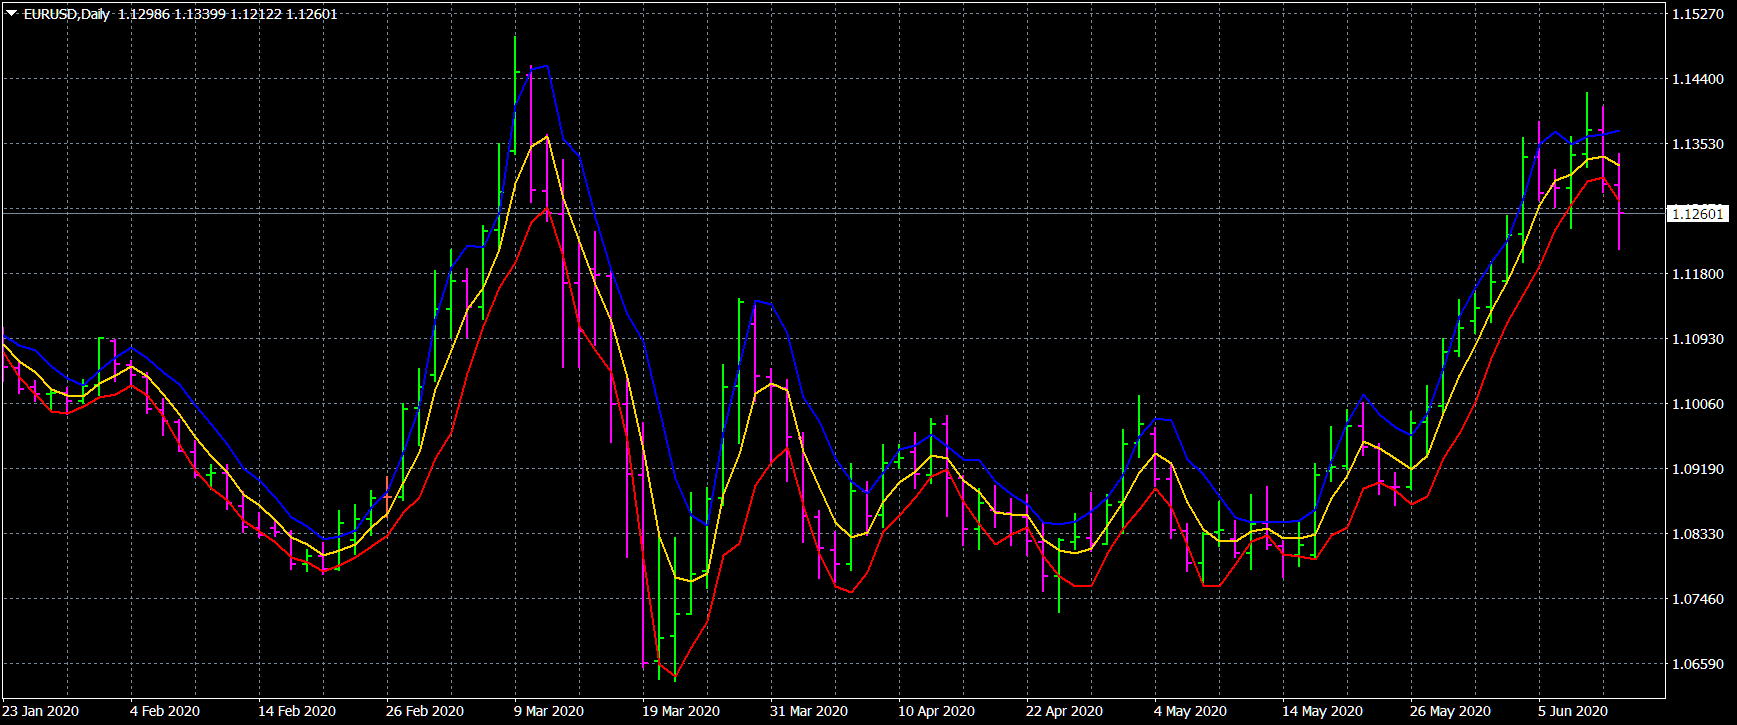
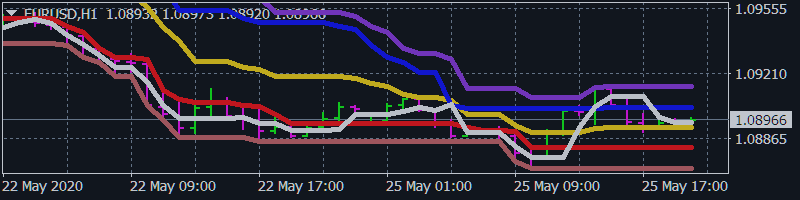
3) 🏆 Indicateurs d'études de marché (pour clarifier la microstructure des prix, construire des canaux, identifier les différences entre les inversions de tendance et les reculs).
----------------------------------------------------------------------------------------------------------------------------------
☛ Plus d'informations sur le blog https://www.mql5.com/en/blogs/post/741637
Je négocie depuis quinze ans en mettant l'accent sur la recherche de modèles mathématiques du marché.
----------------------------------------------------------------------------------------------------------------------------------
💰 Produits présentés:
1) 🏆 Indicateurs avec filtrage optimal du bruit de marché (pour sélectionner les points d'ouverture et de clôture des positions).
2) 🏆 Indicateurs statistiques (pour déterminer la tendance mondiale).
3) 🏆 Indicateurs d'études de marché (pour clarifier la microstructure des prix, construire des canaux, identifier les différences entre les inversions de tendance et les reculs).
----------------------------------------------------------------------------------------------------------------------------------
☛ Plus d'informations sur le blog https://www.mql5.com/en/blogs/post/741637

Aleksey Ivanov

· 2
Dirceu Francisco De Nadal
2020.07.02
I suggest create a (Tradeable Volatility Identifier), then we can use the bunch of EAs that depends on it and do not forecast volatility. This is the problem of all EAs that operates forex pairs. For example from a specific level and up a pair is tradeable, from the same specific level and down pair is not tradeable.


Aleksey Ivanov
· 1
Aleksey Ivanov
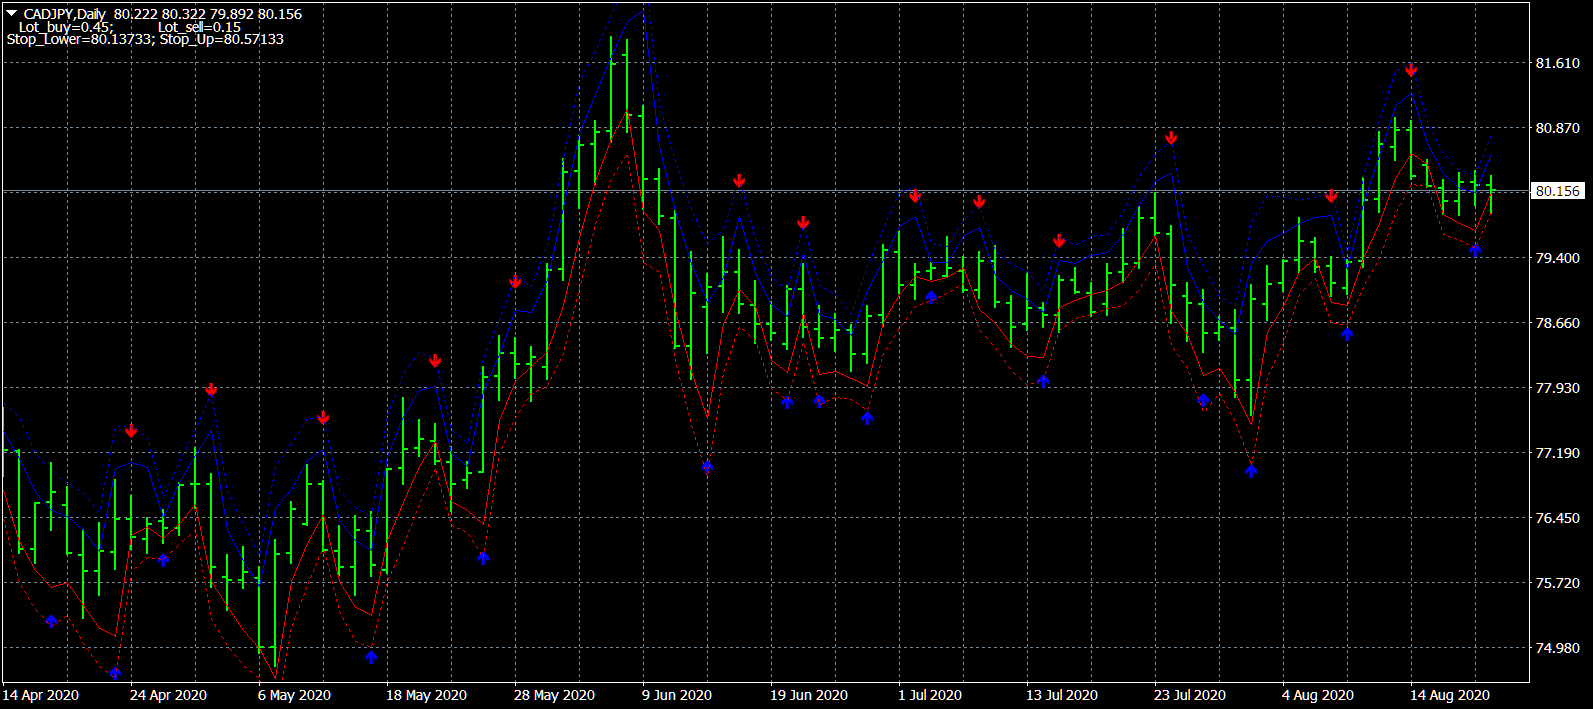
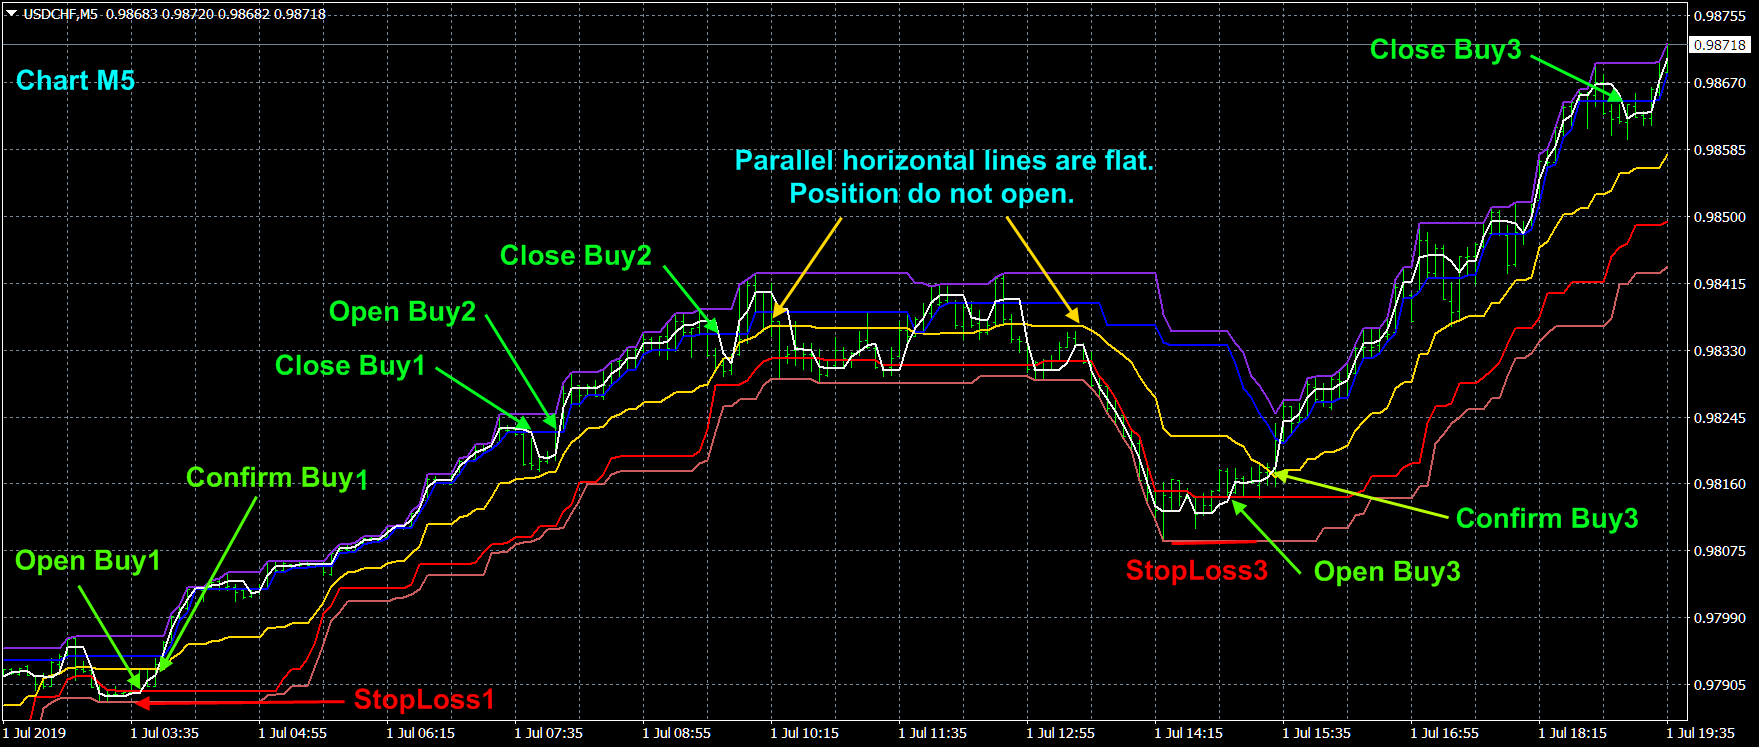
2020.05.24
Here is a screenshot of a future blog describing how to work with this indicator. First, on a larger chart, the direction of the trend is determined, which is identified as a long-term upward trend, so you need to play to buy. Then, on the smaller tamframe already presented here, positions open to buy. At the end of the flat area, there is indeed a strong pullback; but we don’t play on the rollback in this strategy, because when it begins we cannot know how long it will last.
