• Informations
7+ années
expérience
32
produits
142
versions de démo
0
offres d’emploi
0
signaux
0
les abonnés
👑 Physicien théoricien, programmeur.
Je négocie depuis quinze ans en mettant l'accent sur la recherche de modèles mathématiques du marché.
----------------------------------------------------------------------------------------------------------------------------------
💰 Produits présentés:
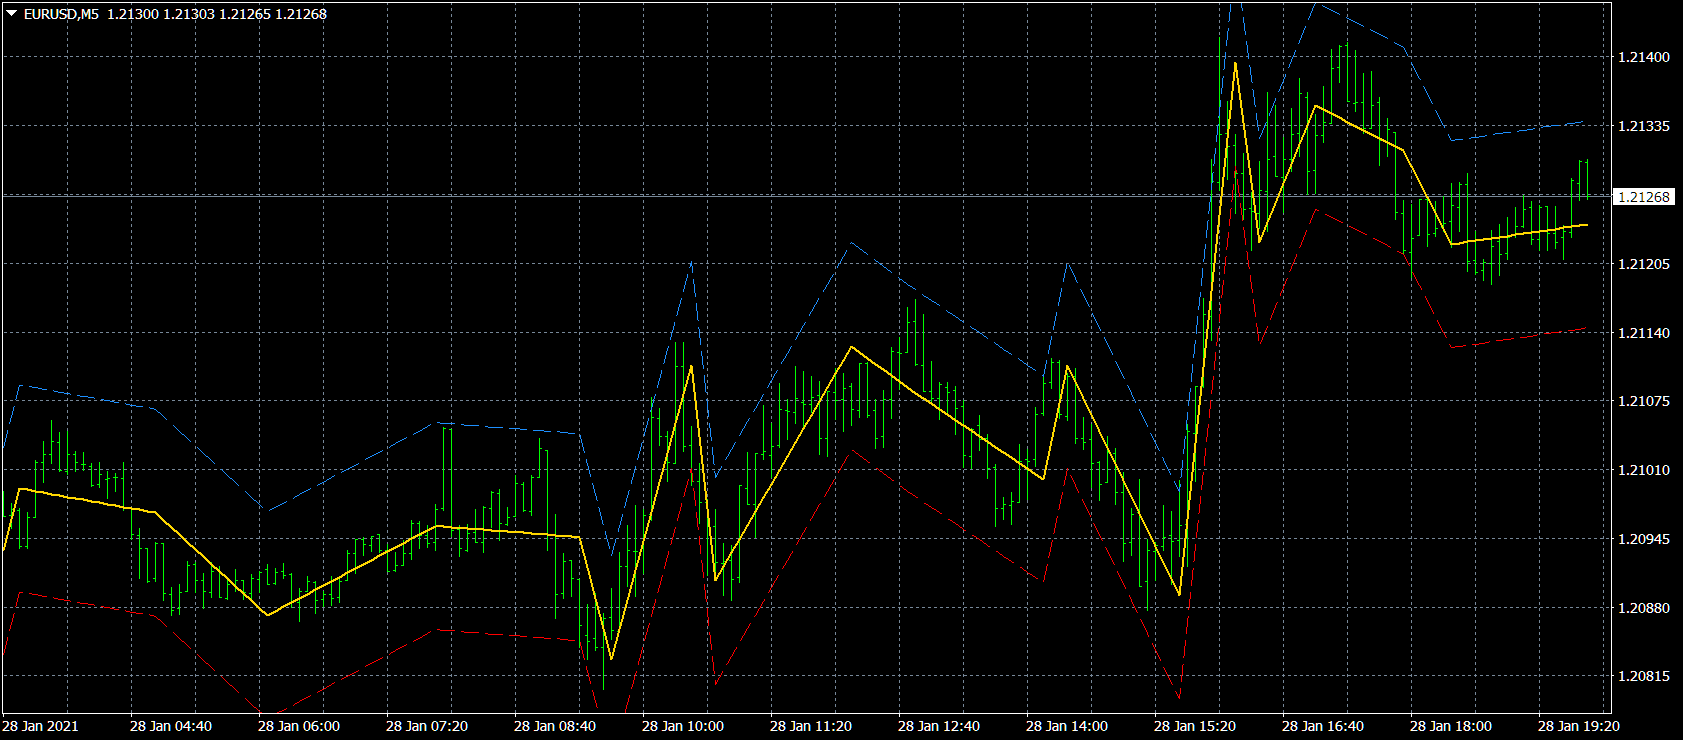
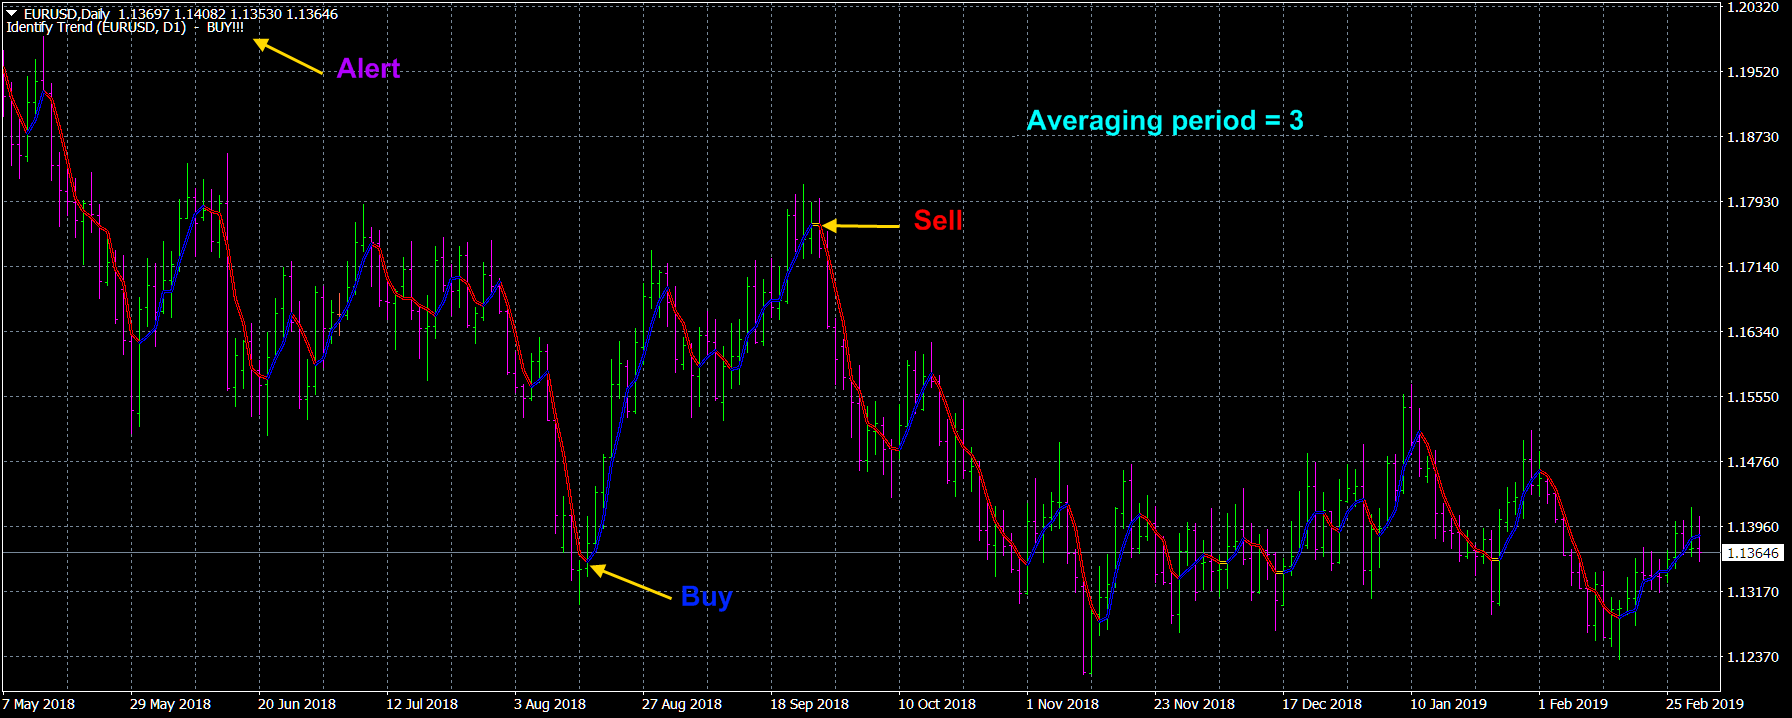
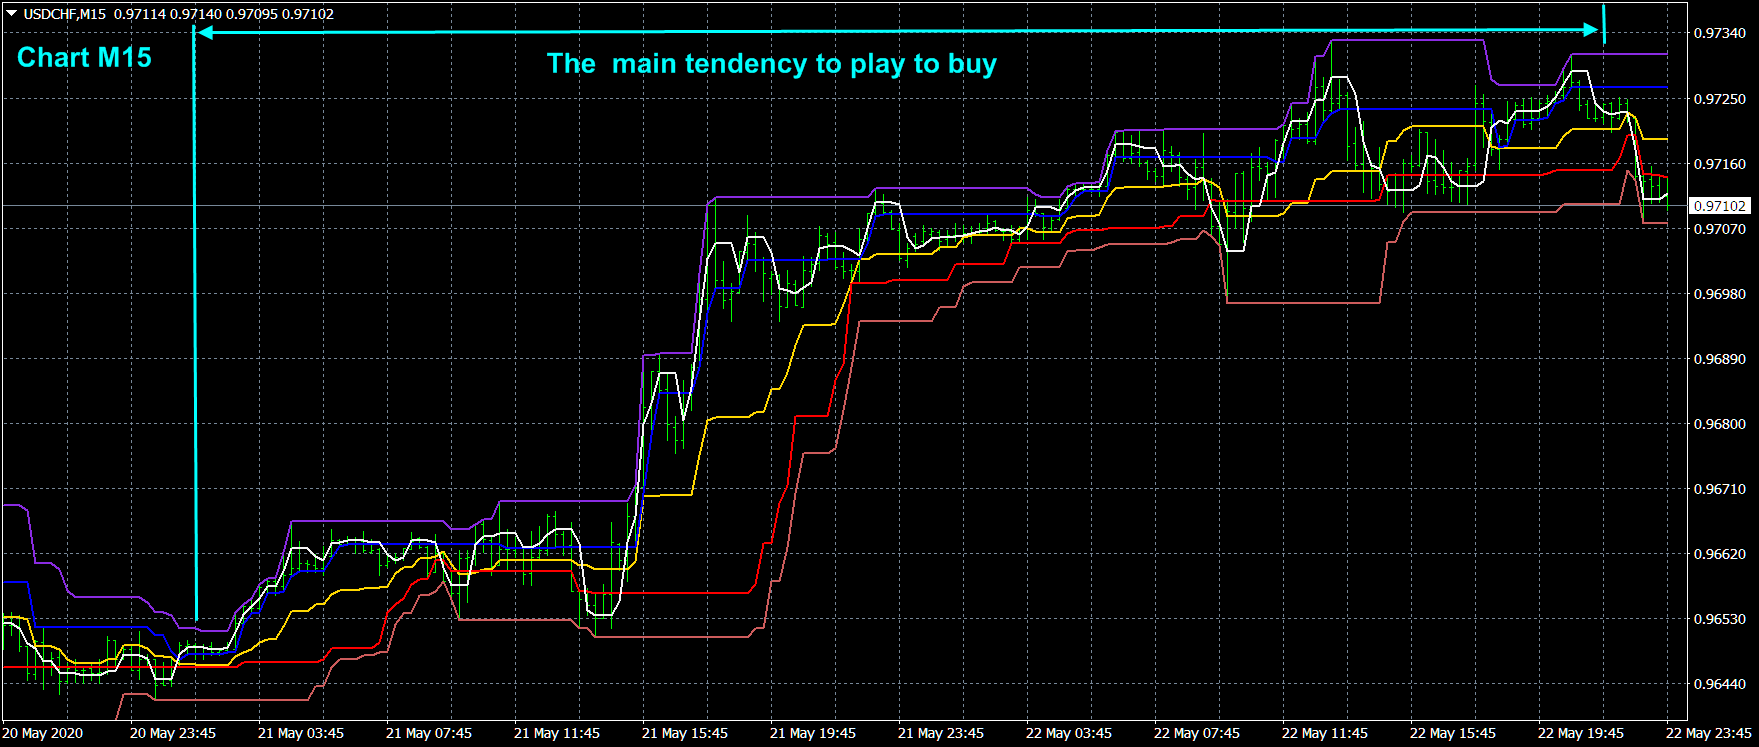
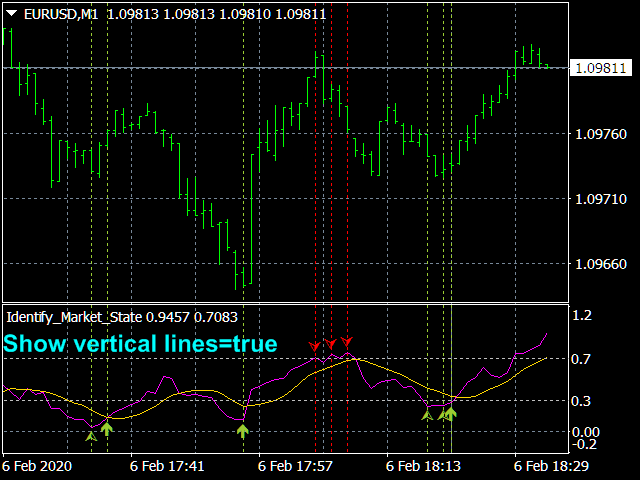
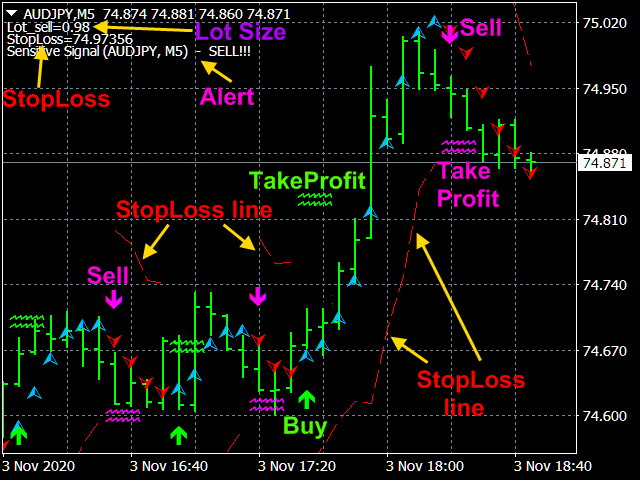
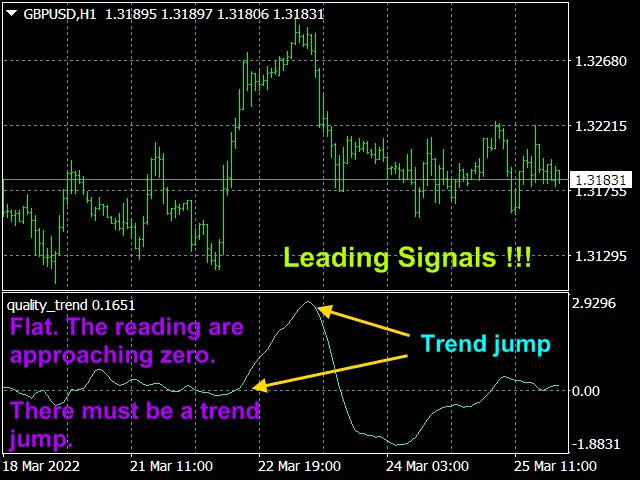
1) 🏆 Indicateurs avec filtrage optimal du bruit de marché (pour sélectionner les points d'ouverture et de clôture des positions).
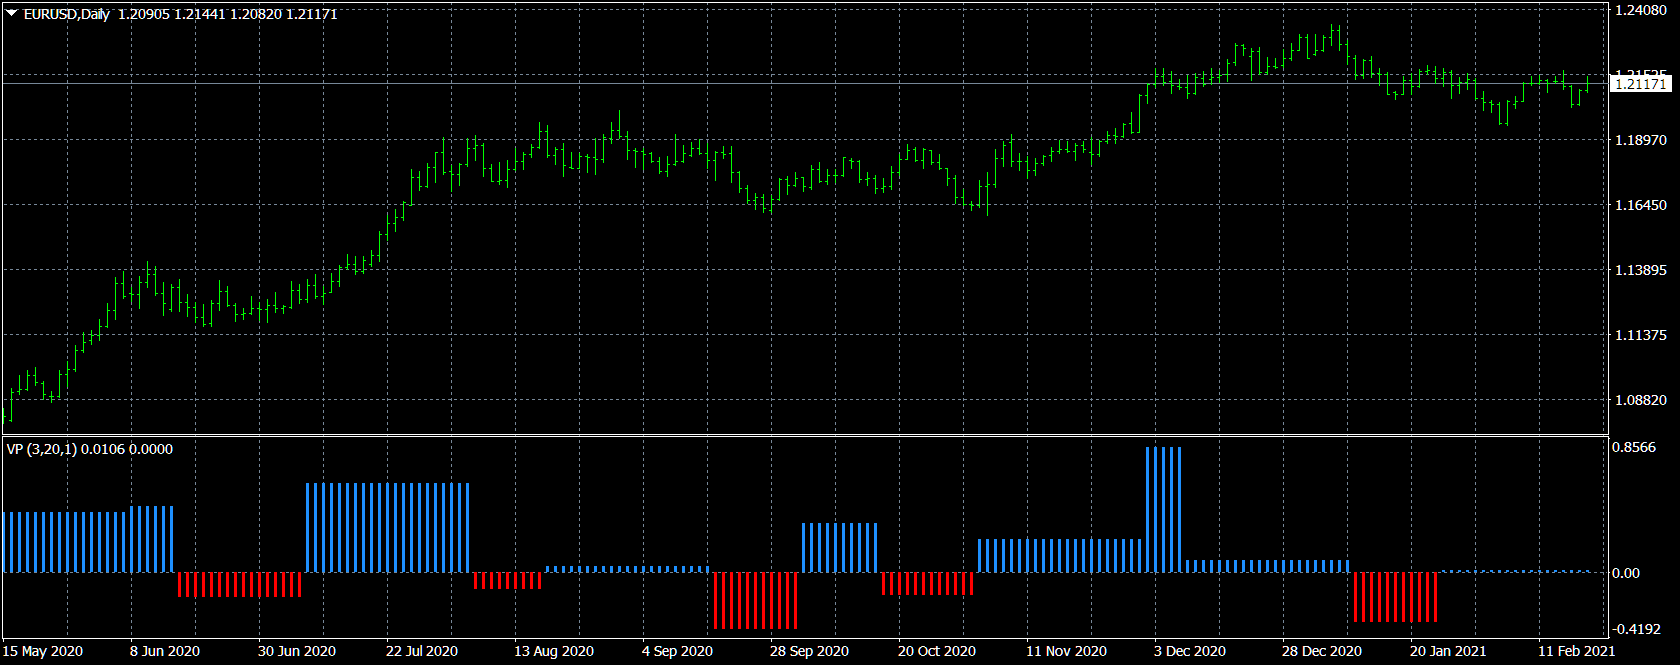
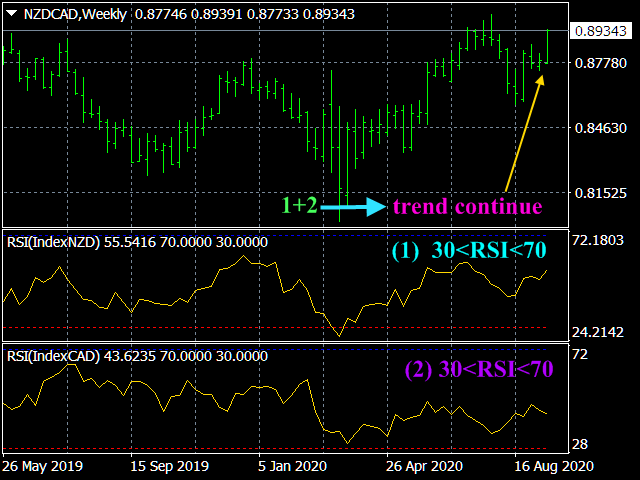
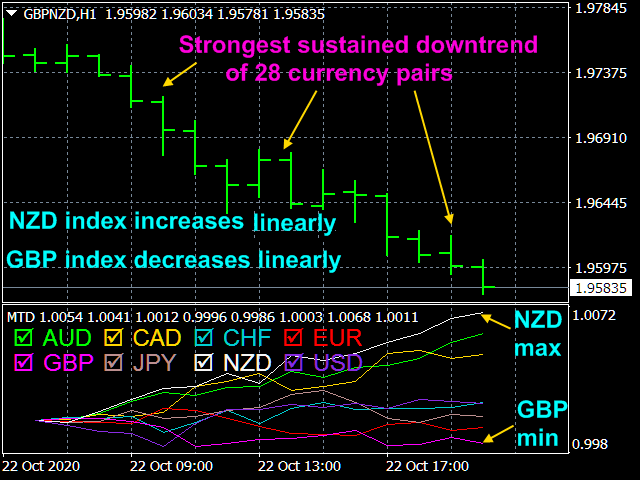
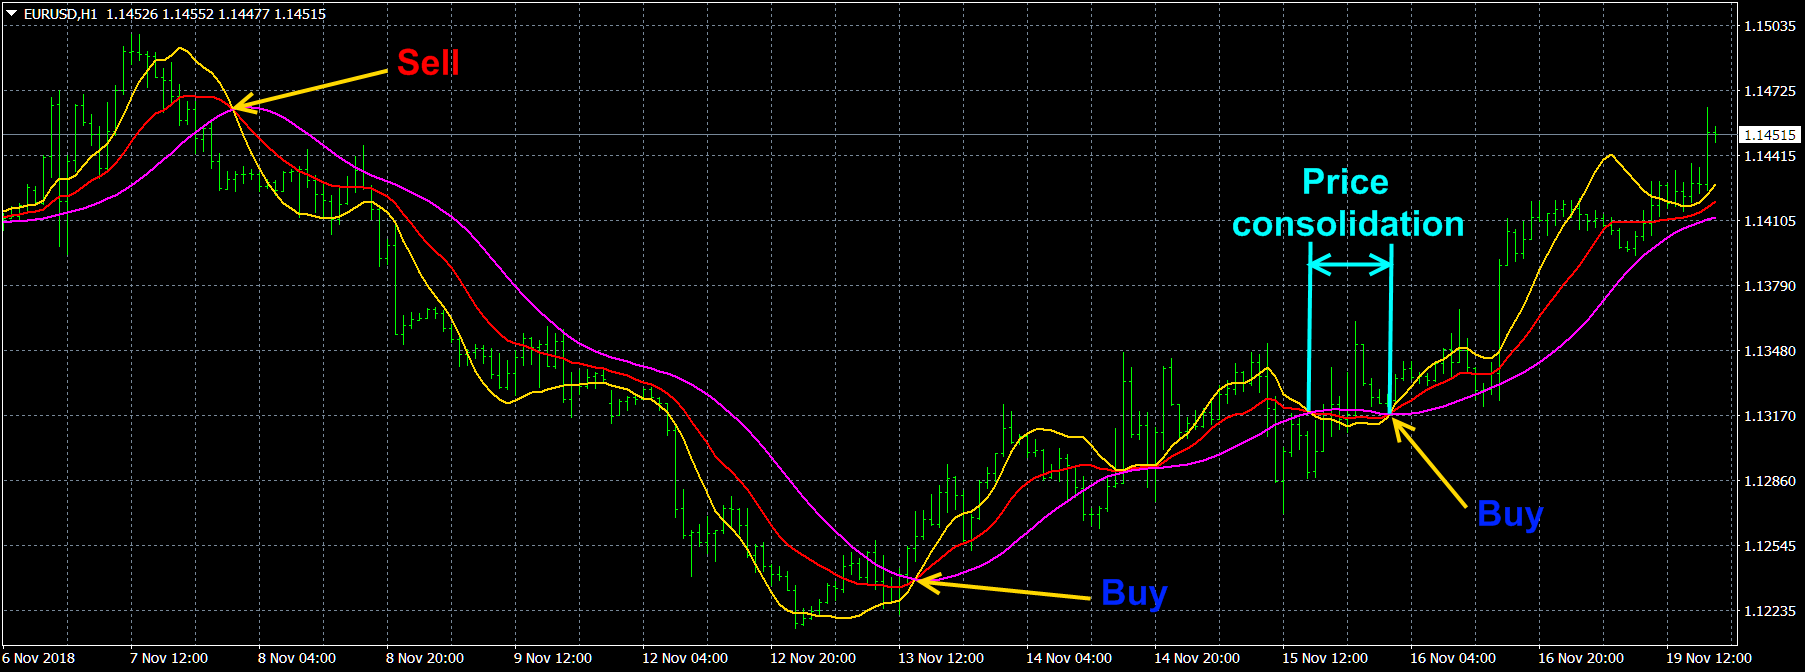
2) 🏆 Indicateurs statistiques (pour déterminer la tendance mondiale).
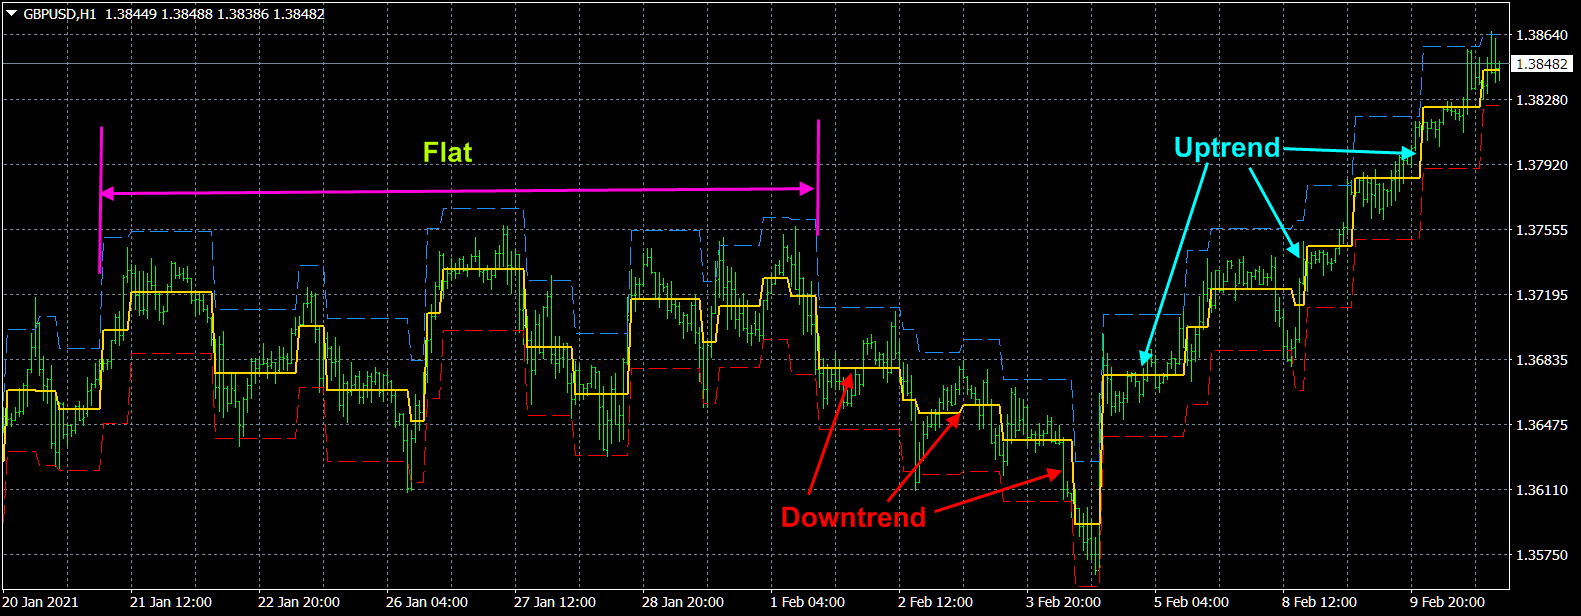
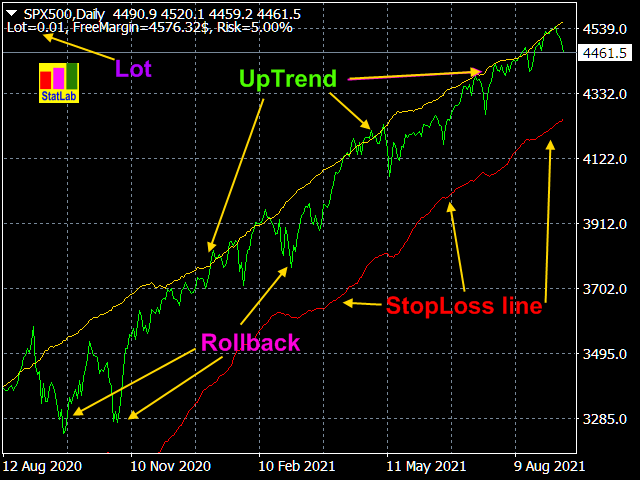
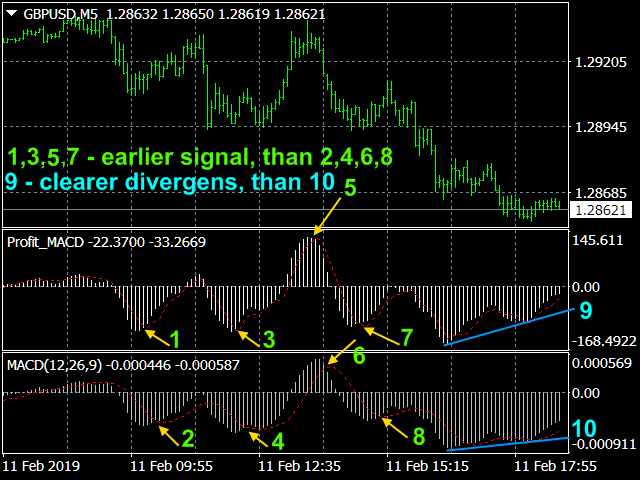
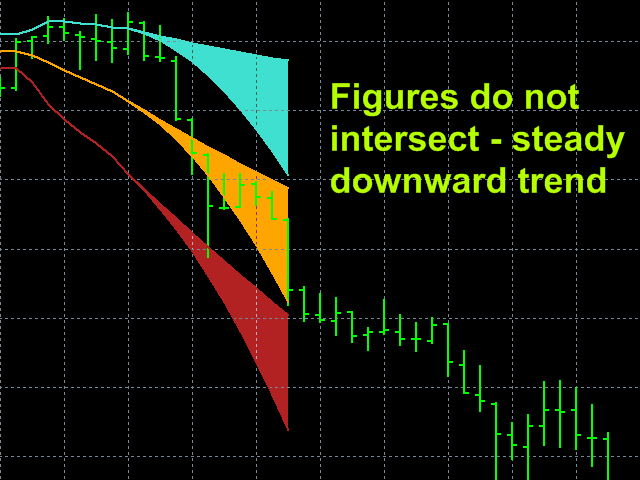
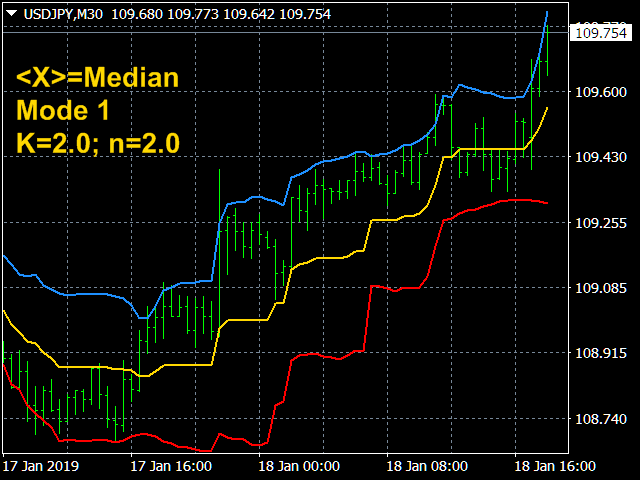
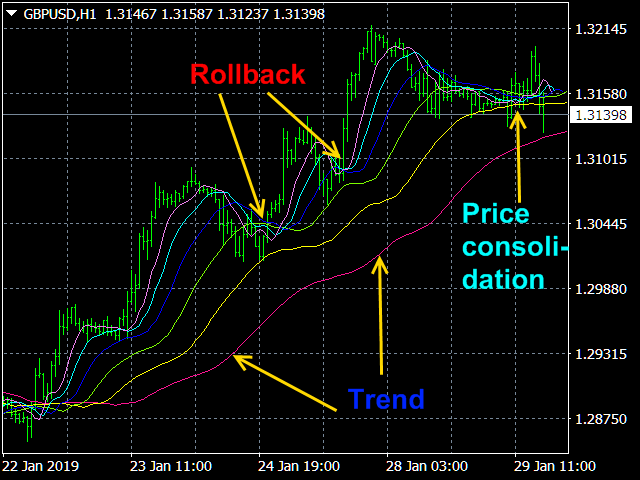
3) 🏆 Indicateurs d'études de marché (pour clarifier la microstructure des prix, construire des canaux, identifier les différences entre les inversions de tendance et les reculs).
----------------------------------------------------------------------------------------------------------------------------------
☛ Plus d'informations sur le blog https://www.mql5.com/en/blogs/post/741637
Aleksey Ivanov
Aleksey Ivanov
Iterative Moving Average https://www.mql5.com/en/market/product/31714
Iterative Moving Average – IMA. IMA is obtained by correcting the usual MA. The correction consists in addition to MA averaged difference between the time series (X) and its MA, i.e. IMA(X)=MA(X) + MA (Х-MA(X)). Correction is done in several iterations (and, exactly, 2 iterations in this indicator) and with a change in the averaging period.
As a result, the time-series points begin to cluster around (on all sides) of the getting IMA and with a smaller delay than around the usual MA. Therefore, IMA is a more effective tool for manual and automatic trading than all types of conventional MA (SMA, EMA, SSMA, LMA).
✔️The algorithms of this indicator are unique and developed by their author
produit partagé
Avis: 1
30.00 USD

              Iterative Moving Average – IMA.   IMA is obtained by correcting the usual   MA.   The correction consists in addition   to MA averaged difference between the time series (X) and its MA, i.e.   IMA(X)=MA(X) + MA ( Х -MA(X)). Correction is done in several iterations (and, exactly, 2 iterations in this indicator) and with a change in the averaging period

Aleksey Ivanov
Aleksey Ivanov
Signal Bands https://www.mql5.com/en/market/product/29171
Signal Bands is a sensitive and convenient indicator, which performs deep statistical processing of information. It allows to see on one chart (1) the price trend, (2) the clear price channel and (3) latent signs of trend change. The indicator can be used on charts of any periods, but it is especially useful for scalping due to its high sensitivity to the current market state.
✔️The indicator has all types of alerts.
✔️The indicator does not redraw.
✔️The algorithms of this indicator are unique and developed by their author
Stefan Giehler
Stefan Giehler 2022.12.31
why not with arrow for buy and sell ?
Aleksey Ivanov
Aleksey Ivanov 2023.01.01
In the settings of this indicator, there is a function to display such arrows.
produit partagé

49.00 USD

Signal Bands is a sensitive and convenient indicator, which performs deep statistical processing of information. It allows to see on one chart (1) the price trend, (2) the clear price channel and (3) latent signs of trend change. The indicator can be used on charts of any periods, but it is especially useful for scalping due to its high sensitivity to the current market state. The functions of the indicator : First, the Signal Bands indicator draws channels into which all price fluctuations

Aleksey Ivanov
Aleksey Ivanov
Robust filter https://www.mql5.com/en/market/product/52668
The Robust filter indicator is based on the robust filtering algorithm developed by the author using the multi-period averaged moving median.
The indicator calculates and shows:
✔️1. The direction of the trend;
✔️2. Entry and exit points of positions;
✔️3. StopLoss lines calculated from current price probability distributions and selected probability of closing an order by StopLoss before the trend reversal;
✔️4. Lot sizes based on the accepted risk level, deposit size and StopLoss position.
============================================================
✔️The indicator has all kinds of alerts.
✔️The indicator does not redraw.
✔️The indicator can be used both for trading scalper strategies and for long-term trading strategies.
produit partagé
Avis: 1
49.00 USD

            The Robust filter   indicator is based on the robust filtering algorithm developed by the author using the multi-period averaged moving median. The algorithm for this averaging is shown in the last screenshot.                The indicator calculates and shows: 1. The direction of the trend; 2. Entry and exit points of positions; 3. StopLoss   lines

Aleksey Ivanov
Aleksey Ivanov
Probabilities distribution of price https://www.mql5.com/en/market/product/27070
Indicator is used for:
1. defining price probability distributions. This allows for a detailed representation of the channel and its borders and forecast the probability of a price appearing at each segment of its fluctuations;
2. defining the channel change moment.
✔️The algorithms of this indicator are unique and developed by their author
✔️ It has built-in management
produit partagé

PDP indicator is used for: defining price probability distributions. This allows for a detailed representation of the channel and its borders and forecast the probability of a price appearing at each segment of its fluctuations; defining the channel change moment. Operation principles and features PDP analyzes a quote history on lower timeframes and calculates a price probability distribution on higher ones. Forecast algorithms allow the indicator to calculate probability distributions and

Aleksey Ivanov
Aleksey Ivanov
Prof MACD (MT5) https://www.mql5.com/en/market/product/65276
✔️ One of my most profitable indicators with optimal filtering.
✔️The algorithms of this indicator are unique and developed by their author
✔️The indicator has all kinds of alerts.
✔️ The indicator does not redraw.
produit partagé
Avis: 1
49.00 USD

          I present an indicator for professionals. Prof MACD is very similar to classic MACD in appearance and its functions . However, Prof MACD is based on completely new algorithms (for example, it has only one averaging period) and is more robust, especially on small timeframes, since it filters random price walks. The classic MACD indicator (Moving Average Convergence / Divergence) is a very good indicator following the trend, based on the

Aleksey Ivanov
Aleksey Ivanov
Asummetry https://www.mql5.com/en/market/product/40005
The Asummetry indicator allows you to predict the beginning of a change in the direction of trends, long before their visual appearance on the price chart.
✔️The algorithms of this indicator are unique and developed by their author
produit partagé

30.00 USD

The principle of the indicator.                             The Asummetry  indicator allows you to predict the beginning of a change in the direction of trends, long before their visual appearance on the price chart.               The author statistically revealed that before changing the direction

Aleksey Ivanov
Aleksey Ivanov
Strong Trend Flat Signal https://www.mql5.com/en/market/product/37203
The Strong Trend Flat Signal indicator is the intersection of two, developed by the author, non-lagging moving averages with averaging periods 21 and 63.
✔️The algorithms of this indicator are unique and developed by their author
Author Aleksey Ivanov https://www.mql5.com/en/users/60000382
produit partagé

The principle of the indicator.               The Strong Trend Flat Signal (STFS) indicator is the intersection of two, developed by the author, non-lagging moving averages with averaging periods 21 and 63.               A simple moving average (SMA) with an averaging period (2n + 1) of bars is always obtained lagging by n bars. If SMA or other types of moving

Aleksey Ivanov
Aleksey Ivanov
Probability distribution PRO https://www.mql5.com/en/market/product/41174
Indicator is used for:
1. defining price probability distributions. This allows for a detailed representation of the channel and its borders and forecast the probability of a price appearing at each segment of its fluctuations;
2. defining the channel change moment.
✔️The algorithms of this indicator are unique and developed by their author
produit partagé

Indicator is used for: defining price probability distributions. This allows for a detailed representation of the channel and its borders and forecast the probability of a price appearing at each segment of its fluctuations; defining the channel change moment.   Operation principles and features Indicator analyzes a quote history on lower timeframes and calculates a price probability distribution on higher ones. Forecast algorithms allow the indicator to calculate probability distributions

Aleksey Ivanov
Aleksey Ivanov
Absolute Bands FREE https://www.mql5.com/en/market/product/33826
The Absolute Bands indicator is reminiscent of the Bollinger Bands indicator with its appearance and functions, but only more effective for trading due to the significantly smaller number of false signals issued to them. This effectiveness of the Absolute Bands indicator is due to its robust nature.
✔️ One of the best indicators with optimal market noise filtering.
Aleksey Ivanov
Aleksey Ivanov
StatPredict https://www.mql5.com/en/market/product/38721
✔️The indicator predicts the price in accordance with the prevailing trend and its own small statistical price fluctuations around this trend. Using mathematical methods for predicting random processes, StatPredict indicator predicts the most probable values of the future price and calculates the confidence interval for them.
✔️StatPredict also provides the option to calculate the lot, based on the positions of the last points of the calculated channel of confidence probability, as well as the size of the deposit and the allowable risk, which are specified in the indicator settings.
✔️The algorithms of this indicator are unique and developed by their author
Aleksey Ivanov
Aleksey Ivanov
Velocity of price change https://www.mql5.com/en/market/product/62315
The Velocity of price change indicator shows the average rate of price change at those characteristic time intervals where this rate was approximately constant. The robust algorithm used in Velocity of price change to smooth out the price from its random jumps, ensures the reliability of the indicator reading, which does not react to simple price volatility and its insignificant movements.
✔️The algorithms of this indicator are unique and developed by their author
produit partagé
Avis: 1
30.00 USD

              The Velocity of price change   ( VP ) indicator shows the average rate of price change at those characteristic time intervals where this rate was approximately constant. The robust algorithm used in VP   to smooth out the price from its random jumps, ensures the reliability of the indicator reading, which does not react to simple price volatility and its insignificant movements