Versus USD MT5
- Indicateurs
- Vonjinirina Alfred Randrianiaina
- Version: 1.10
- Mise à jour: 5 mai 2023
- Activations: 10
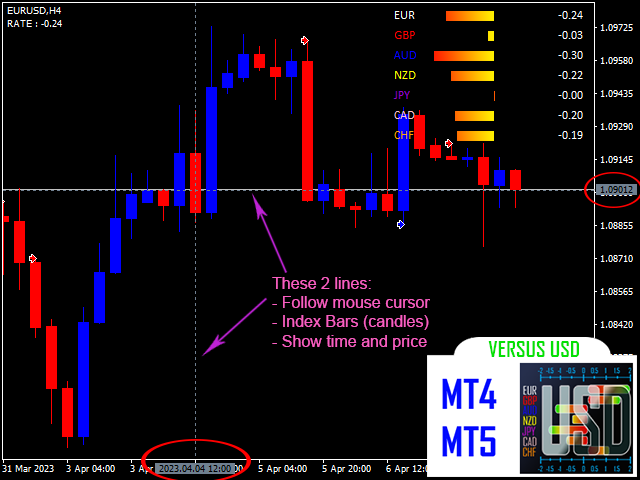
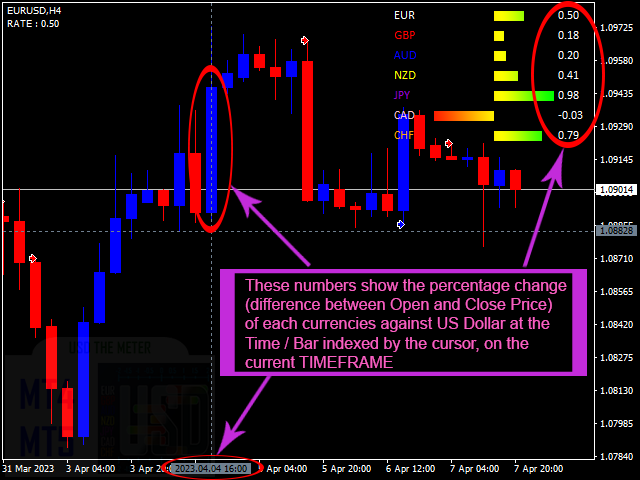
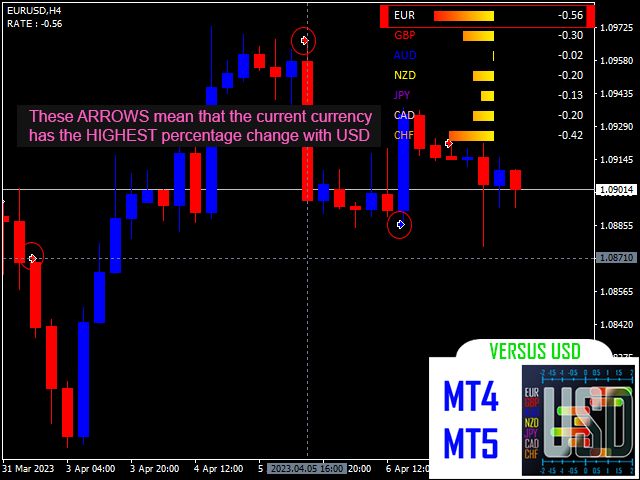
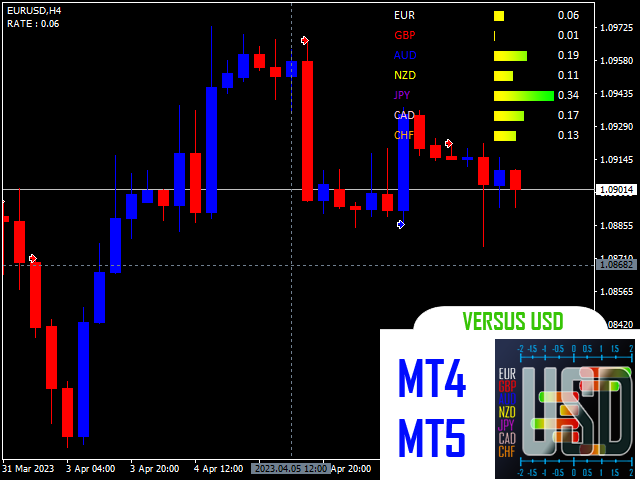
Versus USD calcule la variation de prix de chaque devise majeure contre le USD et affiche une vue claire et comparative de leur performance pour chaque période ou bar indexée par le curseur dans le Timeframe actuel du graphique avec des barres de progression. De plus, il marque une flèche sur la bar/période où la devise en question a connu le taux de changement le plus élevé ou le plus faible face au USD par rapport aux autres devises, offrant ainsi une mesure plus précise de la performance de la devise.
Le Dollar US est la devise principale pour mesurer la performance de chaque devise majeure dans le marché des changes car il est la monnaie la plus liquide et la plus largement utilisée dans les transactions internationales. En outre, la plupart des transactions sur le forex impliquent le Dollar US en tant que devise de base ou de cotation, ce qui facilite la comparaison et l'évaluation des performances des autres devises.
Quel que soit votre niveau d'expérience en trading forex et votre style de trading, que vous ayez déjà une stratégie rentable ou non, cet indicateur peut propulser vos compétences en un rien de temps. De plus, il est facile à utiliser car il présente les caractéristiques suivantes :
- Compatible avec les 28 paires majeures
- Fonctionne avec tous les Timeframes (M1 - MN)
- Pas besoin de configuration, tout est automatisé.
- Disponible sur MT4 et MT5
PREREQUIS:
1. Pour utiliser l'indicateur correctement, les données historiques des sept paires majeures doivent être synchronisées et mises à jour, et il est recommandé d'ouvrir les graphiques de ces paires, même si vous n'utilisez pas l'indicateur avec l'une d'entre elle.
Ces 7 paires majeur sont :
- EURUSD
- GBPUSD
- AUDUSD
- NZDUSD
- USDJPY
- USDCAD
- USDCHF
2. Il est crucial que les données historiques des autres symboles utilisés avec l'indicateur soient également à jour et synchronisées avec celles des sept paires majeures.
RECOMMENDATIONS:
- Je recommande vivement aux utilisateurs d'utiliser l'indicateur avec les paires de devises contenant le JPY car il est beaucoup plus fiable et précis avec ces paires.
- Attendre que les données historiques des 7 paires majeures (contenant USD), ainsi que la paire avec laquelle vous allez utiliser l'indicateur, soient à jour et synchronisées avant d'ajouter Versus USD à votre graphique afin d'éviter d'éventuels bugs.
- Si l'indicateur rencontre un bug, je vous suggère de changer de timeframe pour un autre, puis revenir sur le timeframe souhaité.
En somme, cet indicateur est un outil exceptionnel et utile pour le trading forex, offrant des fonctionnalités inédites. Nous apprécierions grandement vos commentaires et vos retours sur son utilisation.
Join the Versus USD chat if you have questions or reports or something else about the indicator.
Versus USD MT4 : https://www.mql5.com/fr/market/product/97127