Big Figure Indicator MT5
- Indicateurs
- Vonjinirina Alfred Randrianiaina
- Version: 1.2
- Mise à jour: 10 avril 2023
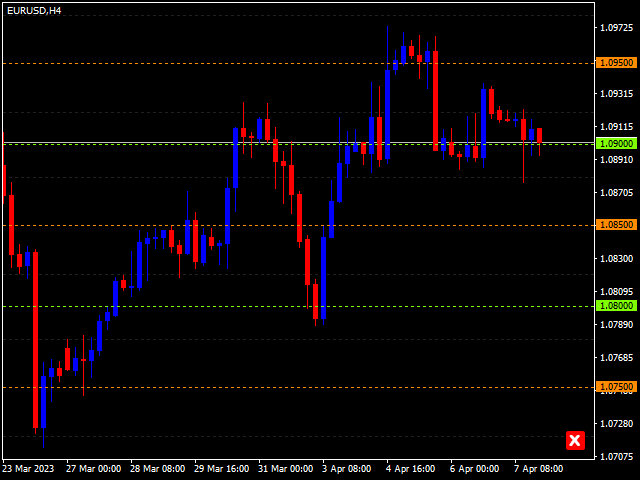
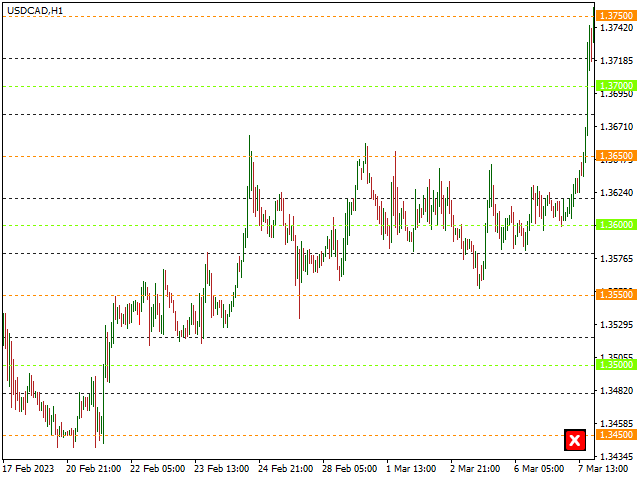
"BIG FIGURE INDICATOR" identifie et dessine automatiquement des lignes horizontales sur les graphiques de prix à des niveaux spécifiques, tels que des nombres entiers ou des demi-chiffres (par exemple, 1,0000 ou 1,5000 dans le commerce des devises). Ces niveaux sont considérés comme psychologiquement significatifs car ils représentent des chiffres ronds sur lesquels les grands traders et les investisseurs peuvent se concentrer, conduisant à des niveaux de support ou de résistance potentiels. Cette indicateur peut aider les traders à identifier les niveaux de prix importants et à prendre des décisions commerciales en fonction de ces niveaux.
- Les lignes ne sont visibles qu'entre M1 et H8 TIMEFRAME Chart
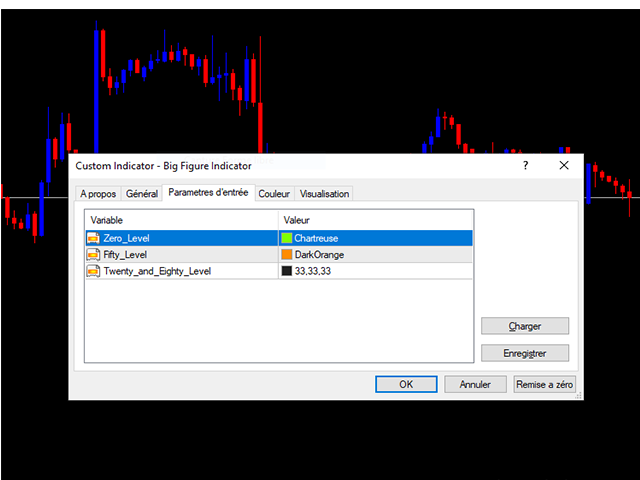
- La couleur des lignes peut être modifiée dans l'onglet Paramètres des entrées
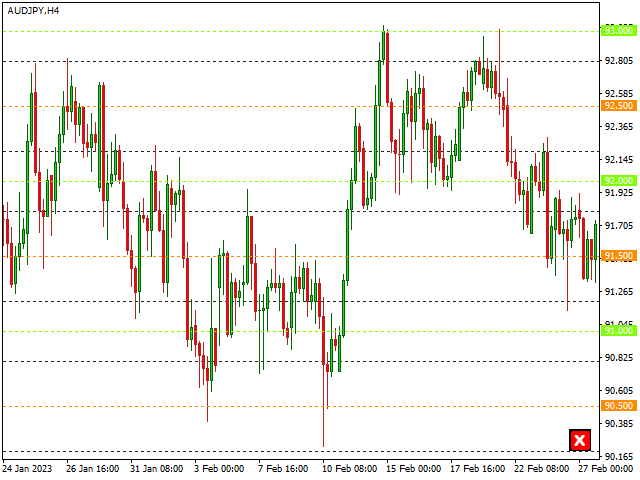
- Utilisable avec toutes paires de devises
Version MT4 : https://www.mql5.com/fr/market/product/96747
NOTE : Il est nécessaire de charger en premier lieu le timeframe D1 pour le meilleur fonctionnement de notre indicateur


Muy útil gracias